COINTEGRATION OF INDONESIA’S STOCK MARKET AND AMERICA AT THE PERIOD OF AND RECOVERY FROM GLOBAL FINANCIAL CRISIS
Ristanti Akseptori1, Marya Mujayana2
STMIK STIKOM SURABAYA INDONESIA
E-Mails: ristanti@stikom.eduana@stikom.edu
ABSTRACT
This study aims to investigate the integration of capital market of Indonesia and America as a result of the global financial crisis. Indonesian capital market is represented by the Composite Stock Price Index, while the American stock market is represented by the S & P500. In addition to the influence of foreign capital market condition (S & P500) as the external factor of country’s economy, the Indonesian capital market is influenced by economic conditions in the country, including the exchange rate and foreign transaction (net foreign flow). External and internal factors can affect the stability of the financial system of a country. To find the integration of world capital markets and Indonesian financial system stability due to the global financial crisis, this study was conducted in two periods, they are the period of global financial crisis (July 2007-December 2010) and the period after global financial crisis (January 2011- December 2013).
This study used a quantitative approach using the Johansen Cointegration Test. Monthly data were analyzed using the method of Ordinary Least Square (OLS).
The result of this study showed that there is no cointegration between Jakarta Composite Index and S&P500 in the period of crisis and recovery. It means there is short term relationship. This prove showed that there is integration between Jakarta Composite Index and S&P500. When there is collapse in S&P500, so did the Indonesia stock market. While internal factors, net foreign flow, showed the stability in the long relationship to the Indonesia Stock Market.
Keywords: Integration, Stock Market, Cointegration Test, Global Financial Crisis.
INTRODUCTION
Capital market has a role as a source of long-term financing for corporations and investors. Integrated world capital markets will provide opportunities for companies and investors to raise capital efficiently. Investors can make investments with broader diversification (not only between industries, but also between countries). The capital costs which are borne by the investor gets smaller, so the investment gets more profitable. Thus, there are more investments done so that creates greater employment. Integrated capital markets are geared to achieve the most optimal level of functionality that supports the achievement level of welfare between
countries. Thereby it increases economic development in many countries.
activity of the world stock market is severe affected. Bloomberg Database (2008) reported that from 25 July 2007 until 31 December 2008, a decrease in the S&P 500 is 40.50%. FTSE100 (UK stock market index) fell by 31.30%, the Nikkei 225 (Japan stock market index) plunged by 50.39%, the KLSE (Malaysia stock market index) fell by 36.45%, and the Jakarta Composite Index fell by 43.39%. This proves how external conditions affect the country's economy activities of the country.
The integration of world capital markets is a topic that has been studied since the world stock market crash in October 1987. Preliminary studies carried out on the stock market were developed by countries like the United States, European countries, Japan. After the Asian crisis, many studies began to focus their research on the emerging markets of Asia. With the background of the global financial crisis, previous research concerning the integration of America with the Malaysian stock market has been studied by Khalifa and Gallato (2012). The findings showed that when the American stock market collapsed, so did the Malaysian stock market, but the exchange rate (forex) as a country's macroeconomic variables, did not significantly affect the Malaysian stock market during the global financial crisis. This finding proves the existence of a country's capital market integration with other countries, while the domestic capital market conditions are formed as a result of macro-economic aggregates. This study focuses on the integration of capital markets of Indonesia and America as the country of the crisis origin to determine how much Indonesia is affected by the crisis shock. In addition, macro-economic variables such as exchange rate and foreign transaction are considered as variables to determine the resilience of the domestic capital market conditions. This research was carried out by using Johansen Cointegration Test in two periods, namely the period of the global crisis and the recovery from the crisis.
CONTEXT AND REVIEW OF LITERATURE Capital Market Integration
Integrated international capital market is a condition in which there are no barriers whatsoever to have any securities in the capital markets, and also there are no obstacles in the capital inflow/outflow). In this case, the stability of the world financial system needs to be in good shape to be able to support the smooth capital inflow/outflow. The presence of shock that occurs in the world's financial system can have an impact on the capital inflow/outflow. The occurrence of shock can lead to negative market sentiment, the condition in which many investors withdraw their funds in the stock market due to concerns about the security of their investment. In an integrated market, the breakdown of the capital inflow/outflow in a market can impact the overall market conditions. This occurs in the period of the global crisis 2008, where the American financial system crash impact capital inflow/outflow to other countries such as Britain, Japan, Malaysia, Indonesia, etc. This is proved from the decrease of stock index movements in the stock market. The results of the research supporting this analysis is Koh and Mayasami (1996) using a trivariate vector error-correlation model (VECM) on the effect of the global market shares of the cointegration in the Singapore Stock Exchange that at the level of the market, America, Japan and Singapore are significantly cointegrated in positive.
Johansen Cointegration Test
Mobarek states several tests which can be used to test the integration of the stock markets are multivariate GARCH, vector auto regression (VAR), Unit root test, and various cointegration tests. Johansen Cointegration Test is used to look at the long term relationship of the variables under study so that the estimation of this research can be used to look at the long-term equilibrium relationship of the two variables studied. The two variables which are not stationary before differenced but stationary at first difference, it is possible for cointegration (there is a long-term relationship between the two). Cointegration hypothesis is widely used by researchers to test the integration of international financial markets. Bekaert and Harvey (1995) emphasizes that a stock market is integrated with the world stock market if the asset has a value corresponding to the expected return of asset markets that have the identical level of risk that is listed in the world market. In this case applies the law of one price. The nature and degree of integration of financial markets are very helpful for international investors in influencing the decision of potential asset allocation on portfolio diversification. Majid and Kassim (2009) explores the standard time series vector autoregressive technique to determine whether cross-market relations of Indonesia and Malaysia stock cross-market change in the period before and during the crisis. Research results support the general view that the stock market tends to show a greater degree of integration or co-movement increased during periods of crisis.
Research Framework
Capital market integration is a relationship between two or more capital markets of countries. If one market is experiencing shocks, such as a change in the stock price index, it will give a good effect in the long term as well as short-term on capital markets on integrated country. Its effects can be positive or negative. If there is capital market integration, the results of the analysis will show a trend of increase or decrease with the same for each country. The integration of capital markets provides an opportunity for investors to make a profit, which in turn boost the economy of the countries. However, the integration of capital markets can overwhelm the fragile capital markets. This occurs because the capital markets are susceptible easily affected by capital market volatility that occurred in oth er countries. Investors become reluctant to invest in a volatile market.
METHOD
This study is a descriptive and conclusive study. Dependent variable in this study is Jakarta Composite Index (www.finance.yahoo.com), while the independent variables are the S & P500 (www.finance.yahoo.com), exchange rate (www.bi.go.id), and foreign transactions (www .idx.co.id). The data analyzed is quantitative data analysis. The period of study was divided into two, namely the global crisis period (July 2007-December 2010) and the period of recovery or after the global crisis (January 2011-December 2013).
stationary of the variables used in the study. Unit root test is done using Augmented Dickey Fuller test (ADF). Furthermore, partial cointegration test is done between the independent variables (one by one) and the dependent variable to determine the possibility of a long-term relationship between the variables. In this study, it is conducted by the Johansen Cointegration Test. Basic operational model for this study is:
JCI = α0+ α 1GSPC + α2kurs + α3NF + ε... (1)
Where JCI is a monthly index of stock price index (Composite Stock Price Index) in Indonesia Stock Exchange, GSPC is S&P500 as one of the American stock index, kurs is the exchange rate, and NF are Nett Foreign Flow/buy-sell). Tests were carried out using Eviews 4.
FINDINGS
Classical Test Assumptions
a. Normality Test
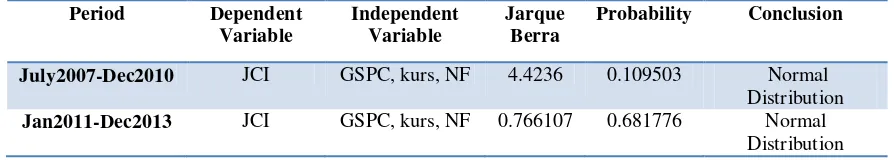
Normality test is done by Jarque-Berra testing. The results show that in the period of July 2007-December 2010 and January 2011 – Desember 2013, research variables are normally distributed with Jarque-Berra value greater than 0.05.
Table 1. Normality Test Result
Period Dependent Variable
Independent Variable
Jarque Berra
Probability Conclusion
July2007-Dec2010 JCI GSPC, kurs, NF 4.4236 0.109503 Normal Distribution
Jan2011-Dec2013 JCI GSPC, kurs, NF 0.766107 0.681776 Normal Distribution
b. Multicollinearity test
To know whether the data used are free from multicollinearity or not, auxiliary regression is performed. The followings are the results of multicollinearity test using a correlation matrix.
Table 2. Multicolinearity Test Result
Period of July2007-December2010 Period of January2011-December2013
Variable GSPC Kurs NF GSPC Kurs NF
GSPC 1 -0.723800379567 0.0845617379227 1 0.896209287 -0.297777458
NF 0.0845617379227 0.0249026197486 1
-0.297777458
-0.300949967
1
From the correlation matrix above, it is known that in the period of July 2007 - December 2010 and the period of January 2011 - December 2013, there are multicollinearity disturbance in the presence of serial correlation on the exchange rate and GSPC variables. Correlation values in the correlation matrix that is more than 50% indicated a correlation between the independent variables. Prediction models will be allowed to contain multicollinearity because the estimator can still be BLUE (Best Linear Unbiased Estimator). Winarno (2009) states that BLUE characteristics are not affected by the presence or absence of correlation between the independent variables.
c. Autocorrelation Test
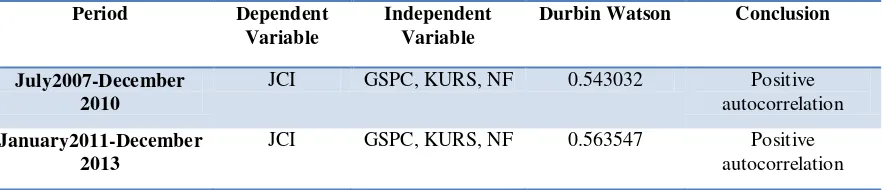
Testing autocorrelation in this study was performed using the Durbin-Watson test. Winarno (2009) states that the value of d which describes the DW coefficient is in the range of 0 to 4. If the value of d is in between 1.54 and 2.46 then there is no autocorrelation, and if the value of d is in between 0 to 1.10, it means that the data contains positive autocorrelation . Below is a table of autocorrelation test results of the two periods used in this study.
Table 3 Autocorrelation Test Results
Table 3 Autocorrelation Test Result Period Dependent
Variable
Independent Variable
Durbin Watson Conclusion
July2007-December 2010
JCI GSPC, KURS, NF 0.543032 Positive
autocorrelation
January2011-December 2013
JCI GSPC, KURS, NF 0.563547 Positive
autocorrelation
d. Heteroscedasticity Test
been provided by EViews. This method has weighting criteria based on cross section weights and activates White heteroscedasticity consistent covariance.
Table 4. Heteroscedasticity TestResult Dependent
Variable
Independent Variable
Obs*R-squared Probability
Conclusion
JCI GSPC, KURS, NF 0.831711 Non heteroskedastis
JCI GSPC, KURS, NF 0.766914 Non heteroskedastis
Unit Root Test
To test the degree of stationary of data as a prerequisite for co-integration test, a method unit root test is done by using Augmented Dickey Fuller test (ADF) testing models. Winarno (2009) states that a stationary variable has a value of Prob. smaller than 5%. The results show that all study variables are stationary at first different levels except the variable of exchange rate for the period of January 2011 to December 2013. That’s why, for the next cointegration test, the variable of exchange rate is not included in the test. The results of the unit root test are presented in the following table.
Table 5. Unit Root Test Result
No Variable Period of July2007–Dec 2010 Period of Jan2011-Dec2013
Level 1st Difference Level 1st Difference
ADF ADF ADF ADF
1 JCI 0,202646 -4.683338*** -1,93829 -5.239263***
Independent Variable
1 GSPC -2,366957 -4.503631*** 0.645668 -7.555875***
2 Kurs -1.436343 -5.002358*** 3.690280 -2.935020*
3 NF -6.239045*** -8.479691*** -5.241735*** -9.851169***
*** signifikant at 1% ; ** significant at 5% ; * significant at 10%
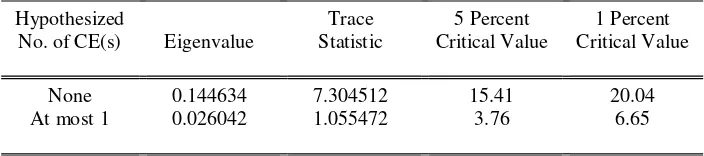
Cointegration test
Table 6. Cointegration Test of JCI – GSPC July2007 – December -2010
Date: 07/22/14 Time: 16:06 Sample(adjusted): 2007:09 2010:12 Included observations: 40 after adjusting endpoints
Trend assumption: Linear deterministic trend Series: JCI GSPC
Lags interval (in first differences): 1 to 1
Unrestricted Cointegration Rank Test
Hypothesized Trace 5 Percent 1 Percent
No. of CE(s) Eigenvalue Statistic Critical Value Critical Value
None 0.144634 7.304512 15.41 20.04
At most 1 0.026042 1.055472 3.76 6.65
*(**) denotes rejection of the hypothesis at the 5%(1%) level Trace test indicates no cointegration at both 5% and 1% levels
Table 7. Cointegration Test of JCI – Kurs July2007 – December 2010
Date: 07/22/14 Time: 16:06 Sample(adjusted): 2007:09 2010:12 Included observations: 40 after adjusting endpoints
Trend assumption: Linear deterministic trend Series: JCI KURS
Lags interval (in first differences): 1 to 1
Unrestricted Cointegration Rank Test
Hypothesized Trace 5 Percent 1 Percent
No. of CE(s) Eigenvalue Statistic Critical Value Critical Value
None 0.174201 7.682903 15.41 20.04
At most 1 0.000668 0.026734 3.76 6.65
*(**) denotes rejection of the hypothesis at the 5%(1%) level Trace test indicates no cointegration at both 5% and 1% levels
Table 8. Cointegration Test of JCI – Net Foreign Flow July2007 – December 2010
Date: 07/22/14 Time: 16:07 Sample(adjusted): 2007:09 2010:12 Included observations: 40 after adjusting endpoints
Trend assumption: Linear deterministic trend Series: JCI NF
Lags interval (in first differences): 1 to 1
Unrestricted Cointegration Rank Test
Hypothesized Trace 5 Percent 1 Percent
None ** 0.633894 40.32023 15.41 20.04
At most 1 0.003169 0.126963 3.76 6.65
*(**) denotes rejection of the hypothesis at the 5%(1%) level Trace test indicates 1 cointegrating equation(s) at both 5% and 1% levels
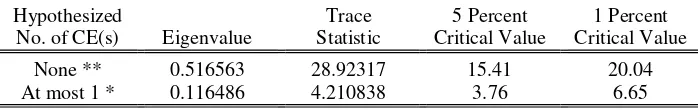
Variable JCI – Exchange Rate is not involved in the cointegration testing for the period of January 2011- December 2013 because these variables are not stationary. Cointegration test results after the period of January 2011-December 2013 show a cointegration between JCI - Net Foreign Flow, whereas JCI – GSPC variables are not cointegrated . Cointegration test results are presented in the following table:
Table 9. Cointegration Test of JCI – GSPC January2011- December 2013
Date: 07/22/14 Time: 16:08 Sample(adjusted): 2011:03 2013:12 Included observations: 34 after adjusting endpoints
Trend assumption: Linear deterministic trend Series: JCI GSPC
Lags interval (in first differences): 1 to 1
Unrestricted Cointegration Rank Test
Hypothesized Trace 5 Percent 1 Percent
No. of CE(s) Eigenvalue Statistic Critical Value Critical Value
None 0.162038 6.190580 15.41 20.04
At most 1 0.005279 0.179962 3.76 6.65
*(**) denotes rejection of the hypothesis at the 5%(1%) level Trace test indicates no cointegration at both 5% and 1% levels
Table 10. Cointegration Test of JCI – Net Foreign Flow January2011- December 2013
Date: 07/22/14 Time: 16:08 Sample(adjusted): 2011:03 2013:12 Included observations: 34 after adjusting endpoints
Trend assumption: Linear deterministic trend Series: JCI NF
Lags interval (in first differences): 1 to 1
Unrestricted Cointegration Rank Test
Hypothesized Trace 5 Percent 1 Percent
No. of CE(s) Eigenvalue Statistic Critical Value Critical Value
None ** 0.516563 28.92317 15.41 20.04
At most 1 * 0.116486 4.210838 3.76 6.65
DISCUSION
Series of analysis test on monthly time series data for the period of July 2007-December 2010 and January 2011-December 2013 show that the variables are not stationary at level but stationary at level one (first difference), except for the variable of exchange rate for the period of January 2011-December 201, so the variable of exchange rate is not included in the modeling. Although it has the same order of integration,at the first difference, by using the Johansen Cointegration Test test, there is no cointegration at JCI - GSPC, and JCI - Exchange rate (for the period of July 2007 - December 2010). Similarly to JCI - GSPC for the period of January 2011 - December 2013. This means that there is no balance in the long-term on the variable relationship of JCI - GSPC and JCI - Exchange in the period of July 2007 - December 2010, JCI - GSPC January 2011- December 2013. Cointegration relationships found in JCI - Net Foreign Flow in two periods of the study. It is claimed that there is balance in the long-term in the relation of JCI - Net Foreign Flow in times of crisis and the recovery from the crisis. The absence of long-term balance in the relationship between JCI - GSPC in times of crisis and the recovery period show that the Indonesian capital market conditions are affected quite strongly due to shock at the S & P500 stock market. This is indicated by the movement in the short-term due to the shock that occurs. This proves that Indonesian capital markets are in a vulnerable position. If the Indonesian capital market is quite strong to face the shock, long-term balance relationship is still occurs. Unfortunately this is not happen to JCI in the period of crisis and recovery period.
Indonesian capital market conditions are vulnerable is possible because the transaction occurred in the Indonesian capital market is dominated by foreign investors. www.datacon.co.id reported that realization of foreign direct investment projects in Indonesia has increased since 2007, foreign investment realization has decreased due to the global financial crisis of 2009, in 2010 foreign investment into Indonesia increased with the increasing of Indonesia's economic growth to reach 6 , 3%. Nurhayati (2012) states that registered foreign investors hold about 60% of the total market capitalization. If there is a negative sentiment towards the market, where the investors withdrew their funds, then there is a crash by significant decrease in Composite Stock Price Index. There is also a large capital outflow and also will affect Indonesia's balance of payments. Capital market conditions that are vulnerable in the capital market integration can sink the stock market itself. In this case the concern is the investors are reluctant to invest.
CONCLUSION
Based on the Johansen Cointegration test, it is concluded that there is no cointegration at JCI-GSPC relationship at the period of crisis and recovery periods, and the relationship of JCI- exchange rate at the period of crisis. Cointegration relationships found in JCI-Net Foreign Flow in the two periods studied. These results indicate that the Indonesian capital market is not strong enough to face the shock of S & P 500 as a result of the global financial crisis. While net foreign flow as a macroeconomic variable, does not significantly affect the Indonesian capital market. It is evident from the existence of equilibrium in the long-run on this relationship.
Bekaert, G and Harvey, C. (1995). Time Varying World Market Integration. Journal of Finance Vol. 50 403-444.
Khalifa, Gawi Mohammed and Gallato, Christina A. Gervacio (2012). The Contagion Effect of The 2007 Global Financial Crisis on The Malaysian Stock Market. Indonesia International Conference on Innovation, Entrepreneurship, and Small Business. Surabaya: Ciputra University.
Kian-Ping Lim. Hock-Ann Lee and L. Khim-Sen Liew. (2003). International Diversification
Benefits in ASEAN Stock Markets: A Revisit. Labuan School of International Business and
Finance. University Malaysia, University Putra Malaysia.
Koh, Tiong Sim and Ramin Cooper Maysami. 1996. A Cointegration Analysis of the Impact of Economic Forces and Global Market Integration on the Singapore Stock Market. Nanyang Business School. Nanyang Technological University, Singapore.
Majid, M. and Kassim, S. (2009). Impact of the 2007 US Financial Crisis on the Emerging Equity Markets. International Journal of Emerging Markets Vol 4 (4), 341-357.
Mobarek, Asma. Global Stock Market Integration and the Determinants of Co-movements:
Evidence from developed and emerging countries. Stockholm University: NASDAQ OMX
Foundation. Accessed through
Nurhayati, Mafizatun. (2012). Analisis Integrasi Pasar Modal Asean Dalam Rangka Menuju
Masyarakat Ekonomi Asean. http://eprints.unisbank.ac.id/205/1/artikel-38.pdf.
Trihadmini, Nuning. (2011). Contagion dan Spillover Effect Pasar Keuangan Global Sebagai Early Warning System. Finance and Banking Journal, Vol.13 No.June 1, 2011.
Winarno. (2009). Analsis Ekonometri dan Statistika dengan EViews. Yogyakarta: UPP STIM YKPN.
http://www.datacon.co.id/ColdStorage-2011Fokus.html