COMPARATIVE CONTENTS OF
MINERALS AND DIETARY FIBRES IN SEVERAL TROPICAL SEAWEEDS
Joko Santoso1), Yumiko Yoshie-Stark2), Takeshi Suzuki2) Abstract
Nine species of Indonesian green, brown and red seaweeds were used in this experiment to study the distribution and contents of minerals and dietary fibres. The contents of macro and microminerals were detected by atomic absorption spectrophotometer and inductively coupled argon plasma emission spectrometer, respectively; whereas dietary fibres were determined according to modified enzymatic-gravimetric method. The contents of macromineral were dominated by Ca, K, Na and Mg, with values range were 11.95–28.31, 0.30–27.92, 0.66–25.74, 2.31–21.52 mg/g dry weight, respectively; whereas microminerals Cu, Fe and Zn were found in low concentration. The highest and smallest content of soluble dietary fibre were found in Kappaphycus alvarezii and Halimeda macroloba, respectively. K. alvarezii also had the highest content of total dietary fibre and percent soluble dietary fibre against total dietary fibre, whereas Ulva reticulata had highest content of insoluble dietary fibre.
Keywords: dietary fibre, Indonesia, mineral, seaweed
INTRODUCTION
From the view point of foodstuff sources, seaweeds provide high nutritional compounds of minerals, fatty acids and free amino acids (Yoshie et al., 1994; Yoshie et al., 1995; Norziah and Ching, 2000), and also provide non-nutrient compound like dietary fibres (Suzuki et al., 1993; Suzuki et al., 1996,
Wong and Cheung, 2000).
Seafood including seaweeds is known to be one of the richest sources of minerals. The most common minerals found in seafood are iodine, magnesium, calcium, phosphorus, iron, potassium, copper and fluoride (Ensminger et al., 1995). Minerals are very important for the biochemical reaction in the body as a co-factor of enzyme. For examples, Ca, P and Mg build and maintain bones and teeth, whereas Na and K help maintain balance of water, acids and bases in fluids outside of cells, and involve in acid-base balance and transfer of nutrients in and out of individual cells, respectively (Ensminger et al., 1995).
1)
Department of Aquatic Products Technology, Faculty of Fisheries and Marine Science, Bogor Agricultural University (IPB), Campus IPB Darmaga Bogor 16680 INDONESIA
2)
Defects in mineral nutrition are capable of producing severe impairment of health. For instances, Ca malnutrition causes abnormal bone formation, namely osteoporosis and anemia caused from Fe deficiency (Reinhold, 1988; Harel et al., 1998; Martinez-Navarrete et al., 2002). Deficiency in Mg can result in a variety of metabolic abnormalities, such as K depletion and clinical presentations (Schumann et al., 1997).
Although dietary fibres belong to the non-nutritional compounds, it has been recognized as an important dietary constituent, which possesses a wide range of positive properties (Rim et al., 1991; Leontowicz et al., 2002). Dietary fibre has been reported to have several physiological effects, depending upon the individual sources (Dreher, 1987). High fibre diets are an important factor in the low prevalence of colon cancer, ischemic heart disease, diabetes mellitus, gallstones, hemorrhoids and hiatus hernia, and also improving large bowel function, increasing fecal bulk, etc (Eastwood, 1989; Schneeman, 1987). Different with dietary fibre from vegetables and fruits, dietary fibres in seaweeds contain some acidic group such as sulfuric group; therefore they have different
characteristics in physicochemical and physiological effects, such as water holding capacity (Suzuki et al., 1996; Wong and Cheung, 2000), oil holding capacity (Wong and Cheung, 2000), swelling capacity (Wong and Cheung, 2000), binding of vitamins and minerals (Yoshie et al., 2000), binding of bile salts (Wang et al., 2001), and lipid metabolism effect (Wang et al., 2002).
MATERIALS AND METHODS
Materials
Nine species of Indonesian seaweeds were used in this experiment. Five green seaweeds (Caulerpa racemosa, Caulerpa sertularoides, Cladophoropsis vauchaeriaeformis, Halimeda macroloba, Ulva reticulata), three brown seaweeds
(Padina australis, Sargassum polycystum, and Turbinaria conoides), and one red seaweed (Kappaphycus alvarezii) were collected from Seribu Islands, Jakarta Province.
Samples Preparation
After removing sand, the seaweed samples were washed with clean seawater and transported to the laboratory under refrigeration condition. After washing with tap water and wiping with paper towel, seaweed samples were minced by a food cutter (MK-K75; Matsushita Electric Corp., Osaka, Japan), and stored at -20 oC until used.
Mineral Analysis
To each sample was weighed 2 g (wet sample) in a Kjeldahl flask, added
with 20 mL of concentrated nitric acid and the flask was left overnight. Five milliliters of concentrated perchloric acid and 0.5 mL of concentrated sulfuric acid were added, and then the flasks were heated until no white smoke remained. Samples were transferred into volumetric flasks using 2 % of hydrochloric acid, then analyzed by an atomic absorption spectrophotometer (Model AA-600, Shimadzu Co., Kyoto, Japan) with acetylene flame, single-slot head, and Pt-Rh corrosion resistant nebulizer for measuring the total contents of Mg, Ca, K and Na; whereas the contents of Cu, Zn, and Fe were measured using an inductively coupled argon plasma emission spectrometer (ICP Nippon Jarrel-Ash ICAP-757V, Kyoto, Japan).
Dietary Fibres Analysis
Soluble and insoluble dietary fibres were determined according to an enzymatic-gravimetric method (Prosky et al., 1988) which has been approved as the legal or recommended procedure for food analysis. However this method was modified here by using pancreatin (Suzuki et al., 1996; Plaami et al., 1989) because almost all seaweeds contain little protein and no starch. The procedure consists of following steps: (1) Boiling 2 g of wet sample with 30 mL of water for 5 min. (2) Incubation with 20 mL of 2 % pancreatin and 30 mL of phosphate buffer at pH 6.8 in the presence of NaCl (10 mM) for 24 h at 37 oC. (3) Water insoluble dietary fibre was filtered off by a glass fibre filter (GA-100, Adventec Toyo Inc., Tokyo, Japan), washed three times with 20 mL of 78 % ethanol, twice with 20 mL of 95 % ethanol and once with 10 mL of acetone, and dried at 105 oC. Water soluble dietary fibre was precipitated from the filtrate using 4 volumes of ethanol (at 60 oC) and recovered by filtration in the same way as for insoluble fibre. (5) All samples analyzed were assayed in duplicate and one of the duplicate was used to determine protein content by Kjeldahl method, while the other was
used to determine ash content in the fibre precipitate. (6) The final corrected values or the amounts of dietary fibre were calculated by subtracting the weights of ash and protein from the dietary fibre precipitate.
Statistical Analysis
Results are expressed as mean value ± standard deviation. Comparison of means of three measurements, using a significant level of p < 0.05, was performed by analysis of variance and means separated by F-test and Student’s t- test (Steell and Torrie, 1980).
RESULTS AND DISCUSSION
The Distribution and Content of Minerals
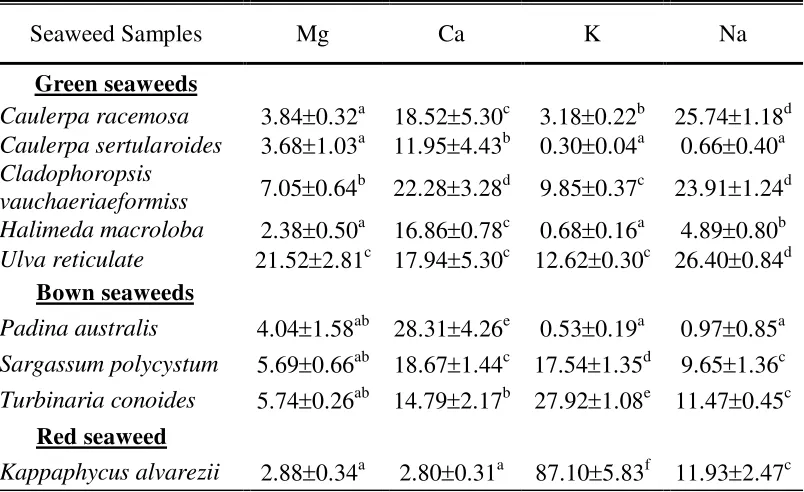
Table 1 shows the profiles and contents of macrominerals in some Indonesian seaweed samples. The high concentration of Na was found in U. reticulata (26.40 mg/g dry weight), C. sertularoides (25.74 mg/g dry weight),
weight), and S. polycystum (17.54 mg/g dry weight). The range contents of Ca and Mg were 2.80 to 28.31 mg/g dry weight and 2.38 to 21.52 mg/g dry weight, respectively. The highest and smallest concentrations of Ca were found in P. australis and K. alvarezii, whereas U. reticulata and H. macroloba contained
the highest and smallest of Mg, respectively.
Table 1. The contents of macrominerals in seaweed samples(mg/g dry weight)
Seaweed Samples Mg Ca K Na
Green seaweeds
Caulerpa racemosa 3.840.32a 18.525.30c 3.180.22b 25.741.18d Caulerpa sertularoides 3.681.03a 11.954.43b 0.300.04a 0.660.40a Cladophoropsis
vauchaeriaeformiss 7.050.64
b
22.283.28d 9.850.37c 23.911.24d Halimeda macroloba 2.380.50a 16.860.78c 0.680.16a 4.890.80b Ulva reticulate 21.522.81c 17.945.30c 12.620.30c 26.400.84d
Bown seaweeds
Padina australis 4.041.58ab 28.314.26e 0.530.19a 0.970.85a Sargassum polycystum 5.690.66ab 18.671.44c 17.541.35d 9.651.36c Turbinaria conoides 5.740.26ab 14.792.17b 27.921.08e 11.470.45c
Red seaweed
Kappaphycus alvarezii 2.880.34a 2.800.31a 87.105.83f 11.932.47c
Values are mean ± standard deviation (n = 3)
Values within columns followed by different superscript letters are significantly different (p<0.05).
The profiles and contents of macrominerals in Indonesian seaweed samples were almost same to Japanese and Spanish seaweeds, and Na, Ca, Mg
and K also became major minerals. In raw Japanese brown alga Laminaria japonica (ma-kombu in Japanese) the contents of Na, Ca, Mg and K
were 590, 75, 120 and 42 mg/100 g edible portion (Resources Council, Science and Technology Agency, 1991). In another brown seaweeds (Fucus vesiculosus,
Laminaria digitata, and Undaria pinnatifida) and red seaweeds (Chondrus cryspus and Porphyra tennera) grown in Spain, the concentration
content of Ca in Gracillaria changii grown in Malaysia was 651 mg/100 g wet weight (Norziah and Ching, 2000).
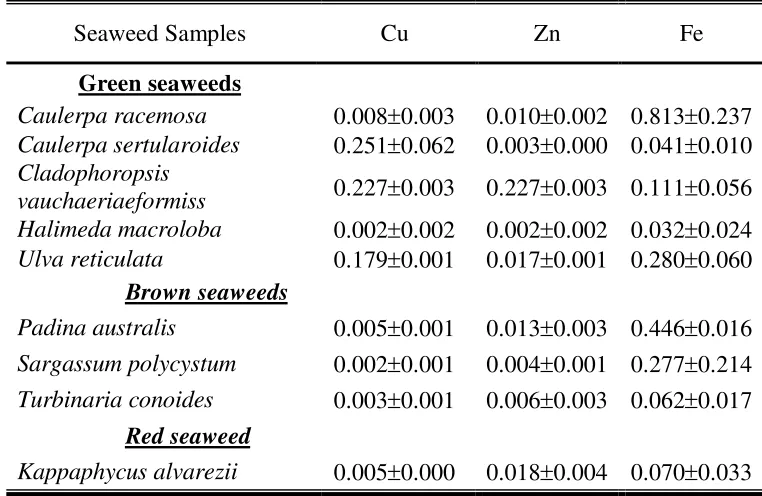
Table 2 shows the profiles and contents of micro minerals in some Indonesian seaweed samples. The concentration of Cu was from 0.002 mg/g dry weight (both in S. polycystum and H. macroloba) to 0.251 mg/g dry weight (in C. sertularoides). In other trace elements Fe and Zn, the content range were 0.032-0.813, and 0.003-0.227 mg/g dry weight, respectively. The highest content of Fe was found in C. racemosa, whereas C. vauchaeriaeformis contained the highest concentration of Zn.
Table 2. The contents of microminerals in seaweed samples(mg/g dry weight)
Seaweed Samples Cu Zn Fe
Green seaweeds
Caulerpa racemosa 0.0080.003 0.0100.002 0.8130.237 Caulerpa sertularoides 0.2510.062 0.0030.000 0.0410.010 Cladophoropsis
vauchaeriaeformiss 0.2270.003 0.2270.003 0.1110.056 Halimeda macroloba 0.0020.002 0.0020.002 0.0320.024 Ulva reticulata 0.1790.001 0.0170.001 0.2800.060
Brown seaweeds
Padina australis 0.0050.001 0.0130.003 0.4460.016 Sargassum polycystum 0.0020.001 0.0040.001 0.2770.214 Turbinaria conoides 0.0030.001 0.0060.003 0.0620.017
Red seaweed
Kappaphycus alvarezii 0.0050.000 0.0180.004 0.0700.033
Values are mean ± standard deviation (n = 3)
The Distribution and Contents of Dietary Fibres
Compared to Japanese seaweeds Porphyra yezoensis (susabi-nori in Japanese) and Enteromorpha intestinalis (ao-nori in Japanese), the contents of Fe and Zn were little bit higher than those in Indonesian seaweed samples, with range value 9.12-54.4 mg/100 g, 0.82-5.24 mg/100 g, respectively (Yoshie et al., 1999). Furthermore, the contents of Fe and Zn in brown seaweeds (F. vesiculosus, L. digitata, and U. pinnatifida) and red seaweeds (C. cryspus and P. tennera)
mg/g dry weight, respectively (Ruperez, 2002), and in red alga G. changii contained Fe 95.6 mg/100 g wet weight (Norziah and Ching, 2000).
All these Japanese seaweeds also contained Cu in low concentration (0.46-1.82 mg/100 g edible portion = 0.006-0.023 mg/g dry weight) (Japan Society for Research of Food Composition, 1995). In Spanish brown and red seaweeds the content of Cu was also small, less than 0.005 mg/g dry weight (Ruperez, 2002).
The soluble, insoluble and total dietary fibre contents of nine Indonesian green, brown and red seaweeds are shown in Table 3. The soluble dietary fibre levels in K. alvarezii were higher than other seaweeds, and the value was 10.7 g/100 g dry weight, whereas C. vauchaeriaeformis and P. australis contained moderate amount, and the values were 4.2 and 4.9 g/100 g dry weight, respectively. C. sertularoides, S. polycystum and T. conoides were found to contain relatively small amount of soluble dietary fibre, and values were 1.8, 2.3 and 2.6 g/100 g dry weight, respectively. The lowest level of soluble dietary fibre was found in H. macroloba (0.4 g/ 100 g dry weight), followed by C. racemosa
and U. reticulata, and each value was 0.9 g/100 g dry weight. On the other hands, K. alvarezii also contained the highest amount of total dietary fibre (69.3 g/100 g
dry weight); however, the content of insoluble dietary fibre was not the highest in all of the samples. Green alga U. reticulata had the highest content of insoluble
dietary fibre (64.8 g/100 g dry weight), followed by C. racemosa, S. polycystum, T. conoides, C. sertularoides and C. vauchaeriaeformis. The smallest content of
insoluble dietary fibre was found in H. macroloba containing 14.3 g/100 g dry weight; this seaweed also had the smallest content of total dietary fibre, and the value was 14.7 g/100 g dry weight.
As for the percent soluble dietary fibre against total dietary fibre, K. alvarezii was the highest (15.4 %), followed by C. vaucheriaeformis (9.0 %)
and P. australis (8.4 %). The moderate value was found in H. macroloba, C. sertularoides, S. polycystum and T. conoides, and the values were 2.5, 2.9, 3.5
Table 3. Dietary fibre contents of seaweed samples (mean ± SD g/100 g dry weight)
Seaweed Samples Total Dietary Fibre (TDF)
Insoluble Dietary Fibre
(IDF)
Soluble Dietary Fibre (SDF)
SDF/TDF (%)
Green seaweeds
Caulerpa racemosa 64.94.9de 64.13.8e 0.90.1ab 1.40.1a Caulerpa sertularoides 61.81.1cd 60.10.7de 1.80.9ab 2.91.5a Cladophoropsis
vauchaeriaeformis 47.04.8
b
42.84.8b 4.21.1cd 9.02.4b
Halimeda macroloba 14.71.6a 14.31.8a 0.40.3a 2.52.1a Ulva reticulata 65.70.9de 64.81.8e 0.90.8ab 1.41.2a
Brown seaweeds
Padina australis 56.63.8c 51.71.6c 4.92.1d 8.42.8b Sargassum polycystum 65.70.6de 63.50.9de 2.30.3abc 3.50.6a Turbinaria conoides 63.73.6d 61.04.5de 2.61.0bc 4.21.7a
Red seaweed
Kappaphycus alvarezii 69.31.8e 58.62.7d 10.71.9e 15.42.7c
Values are mean ± standard deviation (n = 3)
Values within columns followed by different superscript letters are significantly different (p<0.05).
Compared to Japanese edible seaweeds, the soluble dietary fibre content in Japanese seaweeds was higher than that in Indonesian seaweeds, and range values were 7.2-25.6 g/100 g dry weight (Suzuki et al., 1996), 7.1-25.1 g/100 g dry
weight (Yoshie et al., 2000) for Japanese seaweeds and 0.4-10.7 g/100 g dry weight for Indonesian seaweeds. On the contrary, Indonesian seaweed had the insoluble dietary fibre content (51.7-64.8 g/100 g dry weight) higher than Japanese seaweeds (15.6-58.6 g/100 g dry weight) (Suzuki et al., 1996), ( 11.3-
71.3 g/100 g dry weight) (Yoshie et al., 2000), except H. macroloba. As a consequence, Japanese seaweeds also had higher value of soluble dietary fibre to total dietary fibre in percent than Indonesian seaweeds.
CONCLUSIONS
and Fe were low. Besides nutritional compounds (minerals), Indonesian seaweeds also contained non nutrient compounds i.e. dietary fibres.
Collecting or harvesting time may influence to the composition of nutrient and non-nutrient compounds, and in this experiment sample collection was carried out only in dry season (July); therefore the composition of nutrients and non-nutrients in Indonesian seaweeds has to be analyzed in different collecting or harvesting time (i.e. rainy season).
Since dietary fibres has positive properties for human health, therefore the research activities to prove whether its compounds from seaweeds also have same function in human, through animal or culture cells tested as a model are needed.
ACKNOWLEDGEMENTS
The authors gratefully acknowledge the efforts of Mr. Satir for collecting seaweed samples, Dr. H. Oba from Laboratory of Aquaculture, Department of Aquatic Biosciences, Tokyo University of Marine Science and Technology for his help to identify seaweed samples.
REFERENCES
Dreher ML. 1997. Handbook of Dietary Fibre. Marcel Dekker Inc., New York. Eastwood M. 1989. Dietary fibres in human nutrition. J. Soc. Dairy Technol.
42: 33-34.
Ensminger AH, Ensminger ME, Konlande JE, Robson JRK. 1995. The Concise Encyclopedia of Foods and Nutrition. CRC Press, Boca Raton Florida.
Harel Z, Riggs S, Vaz R, White L, Menzeis G. 1998. Adolescents and calcium:
what they do and do not know and how much they consume. J. Adolescents Health. 22: 225-228.
Japan Society for Research of Food Composition. 1985. Standard Tables of Dietary Fibres, Minerals, Cholesterols, and Fatty Acids in Japan. Ishiyaku Shuppan, Tokyo. Japan.
Leontowicz M, Gorinstein S, Bartnikowska E, Leontowicz H, Kulasek G, Trakhtenberg S. 2001. Sugar beet pulp and apple pomace dietary fibres improve lipid metabolism in rats fed cholesterol. Food Chem. 72: 73-78. Martinez-Navarrete N, Camacho MM, Martinez-Lahuerta J, Mertinez-Monzo J,
Fito P. 2002. Iron deficiency and iron fortified foods a review. Food Res. Intern. 35: 225-231.
Plaami S, Saastamoinen M, Kumpulainen J. 1989. Effect of variety of environment on dietary fibre content of winter rye in Finland. J. Cereal Sci. 10: 209-215.
Prosky L, Asp NG, Schweizer TF, DeVries JW, Furda I. 1988. Determination of insoluble and total dietary fibre in foods and food product: Intercollaborative study. J. Assoc. Off. Anal. Chem. 71: 1017-1023. Reinhold JG. 1988. Problems in mineral nutrition: A global perspective. In:
Smith KT (ed). Trace minerals in foods. Marcel Dekker Inc., New York. pp: 1-55.
Resources Council, Science and Technology Agency. 1991. Standard Tables of Food Composition in Japan, Minerals (Magnesium, Zinc and Copper). Resources Council, Science and Technology Agency. Japan.
Rimm EB, Ascherio A, Giovannucci E, Spiegalman D. Stampfer M, Willet W. 1996. Vegetables, fruits, and cereal fibre intake and risk of coronary heart disease among men. J. Am. Med. Assoc. 275: 447-451.
Ruperez P. 2000. Mineral content of edible marine seaweeds. Food Chem. 79: 23-26.
Schneeman, BO. 1987. Soluble vs insoluble fibre different physiological responses. Food Technol. 41: 81-82.
Steell RGD, Torrie JH. 1980. Principles and Procedure of Statistic. A Biometrical Approach. McGraw-Hill Company, Inc. New York.
Suzuki T, Nakai K, Yoshie T, Shirai T, Hirano T. 1993. Digestability of dietary fibre in brown algae, kombu by rats. Nippon Suisan Gakkaishi. 59: 879-884.
Suzuki T, Ohsugi Y, Yoshie T, Shirai T, Hirano T. 1996. Dietary fibre content, water-holding capacity and binding capacity of seaweeds. Fish. Sci. 62: 454-461.
Wang W, Onnagawa M, Yoshie Y, Suzuki T. 2001. Binding of bile salts to soluble and insoluble dietary fibres of seaweeds. Fish. Sci. 67: 1169-1173.
Wang W, Yoshie Y, Suzuki T. 2002. Effect of small particle size on digestibility and lipid in rats. Nippon Suisan Gakkaishi. 68: 172-179.
Wong KH, Cheung CK. 2000. Nutritional evaluation of some subtropical red and green seaweeds. Part I – proximate composition, amino acid profiles and some physico-chemical properties. Food Chem. 71: 475-482.
Yoshie Y, Suzuki T, Shirai T, Hirano T. 1994. Changes in the contents of dietary fibres, minerals, free amino acids and fatty acids during processing of dried nori. Nippon Suisan Gakkaishi. 60: 117-123.
Yoshie Y, Suzuki T, Pandolf T, Clydesdale FM. 1999. Solubility of iron and zinc in selected seafoods under simulated gastrointestinal conditions. Food Sci. Technol. Res. 5: 140-144.
COMPARATIVE CONTENTS OF
MINERALS AND DIETARY FIBRES IN SEVERAL TROPICAL SEAWEEDS
Joko Santoso1), Yumiko Yoshie-Stark2), Takeshi Suzuki2) Abstract
Nine species of Indonesian green, brown and red seaweeds were used in this experiment to study the distribution and contents of minerals and dietary fibres. The contents of macro and microminerals were detected by atomic absorption spectrophotometer and inductively coupled argon plasma emission spectrometer, respectively; whereas dietary fibres were determined according to modified enzymatic-gravimetric method. The contents of macromineral were dominated by Ca, K, Na and Mg, with values range were 11.95–28.31, 0.30–27.92, 0.66–25.74, 2.31–21.52 mg/g dry weight, respectively; whereas microminerals Cu, Fe and Zn were found in low concentration. The highest and smallest content of soluble dietary fibre were found in Kappaphycus alvarezii and Halimeda macroloba, respectively. K. alvarezii also had the highest content of total dietary fibre and percent soluble dietary fibre against total dietary fibre, whereas Ulva reticulata had highest content of insoluble dietary fibre.
Keywords: dietary fibre, Indonesia, mineral, seaweed
INTRODUCTION
From the view point of foodstuff sources, seaweeds provide high nutritional compounds of minerals, fatty acids and free amino acids (Yoshie et al., 1994; Yoshie et al., 1995; Norziah and Ching, 2000), and also provide non-nutrient compound like dietary fibres (Suzuki et al., 1993; Suzuki et al., 1996,
Wong and Cheung, 2000).
Seafood including seaweeds is known to be one of the richest sources of minerals. The most common minerals found in seafood are iodine, magnesium, calcium, phosphorus, iron, potassium, copper and fluoride (Ensminger et al., 1995). Minerals are very important for the biochemical reaction in the body as a co-factor of enzyme. For examples, Ca, P and Mg build and maintain bones and teeth, whereas Na and K help maintain balance of water, acids and bases in fluids outside of cells, and involve in acid-base balance and transfer of nutrients in and out of individual cells, respectively (Ensminger et al., 1995).
1)
Department of Aquatic Products Technology, Faculty of Fisheries and Marine Science, Bogor Agricultural University (IPB), Campus IPB Darmaga Bogor 16680 INDONESIA
2)
Defects in mineral nutrition are capable of producing severe impairment of health. For instances, Ca malnutrition causes abnormal bone formation, namely osteoporosis and anemia caused from Fe deficiency (Reinhold, 1988; Harel et al., 1998; Martinez-Navarrete et al., 2002). Deficiency in Mg can result in a variety of metabolic abnormalities, such as K depletion and clinical presentations (Schumann et al., 1997).
Although dietary fibres belong to the non-nutritional compounds, it has been recognized as an important dietary constituent, which possesses a wide range of positive properties (Rim et al., 1991; Leontowicz et al., 2002). Dietary fibre has been reported to have several physiological effects, depending upon the individual sources (Dreher, 1987). High fibre diets are an important factor in the low prevalence of colon cancer, ischemic heart disease, diabetes mellitus, gallstones, hemorrhoids and hiatus hernia, and also improving large bowel function, increasing fecal bulk, etc (Eastwood, 1989; Schneeman, 1987). Different with dietary fibre from vegetables and fruits, dietary fibres in seaweeds contain some acidic group such as sulfuric group; therefore they have different
characteristics in physicochemical and physiological effects, such as water holding capacity (Suzuki et al., 1996; Wong and Cheung, 2000), oil holding capacity (Wong and Cheung, 2000), swelling capacity (Wong and Cheung, 2000), binding of vitamins and minerals (Yoshie et al., 2000), binding of bile salts (Wang et al., 2001), and lipid metabolism effect (Wang et al., 2002).
MATERIALS AND METHODS
Materials
Nine species of Indonesian seaweeds were used in this experiment. Five green seaweeds (Caulerpa racemosa, Caulerpa sertularoides, Cladophoropsis vauchaeriaeformis, Halimeda macroloba, Ulva reticulata), three brown seaweeds
(Padina australis, Sargassum polycystum, and Turbinaria conoides), and one red seaweed (Kappaphycus alvarezii) were collected from Seribu Islands, Jakarta Province.
Samples Preparation
After removing sand, the seaweed samples were washed with clean seawater and transported to the laboratory under refrigeration condition. After washing with tap water and wiping with paper towel, seaweed samples were minced by a food cutter (MK-K75; Matsushita Electric Corp., Osaka, Japan), and stored at -20 oC until used.
Mineral Analysis
To each sample was weighed 2 g (wet sample) in a Kjeldahl flask, added
with 20 mL of concentrated nitric acid and the flask was left overnight. Five milliliters of concentrated perchloric acid and 0.5 mL of concentrated sulfuric acid were added, and then the flasks were heated until no white smoke remained. Samples were transferred into volumetric flasks using 2 % of hydrochloric acid, then analyzed by an atomic absorption spectrophotometer (Model AA-600, Shimadzu Co., Kyoto, Japan) with acetylene flame, single-slot head, and Pt-Rh corrosion resistant nebulizer for measuring the total contents of Mg, Ca, K and Na; whereas the contents of Cu, Zn, and Fe were measured using an inductively coupled argon plasma emission spectrometer (ICP Nippon Jarrel-Ash ICAP-757V, Kyoto, Japan).
Dietary Fibres Analysis
Soluble and insoluble dietary fibres were determined according to an enzymatic-gravimetric method (Prosky et al., 1988) which has been approved as the legal or recommended procedure for food analysis. However this method was modified here by using pancreatin (Suzuki et al., 1996; Plaami et al., 1989) because almost all seaweeds contain little protein and no starch. The procedure consists of following steps: (1) Boiling 2 g of wet sample with 30 mL of water for 5 min. (2) Incubation with 20 mL of 2 % pancreatin and 30 mL of phosphate buffer at pH 6.8 in the presence of NaCl (10 mM) for 24 h at 37 oC. (3) Water insoluble dietary fibre was filtered off by a glass fibre filter (GA-100, Adventec Toyo Inc., Tokyo, Japan), washed three times with 20 mL of 78 % ethanol, twice with 20 mL of 95 % ethanol and once with 10 mL of acetone, and dried at 105 oC. Water soluble dietary fibre was precipitated from the filtrate using 4 volumes of ethanol (at 60 oC) and recovered by filtration in the same way as for insoluble fibre. (5) All samples analyzed were assayed in duplicate and one of the duplicate was used to determine protein content by Kjeldahl method, while the other was
used to determine ash content in the fibre precipitate. (6) The final corrected values or the amounts of dietary fibre were calculated by subtracting the weights of ash and protein from the dietary fibre precipitate.
Statistical Analysis
Results are expressed as mean value ± standard deviation. Comparison of means of three measurements, using a significant level of p < 0.05, was performed by analysis of variance and means separated by F-test and Student’s t- test (Steell and Torrie, 1980).
RESULTS AND DISCUSSION
The Distribution and Content of Minerals
Table 1 shows the profiles and contents of macrominerals in some Indonesian seaweed samples. The high concentration of Na was found in U. reticulata (26.40 mg/g dry weight), C. sertularoides (25.74 mg/g dry weight),
weight), and S. polycystum (17.54 mg/g dry weight). The range contents of Ca and Mg were 2.80 to 28.31 mg/g dry weight and 2.38 to 21.52 mg/g dry weight, respectively. The highest and smallest concentrations of Ca were found in P. australis and K. alvarezii, whereas U. reticulata and H. macroloba contained
the highest and smallest of Mg, respectively.
Table 1. The contents of macrominerals in seaweed samples(mg/g dry weight)
Seaweed Samples Mg Ca K Na
Green seaweeds
Caulerpa racemosa 3.840.32a 18.525.30c 3.180.22b 25.741.18d Caulerpa sertularoides 3.681.03a 11.954.43b 0.300.04a 0.660.40a Cladophoropsis
vauchaeriaeformiss 7.050.64
b
22.283.28d 9.850.37c 23.911.24d Halimeda macroloba 2.380.50a 16.860.78c 0.680.16a 4.890.80b Ulva reticulate 21.522.81c 17.945.30c 12.620.30c 26.400.84d
Bown seaweeds
Padina australis 4.041.58ab 28.314.26e 0.530.19a 0.970.85a Sargassum polycystum 5.690.66ab 18.671.44c 17.541.35d 9.651.36c Turbinaria conoides 5.740.26ab 14.792.17b 27.921.08e 11.470.45c
Red seaweed
Kappaphycus alvarezii 2.880.34a 2.800.31a 87.105.83f 11.932.47c
Values are mean ± standard deviation (n = 3)
Values within columns followed by different superscript letters are significantly different (p<0.05).
The profiles and contents of macrominerals in Indonesian seaweed samples were almost same to Japanese and Spanish seaweeds, and Na, Ca, Mg
and K also became major minerals. In raw Japanese brown alga Laminaria japonica (ma-kombu in Japanese) the contents of Na, Ca, Mg and K
were 590, 75, 120 and 42 mg/100 g edible portion (Resources Council, Science and Technology Agency, 1991). In another brown seaweeds (Fucus vesiculosus,
Laminaria digitata, and Undaria pinnatifida) and red seaweeds (Chondrus cryspus and Porphyra tennera) grown in Spain, the concentration
content of Ca in Gracillaria changii grown in Malaysia was 651 mg/100 g wet weight (Norziah and Ching, 2000).
Table 2 shows the profiles and contents of micro minerals in some Indonesian seaweed samples. The concentration of Cu was from 0.002 mg/g dry weight (both in S. polycystum and H. macroloba) to 0.251 mg/g dry weight (in C. sertularoides). In other trace elements Fe and Zn, the content range were 0.032-0.813, and 0.003-0.227 mg/g dry weight, respectively. The highest content of Fe was found in C. racemosa, whereas C. vauchaeriaeformis contained the highest concentration of Zn.
Table 2. The contents of microminerals in seaweed samples(mg/g dry weight)
Seaweed Samples Cu Zn Fe
Green seaweeds
Caulerpa racemosa 0.0080.003 0.0100.002 0.8130.237 Caulerpa sertularoides 0.2510.062 0.0030.000 0.0410.010 Cladophoropsis
vauchaeriaeformiss 0.2270.003 0.2270.003 0.1110.056 Halimeda macroloba 0.0020.002 0.0020.002 0.0320.024 Ulva reticulata 0.1790.001 0.0170.001 0.2800.060
Brown seaweeds
Padina australis 0.0050.001 0.0130.003 0.4460.016 Sargassum polycystum 0.0020.001 0.0040.001 0.2770.214 Turbinaria conoides 0.0030.001 0.0060.003 0.0620.017
Red seaweed
Kappaphycus alvarezii 0.0050.000 0.0180.004 0.0700.033
Values are mean ± standard deviation (n = 3)
The Distribution and Contents of Dietary Fibres
Compared to Japanese seaweeds Porphyra yezoensis (susabi-nori in Japanese) and Enteromorpha intestinalis (ao-nori in Japanese), the contents of Fe and Zn were little bit higher than those in Indonesian seaweed samples, with range value 9.12-54.4 mg/100 g, 0.82-5.24 mg/100 g, respectively (Yoshie et al., 1999). Furthermore, the contents of Fe and Zn in brown seaweeds (F. vesiculosus, L. digitata, and U. pinnatifida) and red seaweeds (C. cryspus and P. tennera)
mg/g dry weight, respectively (Ruperez, 2002), and in red alga G. changii contained Fe 95.6 mg/100 g wet weight (Norziah and Ching, 2000).
All these Japanese seaweeds also contained Cu in low concentration (0.46-1.82 mg/100 g edible portion = 0.006-0.023 mg/g dry weight) (Japan Society for Research of Food Composition, 1995). In Spanish brown and red seaweeds the content of Cu was also small, less than 0.005 mg/g dry weight (Ruperez, 2002).
The soluble, insoluble and total dietary fibre contents of nine Indonesian green, brown and red seaweeds are shown in Table 3. The soluble dietary fibre levels in K. alvarezii were higher than other seaweeds, and the value was 10.7 g/100 g dry weight, whereas C. vauchaeriaeformis and P. australis contained moderate amount, and the values were 4.2 and 4.9 g/100 g dry weight, respectively. C. sertularoides, S. polycystum and T. conoides were found to contain relatively small amount of soluble dietary fibre, and values were 1.8, 2.3 and 2.6 g/100 g dry weight, respectively. The lowest level of soluble dietary fibre was found in H. macroloba (0.4 g/ 100 g dry weight), followed by C. racemosa
and U. reticulata, and each value was 0.9 g/100 g dry weight. On the other hands, K. alvarezii also contained the highest amount of total dietary fibre (69.3 g/100 g
dry weight); however, the content of insoluble dietary fibre was not the highest in all of the samples. Green alga U. reticulata had the highest content of insoluble
dietary fibre (64.8 g/100 g dry weight), followed by C. racemosa, S. polycystum, T. conoides, C. sertularoides and C. vauchaeriaeformis. The smallest content of
insoluble dietary fibre was found in H. macroloba containing 14.3 g/100 g dry weight; this seaweed also had the smallest content of total dietary fibre, and the value was 14.7 g/100 g dry weight.
As for the percent soluble dietary fibre against total dietary fibre, K. alvarezii was the highest (15.4 %), followed by C. vaucheriaeformis (9.0 %)
and P. australis (8.4 %). The moderate value was found in H. macroloba, C. sertularoides, S. polycystum and T. conoides, and the values were 2.5, 2.9, 3.5
Table 3. Dietary fibre contents of seaweed samples (mean ± SD g/100 g dry weight)
Seaweed Samples Total Dietary Fibre (TDF)
Insoluble Dietary Fibre
(IDF)
Soluble Dietary Fibre (SDF)
SDF/TDF (%)
Green seaweeds
Caulerpa racemosa 64.94.9de 64.13.8e 0.90.1ab 1.40.1a Caulerpa sertularoides 61.81.1cd 60.10.7de 1.80.9ab 2.91.5a Cladophoropsis
vauchaeriaeformis 47.04.8
b
42.84.8b 4.21.1cd 9.02.4b
Halimeda macroloba 14.71.6a 14.31.8a 0.40.3a 2.52.1a Ulva reticulata 65.70.9de 64.81.8e 0.90.8ab 1.41.2a
Brown seaweeds
Padina australis 56.63.8c 51.71.6c 4.92.1d 8.42.8b Sargassum polycystum 65.70.6de 63.50.9de 2.30.3abc 3.50.6a Turbinaria conoides 63.73.6d 61.04.5de 2.61.0bc 4.21.7a
Red seaweed
Kappaphycus alvarezii 69.31.8e 58.62.7d 10.71.9e 15.42.7c
Values are mean ± standard deviation (n = 3)
Values within columns followed by different superscript letters are significantly different (p<0.05).
Compared to Japanese edible seaweeds, the soluble dietary fibre content in Japanese seaweeds was higher than that in Indonesian seaweeds, and range values were 7.2-25.6 g/100 g dry weight (Suzuki et al., 1996), 7.1-25.1 g/100 g dry
weight (Yoshie et al., 2000) for Japanese seaweeds and 0.4-10.7 g/100 g dry weight for Indonesian seaweeds. On the contrary, Indonesian seaweed had the insoluble dietary fibre content (51.7-64.8 g/100 g dry weight) higher than Japanese seaweeds (15.6-58.6 g/100 g dry weight) (Suzuki et al., 1996), ( 11.3-
71.3 g/100 g dry weight) (Yoshie et al., 2000), except H. macroloba. As a consequence, Japanese seaweeds also had higher value of soluble dietary fibre to total dietary fibre in percent than Indonesian seaweeds.
CONCLUSIONS
and Fe were low. Besides nutritional compounds (minerals), Indonesian seaweeds also contained non nutrient compounds i.e. dietary fibres.
Collecting or harvesting time may influence to the composition of nutrient and non-nutrient compounds, and in this experiment sample collection was carried out only in dry season (July); therefore the composition of nutrients and non-nutrients in Indonesian seaweeds has to be analyzed in different collecting or harvesting time (i.e. rainy season).
Since dietary fibres has positive properties for human health, therefore the research activities to prove whether its compounds from seaweeds also have same function in human, through animal or culture cells tested as a model are needed.
ACKNOWLEDGEMENTS
The authors gratefully acknowledge the efforts of Mr. Satir for collecting seaweed samples, Dr. H. Oba from Laboratory of Aquaculture, Department of Aquatic Biosciences, Tokyo University of Marine Science and Technology for his help to identify seaweed samples.
REFERENCES
Dreher ML. 1997. Handbook of Dietary Fibre. Marcel Dekker Inc., New York. Eastwood M. 1989. Dietary fibres in human nutrition. J. Soc. Dairy Technol.
42: 33-34.
Ensminger AH, Ensminger ME, Konlande JE, Robson JRK. 1995. The Concise Encyclopedia of Foods and Nutrition. CRC Press, Boca Raton Florida.
Harel Z, Riggs S, Vaz R, White L, Menzeis G. 1998. Adolescents and calcium:
what they do and do not know and how much they consume. J. Adolescents Health. 22: 225-228.
Japan Society for Research of Food Composition. 1985. Standard Tables of Dietary Fibres, Minerals, Cholesterols, and Fatty Acids in Japan. Ishiyaku Shuppan, Tokyo. Japan.
Leontowicz M, Gorinstein S, Bartnikowska E, Leontowicz H, Kulasek G, Trakhtenberg S. 2001. Sugar beet pulp and apple pomace dietary fibres improve lipid metabolism in rats fed cholesterol. Food Chem. 72: 73-78. Martinez-Navarrete N, Camacho MM, Martinez-Lahuerta J, Mertinez-Monzo J,
Fito P. 2002. Iron deficiency and iron fortified foods a review. Food Res. Intern. 35: 225-231.
Plaami S, Saastamoinen M, Kumpulainen J. 1989. Effect of variety of environment on dietary fibre content of winter rye in Finland. J. Cereal Sci. 10: 209-215.
Prosky L, Asp NG, Schweizer TF, DeVries JW, Furda I. 1988. Determination of insoluble and total dietary fibre in foods and food product: Intercollaborative study. J. Assoc. Off. Anal. Chem. 71: 1017-1023. Reinhold JG. 1988. Problems in mineral nutrition: A global perspective. In:
Smith KT (ed). Trace minerals in foods. Marcel Dekker Inc., New York. pp: 1-55.
Resources Council, Science and Technology Agency. 1991. Standard Tables of Food Composition in Japan, Minerals (Magnesium, Zinc and Copper). Resources Council, Science and Technology Agency. Japan.
Rimm EB, Ascherio A, Giovannucci E, Spiegalman D. Stampfer M, Willet W. 1996. Vegetables, fruits, and cereal fibre intake and risk of coronary heart disease among men. J. Am. Med. Assoc. 275: 447-451.
Ruperez P. 2000. Mineral content of edible marine seaweeds. Food Chem. 79: 23-26.
Schneeman, BO. 1987. Soluble vs insoluble fibre different physiological responses. Food Technol. 41: 81-82.
Steell RGD, Torrie JH. 1980. Principles and Procedure of Statistic. A Biometrical Approach. McGraw-Hill Company, Inc. New York.
Suzuki T, Nakai K, Yoshie T, Shirai T, Hirano T. 1993. Digestability of dietary fibre in brown algae, kombu by rats. Nippon Suisan Gakkaishi. 59: 879-884.
Suzuki T, Ohsugi Y, Yoshie T, Shirai T, Hirano T. 1996. Dietary fibre content, water-holding capacity and binding capacity of seaweeds. Fish. Sci. 62: 454-461.
Wang W, Onnagawa M, Yoshie Y, Suzuki T. 2001. Binding of bile salts to soluble and insoluble dietary fibres of seaweeds. Fish. Sci. 67: 1169-1173.
Wang W, Yoshie Y, Suzuki T. 2002. Effect of small particle size on digestibility and lipid in rats. Nippon Suisan Gakkaishi. 68: 172-179.
Wong KH, Cheung CK. 2000. Nutritional evaluation of some subtropical red and green seaweeds. Part I – proximate composition, amino acid profiles and some physico-chemical properties. Food Chem. 71: 475-482.
Yoshie Y, Suzuki T, Shirai T, Hirano T. 1994. Changes in the contents of dietary fibres, minerals, free amino acids and fatty acids during processing of dried nori. Nippon Suisan Gakkaishi. 60: 117-123.