IN VITRO
INHIBITION OF CELERY (
Apium graveolens
L.) EXTRACT ON THE ACTIVITY OF
XANTHINE OXIDASE AND DETERMINATION OF ITS ACTIVE COMPOUND
Dyah Iswantini
1,2,*, Tuti Hayati Ramdhani
1, and Latifah K. Darusman
1,2 1Department of Chemistry, Faculty of Mathematics and Natural Sciences, Bogor Agricultural University, Bogor, 16680, Indonesia
2
Biopharmaca Research Center, Bogor Agricultural University, Bogor, 16151, Indonesia
Received February 3, 2012; Accepted October 22, 2012
ABSTRACT
The objective of this study was to determine the inhibition effect of celery extracts toward xanthine oxidase by in vitro method, and its active compounds. Roots and herb of celery were extracted using water and ethanol solvents. Results indicated that the herbal ethanol extract had the highest inhibition effect (91.40%) at 1400 ppm. The components contained in the herbal ethanol extract were then separated by column chromatography using the best eluent (chloroform : ethyl acetate at 7:3). All of the fractions had inhibition effect greater than 50%. The fraction number 4 was the one with the highest inhibition effect followed by fraction 5 with inhibition percentage of both fractions at 200 ppm were 88.62 and 85.44%, respectively. The analysis of the ultraviolet spectrum of fraction 4
showed the presence of π-π*
transition which was resulted by the aromatic C=C, -OH, and C-O chromophores, and
also showing the n-σ*
transition which was given by –C=O chromophore. The infrared spectrum analysis indicated the presence of aromatic –C=C, -OH, and C=O functional groups. Based on the phytochemical assay and both instrumental spectrums, it was thought that the active compounds of fraction 4 and 5 were in the flavonoid group.
Keywords:Celery (Apium graveolens L.); xanthine oxidase; inhibition; in vitro; active compound
ABSTRAK
Tujuan penelitian ini adalah penentuan efek inhibisi ekstrak seledri terhadap aktivitas xantin oksidase dan penentuan senyawa aktifnya. Akar dan herba seledri diekstraksi menggunakan pelarut air dan etanol. Hasil menunjukkan bahwa ekstrak etanol herba seledri pada konsentrasi 1400 ppm mempunyai kemampuan menghambat aktivitas xantin oksidase tertinggi yaitu sebesar 91,40%. Senyawa kimia dalam ekstrak tersebut dipisahkan menggunakan pelarut kloroform : etil asetat dengan perbandingan 7:3 sebagai pelarut terbaik. Seluruh fraksi yang diperoleh mampu menghambat aktivitas xantin oksidase lebih dari 50%. Fraksi 4 adalah fraksi yang mempunyai daya inhibisi tertinggi pada konsentrasi 200 ppm (88,62%) diikuti oleh fraksi 5 (85,44%). Analisis
spektrum ultraviolet fraksi 4 menunjukkan adanya transisi dari π-π*
yang dihasilkan oleh kromofor C=C aromatik,
-OH, dan C-O, dan transisi n-σ*
yang dihasilkan oleh kromofor -C=O. Analisis spektrum inframerah menunjukkan adanya gugus -C=C aromatik, -OH, dan C-O. Berdasarkan hasil penapisan fitokimia dan data spektrum, diduga senyawa aktif pada fraksi 4 dan 5 merupakan gologan flavonoid.
Kata Kunci:Seledri (Apium graveolens L.); xantin oksidase; inhibisi; in vitro; senyawa aktif
INTRODUCTION
Gout is a disorder caused by deposition of monosodium urate crystals in joints and other tissues as a result of extracellular urate supersaturation. Hyperuricemia, a concentration of urate in serum above the limit of solubility of this substance (V 7.0 mg/dL), is the most important risk factor for the development of gout and occurs as a result of increased uric acid production, impaired renal uric acid excretion, or a combination of these mechanisms. Control of hyperuricemia is most often achieved by reducing uric
correlation between XO inhibitory activity and phenolic content of plant extracts. In studying the XO inhibitory activity of flavonoids, Lio et al. [7] determined that kaempferol and quercetin had 85 and 90% XO inhibitory activity at 50 mg:mL, respectively. These compounds are effective inhibitors of xanthine oxidase due to the high number of phenolic groups, which render them hydrophilic. Moreover, tannins, because of their protein-binding properties, may have interfered with our in vitro assays, and so a quantitative analysis of the test plants was performed to distinguish the contribution of non-tannin phenolics to XO inhibition from that attributable to tannins.
Medicinal plants are of great importance to the health of individuals and communities. The medicinal value of these plants lies in some chemical substances that produce a definite physiological action on the human body. XO inhibitors have been found in a wide variety of plants from Iran [8], and Vietnam [9]. Celery root and leave juices applied alone or with doxorubicin, increased XO activity [10]. Ethnobotanic data showed the use of all parts of celery plant. The seed can be used as antipasmodic, antirheumatic, antibhronchitis, and antiasthma. The root can be used to treat kidney stone, and the herbal can used to treat diseases associated to uric acid, irregular menstruation, high blood pressure, as a tonic, stomatic, and diuretic [11]. Patent Search on Celery as antigout at website of American Patent Office www.uspto.gov showed that there is no patent on the use of celery as antigout. Moreover, there is no patent on chemical compounds function as antigout agent, although there is a possibility of the patent on this theme has been expired.
The present study therefore was aimed at screening and searching empirical profile of bioactive compound family of celery with activity to reduce xanthine oxidase activity in the formation of uric acid as a triggering factor for gout. The hypothesis was that celery extract can used to prevent and treat gout through inhibition of xanthine oxidase activity.
EXPERIMENTAL SECTION
Materials
In this research, the celery as the object of the study was obtained from Semarang.
Instrumentation
The UV spectra were recorded in the UV region and were measured using UV-Visible Beckman DU 570 spectrophotometer. Infrared spectra were recorded on Shimadzu-470.
Procedure
Extraction using water and ethanol as solvent Dried celery was extracted by macerating it in water which then underwent filtration, and the resulting filtrate was dried using rotavapor until dried residue was obtained (water extract).
Dried celery also extracted using ethanol until the last filtrate was negative toward alkaloid and flavonoid tests. The filtrate was dried using rotavapor.
Extraction of flavonoid
Powder of dried plants was soaked in methanol and water, with the ratio of the solvents at 9:1 and 1:1. Each extract was combined which then underwent filtration, and the filtrate was evaporated using rotavapor until 1/3 of original volume left. The extract was separated with hexane and then with chloroform. The water layer which had been extracted underwent solvent evaporation using rotavapor.
Extraction of Alkaloid
Sample was extracted with methanol solvent using soxhlet extractor. The solvent then removed from the acquired extracts, by means of rotary evaporator, yielded a highly concentrate of methanol extracts. The concentrated extract was diluted in 10% of acetic acid in ethanol with the addition of concentrated NH4OH,
and then centrifuged to obtain the precipitate form of the extract. The precipitate was washed with 10% and 1% of NH4OH, and then centrifuged. The precipitate
was then diluted in chloroform and was vacuumed.
Phytochemical analysis
Tests for alkaloid, triterpenoid, steroid, saponin, flavonoid, quinone and tannin was done using the Harborne method [12].
Toxicity test of the extracts toward A. salina Leach.
Determination of the LC50value of all obtained extracts
was done using the Finey method [13].
The inhibitory assay to Xanthine Oxidase (XO).The
Table 1.Yields of extract of celery root and herbal
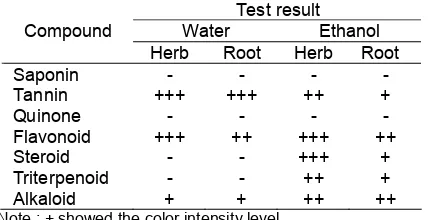
Table 2.Phytochemical assay of celery dried powder
Test result
Note : + showed the color intensity level
Table 3. Phytochemical assay of water and ethanol
extracts
Note : + showed the color intensity level
Table 4. Phytochemical assay of alkaloids and
flavonoids extracts
Note : + showed the color intensity level Fractionation of ethanol extract and compound
identification of active fraction
Fractionations were performed using silica gel column G-60 with the best eluent (CHCl3:Et.Ac), in a
gradient of polarity level. Ethanol extracts were fractionated twice, consisted of 1.000 g on 2.4 33 cm column (first column) and 3.608 g on 3.0 76.5 cm (second column) with a constant flow rate of 1-1.54 mL/min. Eluates from fractionations were collected for every 5 mL, and those eluates with similar Rf and chromatogram pattern were combined and analyzed using analytical TLC (Thin Layer Chromatography). The fractions were freeze-dried, the yields were measured, and the cytotoxicity was tested on Artemia salina. The cytotoxicity values were subsequently used to determine the maximum concentration limit tolerance in the inhibitory effect assay of XO.
Identification was performed on the fraction showing the highest inhibition power. All fractions were identified using a Fourier transformed infrared (FTIR) spectrometer instrument and spectrophotometer UV-Vis.
RESULT AND DISCUSSION
Determination of Water Content
The water content determination was done on the celery herbal and roots to gain information on the water content of the dried herbal and roots of the plant. By knowing the water content of one sample, the best
storing technique can be selected to avoid the negative impact of microbes (fungus) activity. The acquired water content of dried celery roots powder was at 8.99% and for the herbal was at 9.13% (Table 1). A sample is relatively stable against spoilage caused by the activity of microbes when the water content of that sample is less than 10%.
Extraction
Extraction was carried out using various solvents, namely water and ethanol, and also methanol in the extraction of alkaloids and flavonoids compounds. The use of water was intended to elucidate the toxicity and the inhibition activity on xanthine oxidase of the acquired extract, as water is usually used by the society as solvent and boil their medicine. The extraction with water was also compared to that of the alcohol solvent, in this case is ethanol. Comparison with the ethanol extraction is due to the fact that ethanol is the best multipurpose solvent in the preliminary extraction. The use of ethanol in the preliminary extraction is focused on the reason that ethanol has two functional groups with different polarity; the hydroxyl group is polar while the alkyl group is non-polar. Compounds with various polarity levels are expected to be extracted in ethanol solvent owing to the presence of these two functional groups in ethanol.
Fig 1. Inhibition percentage of xanthine oxidase activity of water extract
Fig 2.Inhibition percentage on the activity of xanthine oxidase of flavonoids extract
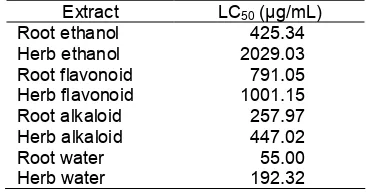
Table 5. LC50 value of celery root and herbal extracts
againstA. Salina
Extract LC50(µg/mL)
Root ethanol 425.34
Herb ethanol 2029.03
Root flavonoid 791.05
Herb flavonoid 1001.15
Root alkaloid 257.97
Herb alkaloid 447.02
Root water 55.00
Herb water 192.32
research by other group who reported that alkaloids group is believed to inhibit the production of xanthine oxidase, other chemical groups to show similar activity are polyphenolic and flavonoids. Several flavonoid especially luteolin and apigenin work as inhibitor against xanthine oxidase with effect similar to that of allopurinol [15].
The yield obtained from the extraction of dried powder of celery roots and herb is shown on Table 1. The highest yield was obtained on the extraction where water was used as solvent.
Phytochemical Assay
Phytochemical Assay toward dried powder of celery herb and roots, and also its crude extract, was used to determine the type of compound of secondary metabolite contained in each samples. The results of Phytochemical Assay of herb and roots of celery (Table 2) showed that the secondary metabolite was deposited more on the herbal part of the celery compared to that of the root. On Table 2, the results of phytochemical assay showed that all of compounds were detected on the herbal part of celery except for quinone group. Meanwhile, quinone was also undetected in the root part along with saponin group. Both herb and root part of celery contained tannin and flavonoid groups, however
the color intensity on the herb extract was higher than that on the root. There is a possibility that flavonoid and tannin are deposited more on the stem and leaves of celery than on the root.
Table 3 and 4 showed the groups of compounds presence in each extract based on their phytochemical assay. The ethanol extract, though having less yield compared to that of water extract, had almost all the secondary metabolites with various polarity levels. It was thought that this result was due to the fact that ethanol has both polar and non-polar functional groups. Meanwhile, in the extraction of flavonoid and alkaloids, there were several groups extracted along. This showed that there is no specific solvent that can be used for the extraction of a certain group of compounds.
Determination of Cytotoxicity Value of All Extracts
The results of the toxicity test on all extracts are presented on Table 5. Water extract of root and herb, alkaloids extract of root, ethanol extract of root, alkaloid extract of herb, and flavonoid extract of root are all having bioactive potent as shown by the LC50value of
lower than 1000 ppm [16]. Meanwhile, the ethanol extract and the flavonoid extract of herbal were less toxic with LC50 value of 2029.03 and 1001.15 ppm,
respectively. The LC50 value of each extract became
the limit of concentration variant on the enzymatic activity test of xanthine oxidase, as highly noted that the formulated medicine is categorized as safe when the concentration of each extract is lower than their LC50value.
The Inhibitory Assay of XO
Fig 3. Inhibition percentage on the activity of xanthine oxidase of alkaloids extract
Fig 4.Inhibition percentage on the activity of xanthine oxidase of ethanol extract of celery root
Fig 5. Inhibition percentage on the activity of xanthine oxidase of ethanol extract of celery
concentration of 50 ppm to the concentration closed to their LC50 value. Moreover, the observation on the
activity of the enzyme without the addition of extract was completed to see the inhibition effect of the extract against the activity of the enzyme.
The measured UV absorption was corresponding to the leftover xanthine which was un-converted to uric acid. This absorption value was changed to the concentration unit using the standard curve linier at y = 0.1094 + 3.3729x. By obtaining the concentration of reacted xanthine, the activity of the xanthine oxidase to change xanthine to uric acid can also be known, as well as the inhibition percentage of tested extract on the activity of xanthine oxidase. The inhibition effects of crude extracts are illustrated on Fig. 1 through 5.
The results of inhibitory assay showed that all extract tested had lower activity than that of control. This lower activity indicated that all celery extracts are potentially inhibit the activity of xanthine oxidase or acting as inhibitor. Overall, the inhibition power of the enzyme activity increased with the increasing of the extract concentration.
Fig. 1 through 3 shows the inhibition effect of water, flavonoids and alkaloids extracts. All results showed that extract from root had the inhibition effect more than that of extract from herb. It was thought that compounds responsible for the inhibition effect are deposited more on the root than on the stem and leaves parts (herb), eventhough the phytochemical assay showed that the herb part contains more secondary metabolite compounds.
On the contrary to the water, alkaloid and flavonoid extracts, the ethanol extract of herb (Fig. 5) had a greater inhibition effect compare to that of ethanol extract from root (Fig. 4) for all applied concentration.
On the average the inhibition effects of the ethanol extract of herb were high, with the highest percentage of inhibition of 91.64% obtained from the applied concentration of 1400 ppm (Fig. 5). The high inhibition effect was comparable with other research related to Iranian medicinal plants [8], Vietnamese traditional medicines [9] and selected Philippine medicinal plants [17]. Therefore, the ethanol extract of herb was obtained to be separated using column chromatography and tested further on their toxicity toward shrimp larvae as well as on their enzymatic activity.
Fractionation of Ethanol Extract and Identification of Active Fraction
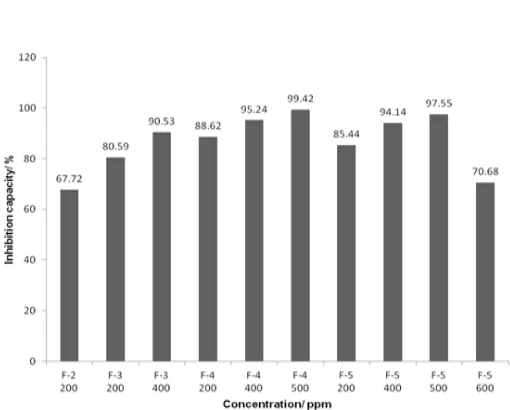
Fig 6. Inhibition percentage on the activity of xanthine oxidase of fraction 2 through fraction 5
are used as initial eluents; from non-polar to polar eluents (hexane, chloroform, ethyl acetate, acetone, ethanol, methanol, and water). Single eluent of all solvents which gave the best separation results are combined to give a variety of mixture of two solvents with various ratios.
The movement of compounds of the extract depends on the similarity of their solvent polarity with the polarity of eluent used. The movement of the non-polar compound will eventually stopped when solvent used has high polarity, and vice versa. The formed-spot was detected using UV light at wavelength of 254 and 366 nm. On the separation of the ethanol extract of herb, two spots were formed when single eluent of chloroform, acetone, or ethanol was applied. This separation results are better than the one where ethyl acetate or methanol was used as eluent, which only resulted a single spot, while eluent of hexane did not give any spot at all. The spot of methanol eluent still show a tailing, therefore, methanol and hexane were not used in the combined solvents.
As the result, a combination solvent consist of chloroform and ethyl acetate was the best combination of two eluents which resulting clear separation pattern, more spots, and less tailing. The best separation result with more spots (4 spots) was obtained from the combination of chloroform and ethyl acetate solvents with ratio of 7:3.
Each fraction was dried, weighted, and the yield was calculated. Fraction number 5 had the highest yield of 26.50%, while fraction 1 was the fraction with the smallest yield at 3.76%. Each fraction was tested again using BSLT to find the limit concentration of the extract (LC50) for the enzymatic test. The result showed that
fraction 2 was the fraction with bioactive potent as shown by its low LC50value at 287.49 ppm, followed by
fraction 3, 4, and 5. Meanwhile, fraction 1 was the only fraction to show the LC50 value over 1000 ppm.
Therefore, fraction 1 was not used for further study on the enzymatic test as it had a relatively high LC50value
of 6695.93 ppm.
The results of the inhibition test of each fraction against the xanthine oxidase can be seen on Fig. 6. It can be seen that the inhibition power on the xanthine oxidase activity of all fractions are greater than 50%. According to Noro et al. [18] and Schemeda-Hirsmann et al. [19], an extract is called to be a potential inhibitor when it has the percent inhibition value greater than 50%. Concentration at 200 ppm was the tested concentration for all fractions, therefore this concentration was used as the comparative concentration for all fraction tested. At 200 ppm, the fraction with the highest percent inhibition was shown by fraction 4 with value of 88.62%, followed by fraction 5 at 85.44%, fraction 3 at 80.59%, and fraction 2 at 67.72%.
Fraction 4 and 5 are the fractions with higher inhibition effect among all the fractions, therefore, these fractions were used in further study to identify the group of the compounds using UV and IR spectrophotometer technique. The UV spectrum of fraction 4 showed a maximum absorption peak at wavelength 219 nm, and additional absorption peaks at 258, 323, 403, and 663 ppm. The maximum absorption at 219 nm could be generated by the π-π*
or n-σ*
transition. This electron transition could be caused by – OH, C=O, C=C, C-O, NH, NH2, and –SH
chromophores. Additional absorption which is complicated and the appearance of bandwidth at visible region indicated the presence of long conjugated or aromatic polycyclic chromophores.
The UV spectrum of fraction 5 had the maximum absorption at λ = 216 nm and additional absorption at λ = 266, 320, 397, and 663 nm. The absorption at λ = 216 nm could also indicated the presence of π-π*
or n-σ*
transition. This electron transition could be caused by –OH, C=O, C=C, C-O, NH, NH2, and –SH
chromophores. Similar to fraction 4, fraction 5 also showed many bands at visible region. This indicated that fraction 5 also has long conjugated or aromatic polycyclic chromophores.
Table 6. The wavenumber of infrared absorption and suspected functional groups of fraction 4
Absorbance peak
wavenumber (cm-1) Functional group suggested
3422 Stretching-OH phenol
2926 Stretching C-H aromatic
1630 Stretching C=C aromatic
1385 Stretching C-O phenol
1074 Stretching C-O ether cyclic
630 Fold C-H aromatic
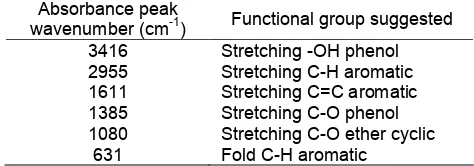
Table 7. The wavenumber of infrared absorption and
suspected functional groups of fraction 5
Absorbance peak
wavenumber (cm-1) Functional group suggested
3416 Stretching -OH phenol
2955 Stretching C-H aromatic
1611 Stretching C=C aromatic
1385 Stretching C-O phenol
1080 Stretching C-O ether cyclic
631 Fold C-H aromatic
absorption for C-O stretching of cyclic ether was detected at 1074 cm-1, and the C-H bending of aromatic group showed up at 630 cm-1. The wavenumber data and suspected functional group of fraction 4 is presented on Table 6.
The infrared spectrum of fraction 5 was quite similar to the absorption pattern of fraction 4. The absorption peaks were observed at several wavenumbers; 3416, 2955, 1611, 1385, 1080, and 631 cm-1. Broad absorption peak at 3416 cm-1could be used as an indication that OH stretching of phenol was presence. Absorption peak at 2955 cm-1 indicated the presence of aromatic C-H stretching, while aromatic C-H bending appeared at 631 cm-1. The absorption peak of aromatic C=C stretching appeared at 1611 cm-1. Meanwhile, the phenol C-O stretching was detected at 1385 cm-1. The cyclic ether C-O stretching was also detected with the absorption peak of 1080 cm-1. The wavenumber data and suspected functional group of fraction 5 is given on Table 7.
Based on the analysis of UV and IR spectrum, it was thought that fraction 4 and 5 contained flavonoid compound. This result is supported by previous works reported that several flavonoids such as apigenin and isovitexin, quercetin, myricetin, and genistein can inhibit XO and exhibit competitive inhibition [20]. The flavones and flavonols with a 7-hydroxyl group such as apigenin, luteolin, kaempferol, quercetin, and myricetin inhibited XO-inhibitory activity at low concentrations [21]. The higher flavonoid content of extracts contributed to their higher XO inhibitory activity [22]. Other research also reported that the size and geometry of the flavonoids are important factors in the positioning of the molecule in order to block the access of the physiologic substrate (hypoxanthine) to the catalytic center of XO. Flavonoids will be good as XO inhibitor when the size is small and the hydrophobic character is high [23].
CONCLUSION
All celery extracts are inhibitor against the activity of xanthine oxidase enzyme to change xanthine into uric acid. The ethanol extract of herbal at 1400 ppm had the greatest (highest) inhibition effect with percent inhibition value at 91.64%. The fractionation of the ethanol extract
of herb yielded five fractions. The enzymatic test showed that fraction 4 was the fraction with the highest inhibition effect with percent inhibition of 88.62%, followed by fraction 5 with percent inhibition at 85.44%. The UV and IR spectrum of both fraction 4 and 5 showed a very similar pattern. The analysis of UV spectrum of fraction 4 indicated the presence of π-π*
transition which was resulted by the aromatic C=C, -OH, and C-O chromophores. While the n-σ*
transition was given by -C=O chromophore. The IR spectrum analysis indicated that the functional groups of aromatic -C=C, -OH, and C-O were presence. Based on phytochemical assay and spectrum data, it was thought that fraction 4 and 5 were the flavonoid group.
REFERENCES
1. Chang, W.S., Lee, Y.J., Lu, F.J., and Chiang, H.C., 1993,Anticancer Res.,13, 6A, 2165–2170.
2. Hatano, T., Yashuhara, T., Fukuda, T., Noro, T., and Okuda, T., 1989,Chem. Pharm. Bull., 37, 11, 3005–3009.
3. Chang, W.S., and Chiang, H.C., 1995, Anticancer Res.,15, 5B, 1969–1974.
4. Sheu, S.Y., and Chiang, H.C., 1996, Anticancer Res., 16, 1, 311–316.
5. Lewis, A.S., Murphy, L., Calla, C., Fleary, M., and Purcell, S., 1984,J. Biol. Chem., 259, 1, 12–15. 6. Havsteen, B., 1983, Biochem. Pharmacol., 32, 7,
1141–1148.
7. Lio, M., Yoshioka, A., Imayoshi, Y., Koriyama, C., and Moriyama, A., 1984,Agric. Biol. Chem., 48, 6, 1559–1563.
8. Pirouzpanah, S., Rashidi, M.R., Delazar, A., Razavieh S.V., and Hamidi, A.A., 2009, Iranian J. Pharm. Sci., 5, 3, 163–170.
9. Nguyen, M.T., Awale, S., Tezuka, Y., Tran, Q.L., Watanabe, H., and Kadota, S., 2004, Biol. Pharm. Bull.,27, 9, 1414–1421.
10. Kolarovic, J., Popovic, M., Mikov, M., Mitic, R., and Gvozdenovic, L., 2009, Molecules, 14, 4, 1627– 1638.
12. Harborne, J.B., 1987, Phytochemical Methods, Chapman and Hall, London.
13. Finney D., 1971, Probit Analysis, Cambrige: Cambrige University Press.
14. Tamta, H., Kalra, S., and Mukhopadhyay, A.K., 2005,J. Enzyme Inhib. Med. Chem.,20, 317–324. 15. Cos, P., Ying, L., Calomme, M., Hu, J.P., Cimanga,
K., Poel, B.V., Pieters, L., Vlietinck, A.J., and Berghe, D.V., 1998,J. Nat. Prod.,61, 71–76.
16. Meyer, B.N., Ferigin, N.R., Putnan, J.E., Jacobsen, L.B., Nichols, D.E., and McLaughlin, J.L., 1982, Planta Med., 45, 5, 31–34.
17. Apaya, K.L., and Chichioco-Hernandez C.L., 2011, J. Med. Plant. Res., 5, 2, 289–292.
18. Noro, T., Oda, Y., Miyase, T., Ueno, A., and Fukushima, S., 1983, Chem. Pharm. Bull., 31, 3984–3987.
19. Schemeda-Hirschmannm, G., Loyola, J.I., Sierra, J., Retamal, R., and Rohdriguez, J., 1992, Phytother. Res., 6, 4, 184–188.
20. Lin, C-M., Chen, C-S., Chen, C-T., Liang, Y-C., and Lin, J-K., 2002,Biochem. Biophys. Res. Commun., 294, 1, 167–172.
21. Ozyürek, M., Bektaşoğlu, B., Güçlü, K., and Apak, R., 2009,Anal. Chim. Acta,636, 42–50.
22. Nessa, Fazilatun, Ismail, Zhari, Mohamed, Nornisah., 2010,Pharm. Biol, 48, 12, 1405–1412. 23. Silva, M.P., Mira, L., Lima, J., Manso, C.F., 1996,