The Effect of Literacy
on Immigrant Earnings
Ana Ferrer
David A. Green
W. Craig Riddell
a b s t r a c t
We examine the impact of literacy on immigrant earnings and the sources of lower returns to education and experience among immigrants. We find that the native-born literacy distribution dominates that for immigrants. However, the two groups obtain similar returns to literacy skills, contrary to discrimination-based explanations for immigrant—native-born earnings dif-ferentials. Among the university-educated, literacy differences account for about two-thirds of the earnings gap. However, low returns to foreign expe-rience have a larger impact on this differential. Among the less educated, lit-eracy differences and differences in the returns to experience have similar effects on the earnings differential.
I. Introduction
Immigrant recipient countries devote considerable research effort to understanding earnings differences between immigrant and native-born workers (see Chiswick 1978; Borjas 1985, 1995 for the United States, and Baker and Benjamin 1994; Bloom, Grenier, and Gunderson 1995 for Canada). These studies establish that, in general, immigrants earn less than native-born workers with the same amount of education and work experience. The low earnings of immigrants are often attributed to the specificity of human capital to the country where it originates. Skills generated
Ana Ferrer is an adjunct assistant professor of economics at the University of Calgary; David A. Green and W. Craig Riddell are professors of economics at the University of British Columbia. The authors wish to thank Scott Murray for providing access to the OILS data, and Statistics Canada and the SSHRC for research support. They are also grateful to the referees and to seminar participants at the University of Copenhagen, University of Western Ontario and UBC for their helpful comments. The data used in this study were provided under contract with Statistics Canada and cannot be released by the authors. Individuals wishing to request access to these data should contact Yvan Clermont at Statistics Canada yvan.clermont@statcan.ca or one of the authors.
[Submitted July 2004; accepted October 2005]
ISSN 022-166X E-ISSN 1548-8004 © 2006 by the Board of Regents of the University of Wisconsin System
through education or work experience in the source country cannot be directly trans-ferred to the host country, resulting in apparently well-qualified immigrants holding low-paying jobs. Of course, this is not the only potential explanation for lower immi-grant earnings. Another possibility is that host-country employers discriminate against immigrants, that is, pay immigrant workers less than equally productive native-born workers. Investigating these issues would be straightforward if we had access to direct measures of skill. In that case, we could compare native-born and immigrant workers with the same levels of education and experience to see whether the immigrants in fact have lower skill levels, supporting the first hypothesis. Alternatively, we could observe whether immigrants get a lower return to their observed skills, supporting the second hypothesis. In this paper, we take advantage of rich data on immigrants from Ontario (the Ontario Immigrant Literacy Survey or OILS) that includes both standard demo-graphic and labor market information and results from literacy and numeracy tests. Interpreting the literacy test scores as direct measurements of cognitive skills, we are able to provide a closer examination of explanations for low immigrant earnings than has previously been possible. In addition, the data include more precise information on where education was obtained and age of migration than is available in most previous studies, further refining our ability to scrutinize immigrant—native-born earnings dif-ferentials.
The primary goal of the paper is to provide answers to three questions related to immigrants’ skills. First, are immigrant literacy skills different from those of the native-born and, if so, in what way? Second, do immigrants receive different returns to these skills than observationally similar native-born workers? Third, can differ-ences in levels and returns to these skills explain differdiffer-ences in earnings between immigrant and native-born workers?
Our approach builds on recent contributions that stress the need to account care-fully for where education and experience was acquired in examining immigrant earn-ings. Using Israeli data, Friedberg (2000) finds that lower immigrant earnings compared to native-born workers with similar education and experience can be explained almost entirely by lower returns to experience acquired outside of Israel. This is true in particular for non-European immigrants. Similarly, Green and Worswick (2002) find zero returns to foreign experience for recent immigrant cohorts but show that, in Canada’s case, this is a change from the early 1980s when immi-grants earned returns to foreign experience that were similar to what the native-born received for domestically acquired experience. Much of this change over time is related to changes in the source country composition of the inflow. Schaafsma and Sweetman (2001) and Ferrer and Riddell (2003) examine the issue of lower returns to foreign-acquired education in a somewhat indirect way by using age at immigration.1
Both papers find that returns to foreign education, while lower than those to Canadian education, are still substantial. As we stated earlier, the OILS has ad-vantages over the data used in these studies because it includes direct measures of foreign-acquired education and age of arrival information that enables measurement of foreign experience. Part of the contribution of this paper is to reexamine, using
1. The Canadian Census—the data used in most immigration studies—has no information about the origin of human capital. In addition, the age of arrival variable is coded in intervals, which complicates the impu-tation of measures of pre and postmigration experience.
better data, issues raised in earlier studies about returns to foreign experience and education.
This paper also builds on Green and Riddell (2003) who use the International Adult Literacy Survey (IALS) to examine the role of cognitive skills in Canadian earnings patterns. Like the OILS, the IALS contains both standard survey questions and liter-acy tests. Green and Riddell (2003) argue that the IALS literliter-acy questions are partic-ularly conducive to using the literacy scores as measures of cognitive skills possessed by the respondent at the time of the survey. Based on this assumption, they argue that much can be learned about how skills influence earnings from an analysis of interac-tions of the literacy measures and standard human capital variables. They use an hedo-nic model in which earnings are determined by the basic skills an individual possesses and the implicit prices of those skills. We adopt a similar interpretative framework here and, in fact, use a sample of native-born workers from the IALS data to provide a comparison group for the immigrants observed in OILS.
While the OILS data has several substantial advantages over earlier data sets, it also has two deficiencies. First, it is a single cross-section, making it impossible to use standard panel data techniques for separating time-in-the-host-country effects from cohort effects. Thus, our time-since-arrival estimates potentially represent a combi-nation of these two effects. Since, as we will see, introducing literacy variables has very little impact on the coefficients relating to experience and time-since-arrival vari-ables, we do not believe this raises substantial issues for our analysis. Nonetheless, it does mean our results are weaker in one dimension than other papers. Second, OILS does not contain variables that can reasonably be used as instruments for either the education or literacy variables. This means that any behavioral interpretations from our estimates require assumptions about the error term that imply that the education and literacy variables can be treated as exogenous. We argue below that the required assumptions are somewhat weaker than what is required to be able to treat education alone as exogenous in an earnings regression context. These assumptions are also consistent with the standard approach to immigrant earnings determination where education is almost universally treated as exogenous.
One other Canadian data set with a direct measure of prearrival education is the 1989 Literacy Skills Used in Daily Activities (LSUDA) survey used by Alboim, Finnie and Meng (2003). Our paper differs from theirs in several respects. First, while Alboim, Finnie, and Meng (2003) focus on returns to foreign education and experi-ence using literacy as essentially an extra control, we focus mainly on the impact of literacy on earnings. Thus, our analysis complements rather than substitutes for theirs. Second, LSUDA is a nationwide survey that does not over-sample immigrants, which results in a sample of only 251 immigrants. This precludes detailed examinations of the more complex impacts of foreign experience and education on Canadian earn-ings.2In contrast, the OILS surveyed only immigrants, providing us with a sample of
about 1350 immigrants. Third, LSUDA contains information on total annual income rather than earnings. OILS and IALS contain information on earnings, which is more closely related to the human capital explanations we seek to investigate.
Our results imply that the answer to our first main question—Do immigrant liter-acy skills differ from those of the native-born?—is Yes. The native-born test score
dis-2. The same small sample problem arises with the IALS data set, which has around 200 immigrants.
tributions dominate those for immigrants and immigrants have lower average test scores than observationally equivalent native-born workers. However, much of the gap stems from a set of immigrants with test scores so low that they suggest language difficulties. Further, while cognitive skill levels and experience are not significantly correlated for the native-born, immigrant test scores rise with Canadian experience. This is consistent with literacy tests capturing “usable” cognitive skills that incorpo-rate the ability to communicate in English or French. Regardless of these differences in cognitive skill levels and acquisition, however, we easily reject the hypothesis that immigrants and the native-born receive different returns to these literacy skills. This evidence appears to contradict a discrimination explanation for differences in earnings between immigrant and native-born workers, at least in the dimension related to cog-nitive skills.
Our earnings results support earlier findings that returns to foreign-acquired educa-tion and experience for immigrants are lower than returns to educaeduca-tion and experience obtained in Canada by either immigrants or the native-born. Indeed, low returns to for-eign experience appear to play a major role in explaining immigrant earnings defi-ciencies relative to native-born workers. This pattern in returns to experience does not change once we control for literacy, indicating that the root of the problem does not lie in foreign experience generating lower cognitive skills. Literacy itself affects earnings significantly with a 100 point increase in the literacy score (equivalent to about 1.5 standard deviations in the literacy score distribution) generating an earnings increase equivalent to moving from being a high school dropout to being a university graduate. Differences in literacy between immigrants and the native-born explain part of the immigrant earnings differential. Among the less educated, literacy differences account for as much of the earnings gap as the lower returns to foreign experience received by immigrants. For university graduates we estimate that raising immigrant literacy skills to the native-born level would reduce the immigrant earnings gap by about two-thirds. However, increasing immigrant returns to foreign experience to equal the returns to experience among the native-born would have a much larger effect, turn-ing the immigrant disadvantage into an advantage. Thus, among the most educated, literacy differences between immigrants and the native-born have important im-pacts on earnings differentials but they are not as important as differences in returns to foreign experience. Interestingly, though, our results indicate that differences in returns to foreign versus Canadian-acquired university education are entirely explained by foreign universities generating lower levels of (Canadian-usable) literacy.
The paper is organized as follows. The next section presents a framework for considering what we might learn from introducing literacy skills measures into a standard earnings equation. In the third section, we discuss our data and present basic data patterns. The fourth section contains the analysis of immigrant earnings. The final section concludes.
II. A Framework for Discussing Earnings Generation
The earnings generation framework borrows from Green and Riddell (2003). They distinguish among attributes/skills—personal characteristics that can be acquired by the worker and enhance individual earnings—and abilities—innate,productive characteristics. In that framework, we can represent the earnings of an individual by:
(1) Ei= f(G1i, . . . , GKi)+ei
where Eiare earnings for individual i, Gkiis the amount of skill kthat person isells in the market, and eiis a disturbance term that is independent of the skills. The skills could include cognitive skills of the type measured in literacy tests, other (perhaps manual) attributes that are not captured in such tests, and noncognitive characteristics such as persistence.
Characterizing the earnings function would be relatively straightforward if we observed the skills, Gki. Typically, of course, we do not observe them. What we do observe are some of the inputs used in generating the skills, which are related to those skills through production functions:
(2) Gki= hk(edni, expi, θki)
where ednis a set of dummy variables representing levels of formal schooling, exp is years of work experience and θkis an ability specific to the production of the kth attribute. We then obtain an estimating equation by substituting Equation 2 into Equation 1. This yields a reduced form specification for earnings as a function of schooling and experience. The ability variables are unobserved and thus end up in the error term. Assuming that we have a measure for the cognitive skills through the literacy variable and characterizing fand husing first or second order polynomials in observable variables, we arrive at an earnings regression:
(3) Ei= β0+ β1edni+ β2expi+ β3expi2+ β4edni∗expi+ β5G1i+ β6G12i + β7G1i∗edni+ β8G1i∗expi+ui
where G1icorresponds to our measure of literacy, the βs are either scalars or vectors of parameters as appropriate and uis an error. Notice that the βs reflect the combina-tion of how a covariate contributes to produccombina-tion of each of the skills and how the skills contribute to earnings generation.
The framework set out to this point could be considered the relevant earnings gen-eration model for a native-born individual. We assume that immigrants use the same sets of attributes to generate earnings in the Canadian labor market. However, immi-grants could differ from the native-born in the returns they obtain from a given set of attributes (different f(.) functions) and in the production functions for creating indi-vidual attributes (different h(.) functions). Differences in the f(.) function between immigrants and the native-born correspond to discrimination in this model since they represent differences in earnings among workers who are in fact equally productive.3
A standard claim in the immigrant earnings literature is that credentials problems and mismatches in technological requirements imply that education and experience obtained in most other countries will not be as productive in Canada as Canadian
edu-3. It is tempting to think that differences between immigrants and the native-born in the coefficients on the noninteracted G1iterms (that is, β5and β6) provide direct evidence of discrimination. However, this inter-pretation need not hold if interactions of G1iwith expand ednare significant. Thus, one could observe differ-ent coefficidiffer-ents related to G1i between immigrants and the native-born because exp is differentially productive in creating other attributes for the two groups.
cation and experience. This raises the possibility that we should consider both sepa-rate measures of education and experience obtained abroad and sepasepa-rate h(.) functions for immigrants. When we do so, our specification becomes:
(4) Ei= βI
0+ β1Iedni+ βI2expi+ βI3exp2i+ βI4edni∗expi+ β5IG1i+ β6IG1i2 + βI
7G1i∗edni+ β8IG1i∗expi+ β9Ifedni+ β10I fexpi+ β11I G1i∗fedni + βI
12G1i∗fexpi+ β13I fexpi∗fexpi+ β14I expi∗fexpi+ui
where, fedn and fexp correspond to education and experience obtained outside Canada. This specification allows for complex interactions among foreign obtained attribute inputs in the production of attributes. For example, the interaction of fexpand exprepresents that possibility that immigrants are better able to translate their source country experience into earnings after they have more experience in Canada.
A key conclusion of the previous literature on immigrant earnings in both Canada and the United States is that more recent cohorts of immigrants have poorer earnings when compared with both earlier immigrants and native-born workers with the same measured levels of education and experience. With a single cross-section, we cannot separate effects of changes across immigrant cohorts from the effects of gradual adap-tation to the Canadian labor market by new immigrants. The Canadian experience coefficients we estimate for immigrants will effectively combine true assimilation effects and the impact on earnings of differences across cohorts. Although this means we cannot decompose this feature of immigrant adaptation, we are still able to learn much about the immigrant experience and how it relates to measured literacy.
To this point we have not mentioned a key component of the immigrant assimila-tion experience: language skills. Using a variety of approaches to address potential endogeneity and measurement error issues, papers by Chiswick (1991), Chiswick and Miller (1995), Dustmann and Fabbri (2003), Berman, Lang, and Siniver (2003), Bleakley and Chin (2004) and Gonzalez (2005) find substantial effects of host-country language acquisition on immigrant earnings. In our framework, fluency in the host-country language can enter either as an attribute in its own right and/or as an input to the generation of other attributes. In the latter case, employers care only about the usable amounts of each attribute a worker possesses. Thus, an engineer who is well trained but cannot communicate with his or her employer or fellow employees would be counted as having zero usable engineering skills. Language proficiency then enters as an input into the production of usable attributes, with greater language abil-ity leading to higher usable attributes for any given level of other inputs.
One possible approach with our data would be to treat the literacy variables as measures of reading fluency in English or French. However, the fact that the tests are mainly focussed on eliciting cognitive skill levels means that this simple interpreta-tion of the literacy measures will not work. On the other hand, inability to answer the test would indicate a lack of reading fluency. In general, the literacy test scores for immigrants will reflect a combination of cognitive skill levels and language (reading) skills. We see no way to untangle these two factors. In what follows, we interpret lit-eracy test scores for immigrants as capturing “usable” (in the Canadian labor market) cognitive skills.
Finally, the framework is useful for considering endogeneity issues. In either Equation 3 or 4, the error term will contain ability factors and, potentially, the inter-action of those factors with skill inputs such as education and experience. As in
standard analyses of the endogeneity of schooling, if those ability factors are also inputs into choices about levels of schooling and skills then G1iand edniare endoge-nous. It is interesting to consider the assumptions under which such an endogeneity problem does not exist. Assume that cognitive ability is only an input into generating cognitive skills (that is, it enters the G1iproduction function but not those for G2iand G3i) and other types of ability do not help produce cognitive skills. Thus, for exam-ple, social ability does not help produce cognitive skills and cognitive ability does not help produce social skills. In that case, θ1idoes not enter the error term—it is fully captured in the included G1ivariable. Then, assuming the various types of ability are uncorrelated is sufficient to imply that G1iis exogenous. Further, if schooling choices are related only to generation of cognitive skills (schooling may help create social skills but that is not why people choose to go to school, for instance) then education is also exogenous. These assumptions are strong but no stronger than what is assumed when researchers include measures of ability in earnings regressions to address the schooling endogeneity problem, and we do not view them as completely unreason-able. We would like to be able to test these assumptions by comparing our OLS esti-mates with instrumental variable estiesti-mates. However, as discussed in Green and Riddell (2003), the IALS (and OILS) data sets do not contain useful instruments. Thus, we are forced to rely on the OLS estimates. It is worth reiterating that this is no different from the rest of the immigrant earnings literature which rarely if ever addresses education endogeneity.
III. Data and Basic Patterns
Our main data source is the Ontario Immigrant Literacy Survey (OILS) carried out by Statistics Canada in 1998 to study the language and literacy skills of Ontario immigrants. We also use the Canadian version of the 1994 International Adult Literacy Survey (IALS) to provide a comparison between immigrants and the native-born. Both data sets are comparable and contain the results of literacy tests as well as labor market variables such as income, education and labor force status. The OILS, as its name suggests, contains only immigrants from Ontario and, in fact, only from urban areas in Ontario. We could try to match this data using an IALS sub-sample contain-ing only native-born workers from urban areas in Ontario. However, this yields too small a native-born sample and, instead, we use a sample of native-born workers from urban areas throughout Canada. We include provincial dummy variables in our esti-mation to control for cross-province differences in earnings among the native-born.
Often, studies do not have particularly good measures of foreign education and experience so it is difficult to determine the impacts of these inputs.4However, the
OILS data contains direct questions on education obtained abroad and permits calcu-lation of age at arrival as a continuous variable. This means we can construct reliable versions of both fednand fexp, where the former is based on directly reported infor-mation and the latter is constructed using the Mincer experience measure and information on foreign-acquired education and age at arrival.
4. Exceptions are Betts and Lofstrom (2000) and Bratsberg and Terrell (2002).
We keep only individuals who have positive earnings and whose age is between 16 and 65, and drop observations when we do not have information on earnings, age at arrival or education. Following much of the immigration literature we focus on males and leave for a separate study the analysis of female immigrants. Our combined native-born (that is, IALS based) and immigrant (that is, OILS based) sample has 2,015 obser-vations of which 1,350 are immigrants. Both surveys are based on the Labour Force Survey (LFS) sample frame and we use the sample weights in our analysis.
Both the IALS and OILS contain data on annual earnings from paid and self-employment, weeks worked and usual hours per week. We use this data to construct weekly wages. However, it is worth noting that the earnings variable corresponds to the previous 12 months while weeks worked corresponds to the previous calendar year and, thus, there is imperfect overlap between the variables. We nonetheless use weekly wages because they come closer than annual earnings to the type of skill prices that we wish to examine. Doing so introduces measurement error in the dependent variable that should not introduce any biases in the estimated coefficients.5
Because the OILS and IALS data were collected four years apart, we adjust the earn-ings data from the IALS using the CPI to put them in comparable dollars to those recorded in the OILS.6Of course, native-born and immigrant earnings could differ
simply because 1993 and 1997 represent different conditions in the Canadian labor market. However, comparisons with estimates obtained from 1996 Census data, pre-sented below, suggest that this problem is not substantial. Finally, both data sets pro-vide measures of Document and Quantitative literacy. The Document questions, which are intended to assess capabilities in locating and using information in various forms, range from identifying percentages in categories in a pictorial graph to assess-ing an average price by combinassess-ing several pieces of information. The Quantitative component ranges from simple addition of pieces of information on an order form to calculating the percentage of calories coming from fat in a Big Mac based on a nutri-tional table. Thus, the questions are related to problem-solving and implementation of skills in the real world rather than attempting to measure abilities in math and read-ing, and are intended to elicit both current capacities and adaptability to answering questions in other contexts (Statistics Canada, 1996). This is an important point for the interpretation of our results since we regard the test results as revealing job rele-vant skills at the time of the interview rather than inherent abilities. It is worth empha-sizing that these skills are essentially cognitive in nature.
Green and Riddell (2003) find that the document and quantitative literacy scores are highly correlated in their IALS sample and, because of multicollinearity problems, work with a simple average of the individual literacy scores. In our data, both the native-born and immigrants who obtained their highest level of education before arriving in Canada exhibit correlations on the order of 0.87 between their document and quantitative scores. However, the correlation for male immigrants who obtained their highest level of education in Canada is only 0.67. This raises the possibility of separating different types of literacy effects, at least for the latter group. We present
5. Results using annual earnings and hourly wages are similar, and are available at https://webdisk.ucal-gary.ca/~aferrer/public.html
6. The OILS was carried out in May 1998, and the annual earnings information refers to 1997. IALS annual earnings refers to 1993.
results using both an average literacy score and using separate document and quanti-tative scores.
The other main variables in our analysis are standard human capital measures plus variables related to language ability in English or French. Experience is the standard Mincer measure of potential experience (that is, age −years of schooling −six). Since we know the age at which immigrants entered Canada, we are able to divide immi-grant experience into two components: foreign experience (age at arrival −years of schooling −six) and Canadian experience (age −age at arrival). We examine educa-tional impacts using a series of dummy variables corresponding to high school grad-uates, nonuniversity postsecondary gradgrad-uates, and those with a Bachelor’s or higher university degree. The omitted category contains individuals with less than completed high school education.7As mentioned earlier, a major advantage of the OILS data is
that respondents are asked about the highest level of education they attained before migrating as well as their highest ultimate level of education. Based on this, we can ascertain whether, for example, an immigrant completed high school abroad and then obtained a postsecondary degree in Canada. We make use of this feature by dividing our analysis between immigrants who completed their education in Canada and those who completed it abroad. This distinction—which cannot be made very precisely in many data sets—turns out to be important.8
The survey also includes questions on language ability in English or French, all of which are self-reported. We use one that asks the respondent how well he can express himself in English or French. We create a dummy variable corresponding to either of the two lowest categories: not at all or poorly. Finally, we include dummy variables corresponding to the country of origin. One variable corresponds to immigrants from the United States or the United Kingdom. while the other corresponds to immigrants from continental Europe, with the rest of the world forming the omitted category. The earlier literature on immigrants indicates that there are strong source country effects and that immigrants from the United States and the United Kingdom adapt particu-larly well to the Canadian economy. We also tried further dividing the rest of the world but found no significant differences among immigrants from other regions.
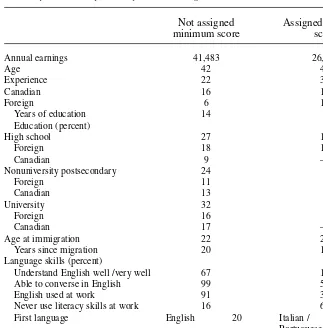
Table 1 displays summary statistics of the main variables of interest. Immigrants have, on average, four more years of experience and report the same number of years of schooling as the native-born. However, the distribution of formal education among immigrants is superior to that for the native-born. The fraction of native-born work-ers with no postsecondary education is 66 percent, vwork-ersus 49 percent among immi-grants. Additionally, a larger fraction of immigrants has a university degree (29 percent) compared to native-born Canadians (14 percent).9This apparent advantage
in observable skills does not translate into higher income. Annual earnings are very similar for native-born and immigrant men. A plausible explanation for this puzzle, long recognized in the literature, is that the labor market may place a different value
7. Note that individuals who attended postsecondary institutions but have not graduated are classified as high school graduates if they have in fact graduated from high school.
8. Some individuals report obtaining a postsecondary degree both in Canada and abroad. We treat these cases as completing education in Canada.
9. The difference between the years of schooling and highest level of attainment arises because immigrants tend to have fewer years of schooling than native-born workers who are in the same educational category.
Ferrer
, Green, and Riddell
389
Table 1
Summary Statistics for Immigrant and Native-born Workers
OILS 1998 and IALS 1994 Census 1996.Urban Ontario
Immigrant
Native-born Canadian Foreign
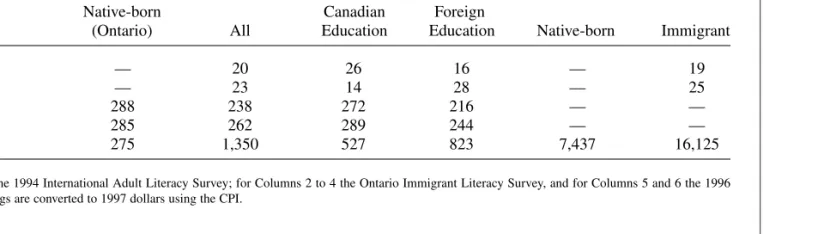
(Ontario) All Education Education Native-born Immigrant
Annual earnings 39,882 40,149 47,077 35,712 40,865 38,512
Hours worked 43 44 44 44 38 38
Weeks worked 48 49 49 49 46 46
Years of experience 19 23 18 26 17 22
Canadian — 16 17 16 —
Foreign — 7 1 10 —
Years of education 13 13 15 12 14 14
Education (percent)
Less than high school 27 23 10 31 21 25
High school 39 26 21 29 27 19
Foreign — 18 — 29 — —
Canadian — 8 21 — — —
Nonuniversity 20 22 31 16 30 32
Postsecondary
Foreign — 10 — 16 — —
Canadian — 12 31 — — —
University 14 29 38 24 22 24
Foreign — 14 — 24 — —
The Journal of Human Resources
390
Table 1 (continued)
OILS 1998 and IALS 1994 Census 1996.Urban Ontario
Immigrant
Native-born Canadian Foreign
(Ontario) All Education Education Native-born Immigrant
Years since migration — 20 26 16 — 19
Age at immigration — 23 14 28 — 25
Document literacy 288 238 272 216 — —
Quantitative literacy 285 262 289 244 — —
Observations 275 1,350 527 823 7,437 16,125
on the experience and education of immigrant workers. Note that if we distinguish between the foreign and Canadian components of the experience and education vari-ables, the “immigrant advantage” vanishes to some extent. For instance, the Canadian experience of immigrants (16 years) is less than the experience of native-born work-ers (19 years) and around one-half of the postsecondary educational degrees held by immigrants were obtained outside of Canada. Further, native-born workers have higher average document and quantitative literacy scores than immigrants. The immi-grant—native-born gap is especially large for document literacy.
An interesting fact arising from Table 1 is the substantial fraction of immigrants who acquire their education in Canada. Columns 3 and 4 separate immigrants between those who obtained their highest degree in Canada and those who did not acquire any Canadian education. It is evident that these two groups have very different labor mar-ket experiences. Immigrants with Canadian education earn 32 percent more than immigrants with no Canadian education and 18 percent more than native-born work-ers. Further, they have experience that is comparable to that of the native-born and higher levels of formal education than both native-born and other immigrant workers. The average literacy scores of this group are also close to those of Canadians. For example, the immigrant—native-born literacy differential is 72 points for immigrants educated outside Canada but only 16 points for those completing their education in Canada. Immigrants educated in Canada actually score a bit higher than the native-born on quantitative literacy, whereas those with foreign education score over 40 points less. The difference in earnings reflects these differences in human capital. These findings suggest that controlling for the origin of education may be important for understanding immigrant earnings.
In order to assess the extent to which our sample is representative of the Ontario population, the last two columns of Table 1 show average values for a sample drawn for urban Ontario from the 1996 Census. Most of the mean values (earnings, experi-ence, years of education and years since migration) are similar in the two samples.10
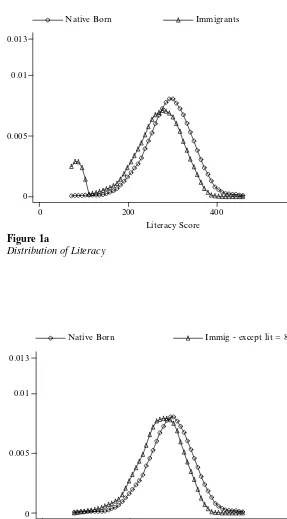
Figure 1a plots the kernel density function of the average of the document and quantitative literacy scores.11The immigrant distribution is bimodal with a main mode
near the mode in the native-born distribution and a smaller—though still substantial— mode near the bottom of the distribution.12The smoothing inherent in the kernel
esti-mator makes it appear that there is mass across a range of scores near the second mode. In reality, the second mode captures the fact that there are 145 immigrant respondents with the lowest score in the sample (83). This value was the score assigned to individuals who lacked the language skills to answer the test. Figure 1b plots the average literacy distributions removing the respondents who are assigned the
Ferrer, Green, and Riddell 391
10. The differences in the distribution of degrees and in the reported hours and weeks worked are likely due to differences in the two questionnaires regarding these variables. Despite these differences, estimated earn-ings equations using the two data sets are very similar. (Regressions available at https://webdisk.ucalgary. ca/~aferrer/public_html/)
11. We estimate the kernel density functions with the kdensity function in Stata, using the Epanechnikov kernel and Stata’s default bandwidth formula.
The Journal of Human Resources 392
Figure 1a
Distribution of Literacy
Figure 1b
Distribution of Literacy (except lit = 83)
Literacy Score
Native Born Immigrants
0 200 400 600
0 0.005 0.01 0.013
Literacy Score
0 200 400 600
Native Born Immig - except lit = 83
lowest score. The immigrant literacy distribution now appears more similar, though still inferior, to the native-born distribution.
The group of immigrants who could not complete the literacy test is interesting in its own right. One might assume that it consists primarily of recent immigrants. In fact, in terms of years since arrival in Canada it is a mixed group, with a predominance of immigrants from Southern Europe (Italian and Portuguese) who have been in Canada for over 20 years combined with a significant minority from Asia who have been in Canada for much shorter periods. Not surprisingly, the education and host-country language skills of this group are not strong. Nonetheless, their average earn-ings ($26,061) are perhaps higher than one might expect. Being able to last so long without learning English or French while still obtaining reasonable earnings levels is suggestive of the existence of immigrant enclaves, where they found jobs that do not require language or literacy skills.13Only 30 percent of these immigrants report using
English at work, and 60 percent report that they do not use literacy skills at work. Table 1A in the appendix shows the average characteristics of this particular group of immigrants.
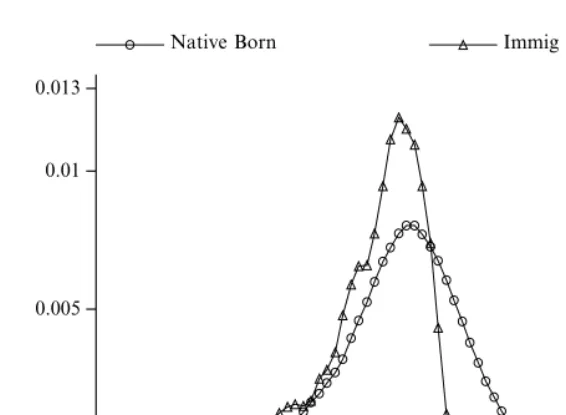
Figures 1c and 1d show the distribution of literacy scores (after removing those assigned the minimum score) for immigrants with and without Canadian education relative to that of the native-born. The literacy skills distributions of both immigrant groups are inferior to that of the Canadian-born, and the difference between the respective distributions is largest for immigrants educated outside of Canada. There is also much less dispersion in the literacy scores of immigrants who completed their education in Canada than is the case for the native-born. In particular, the upper tail of the distribution is much larger for Canadian-born men than for immigrants edu-cated in Canada. Most of the difference between the mean scores of immigrants who completed their education in Canada and the native-born, as reported in Table 1, arises from the relative absence of immigrants with high levels of literacy.14
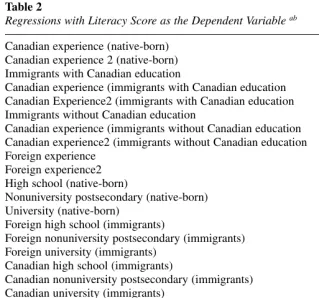
Understanding the relationship between literacy and human capital variables like education and experience is central to our analysis. Table 2 reports the results from a regression of the literacy score on these variables plus language proficiency, source country, and province of residence (not reported). We also include a dummy variable to control for the individuals who were incapable of answering the literacy test. We do not view this regression as representing a causal story of how literacy skills are generated. Instead, we interpret the coefficients as revealing partial correlations that are useful for summarizing literacy patterns in the population.
For native-born workers, the estimates indicate that experience is essentially uncor-related with literacy, but that there is a strong relationship between education and lit-eracy.15Immigrants who have not completed high school (the base category) have
average literacy scores about 50 points below their Canadian counterparts. Relative to high school dropouts both the nonuniversity postsecondary and university literacy dif-ferentials are smaller, though not dramatically so, than those observed for the native-born. As a result, literacy scores of foreign-educated immigrants with a university
Ferrer, Green, and Riddell 393
13. See Edin, Fredriksson, and Aslund (2003) for evidence relating to ethnic neighborhoods and immigrant enclaves.
The Journal of Human Resources 394
Figure 1c
Distribution of Literacy (Canadian Education)
Figure 1d
Distribution of Literacy (No Canadian Education)
Literacy Score
0 200 400 600
0 0.005 0.01 0.013
Native Born Immig - Can Edu
Literacy Score
0 200 400 600
0 0.005 0.01 0.013
degree are approximately 60 points lower than those for university-educated native-born workers. Foreign experience does not have a statistically significant relationship with literacy, but there is a strong positive relationship between the Canadian experi-ence of immigrants educated in Canada and literacy. For immigrants educated abroad this relationship remains positive, though smaller and not statistically significant. These improvements in literacy associated with time in Canada may reflect increased language skills that improve the “usability” of immigrant cognitive skills.16
Ferrer, Green, and Riddell 395
16. Estimations (not reported) that included interactions of Canadian experience with the source region indi-cate that immigrants from English-speaking countries do not exhibit increases in literacy with time in Table 2
Regressions with Literacy Score as the Dependent Variable ab
Canadian experience (native-born) 0.48 (.31)
Canadian experience 2 (native-born) −0.027 (.0069)+++
Immigrants with Canadian education −56.89 (25.04)++
Canadian experience (immigrants with Canadian education 3.08 (1.36)++
Canadian Experience2 (immigrants with Canadian education −0.070 (.042)
Immigrants without Canadian education −52.43 (16.11)+++
Canadian experience (immigrants without Canadian education 1.72 (1.24) Canadian experience2 (immigrants without Canadian education −0.057 (.032)+
Foreign experience −0.47 (1.07)
Foreign experience2 0.0047 (.036)
High school (native-born) 27.81 (2.79)+++
Nonuniversity postsecondary (native-born) 34.73 (3.53)+++
University (native-born) 75.42 (3.18)++
Foreign high school (immigrants) −0.97 (10.57)
Foreign nonuniversity postsecondary (immigrants) 26.32 (12.68)++
Foreign university (immigrants) 67.67 (10.76)+++
Canadian high school (immigrants) 23.82 (25.97)
Canadian nonuniversity postsecondary (immigrants) 7.04 (25.20)
Canadian university (immigrants) 40.59 (24.42)
Language proficiency −14.95 (6.44)++
U.S. or U.K. origin 36.49 (9.07)+++
European origin 15.88 (8.23)+
Unable to answer literacy −149 (12.28)+++
Observations 2,015
R2 0.47
Notes: (+++) indicates the coefficient is significant at 1 percent significance level, (++) indicates the coefficient
is significant at 5 percent significance level, (+) the coefficient is significant at the 10 percent significance
level.
a. Regression also includes controls for province of residence.
Overall, for foreign educated immigrants, there is a literacy deficiency relative to the native-born and that deficiency rises somewhat with education. However, the esti-mates in Table 2 also indicate that average literacy score levels are as low or lower for immigrants who complete their education in Canada and that disadvantage is larger at higher education levels. Thus, the lower literacy levels among immigrants overall and their tendency to fall further behind at higher levels of education appears to be more a function of immigrants themselves than of foreign institutions.17Notice that these
results control for region of origin; furthermore, immigrants from the United States or the United Kingdom do not face as large a literacy disadvantage. Combining this with the earlier result that immigrants and the native-born differ more in document lit-eracy than in quantitative litlit-eracy, a reasonable set of conclusions might be the fol-lowing: (1) that the document literacy score partially reflects language fluency for immigrants; (2) that immigrants not from the United States or the United Kingdom have some difficulties in English or French; and (3) that any language difficulties accentuate differences relative to the native-born to a greater extent at higher than lower education levels.
IV. The Effect of Education and Literacy
on Immigrant Earnings
A. Results Without Literacy Variables
We now turn to log weekly wage regressions, first presenting results without con-trolling for literacy. This allows us to compare our results to common specifications in the immigrant literature and to closely examine the effect of foreign education and experience. Our initial specification (Table 3, Column 1) includes the education vari-ables used earlier, a quadratic in experience, language proficiency, and dummies for country of birth. As mentioned above, we take advantage of the OILS questions on education by including separate dummy variables for immigrants according to whether they completed their education in Canada or before entering Canada. Furthermore, we separate the Canadian experience of these two groups of immi-grants. The three experience effects reported in the first column are comparable in size, and tests of the hypothesis that they equal each other cannot be rejected at con-ventional significance levels. The estimates relating to the Canadian experience of immigrants who complete their education in Canada and to the native-born are extremely similar. The intercept coefficients imply that immigrants who complete their education abroad have entry earnings that are over 35 percent lower than com-parable native-born workers, while earnings of those who finish their education in Canada do not differ from those of the native-born. These estimates apply to the base category, those with reasonable language skills and who are not from the United The Journal of Human Resources
396
Canada. We cannot tell whether Canadian experience is capturing a time in Canada effect or cohort effects. However, there is no such confusion with foreign experience and the results there are the same as with Canadian experience for the native-born.
Ferrer
, Green, and Riddell
397
Table 3
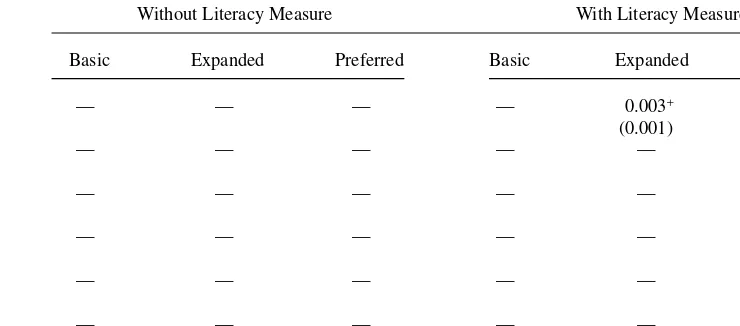
Earnings Regressions with and without Literacy Effectsa,b,c
Without Literacy Measure With Literacy Measure
Basic Expanded Preferred Basic Expanded Preferred
Immigrant educated after arrival −0.036 −0.018 0.312+++ −0.425 −0.367 −0.706+
(0.153) (0.087) (0.099) (0.408) (0.408) (0.435)
Immigrant educated before arrival −0.352++ 0.366+ 0.633++ 0.735+ 0.858++ 0.479
(0.169) (0.194) (0.285) (0.416) (0.431) (0.462)
Language −0.297+++ −0.279+++ −0.277+++ −0.207+++ −0.190+ −0.207++
(0.100) (0.101) (0.104) (0.104) (0.104) (0.101)
Canadian experience
Immigrant educated after arrival 0.070+++ — — — — —
(0.021) Canadian experience2
Immigrant educated after arrival/100 −0.113+ — — — — —
(0.065) Canadian experience
Immigrant educated before arrival 0.052+++ 0.049++ 0.045++ 0.044++ 0.042++ 0.041++
(0.020) (0.020) (0.020) (0.020) (0.020) (0.019)
Canadian experience2
Immigrant educated before arrival/100 −0.104++ −0.101++ −0.095+ −0.087+ −0.083 −0.083+
(0.051) (0.051) (0.052) (0.052) (0.052) (0.050)
Canadian experienced 0.077+++ 0.077+++ 0.089+++ 0.089+++ 0.086+++ 0.081+++
(0.005) (0.0047) (.0060) (0.006) (0.006) (0.007)
Canadian experience2/100 −0.137+++ −0.137+++ −0.147+++ −0.137+++ −0.138+++ −0.158+++
The Journal of Human Resources
398
Table 3 (continued)
Without Literacy Measure With Literacy Measure
Basic Expanded Preferred Basic Expanded Preferred
Foreign experience — 0.016 0.030 0.032+ 0.035+ 0.036++
(0.017) (0.020) (0.020) (0.020) (0.019)
Foreign experience2/100 — −0.090 −0.106 −0.108+ −0.114++ −0.115++
(0.057) (0.060) (0.059) (0.059) (0.057)
High school 0.015 0.006 — — — —
(0.043) (0.043)
Nonuniversity postsecondary 0.040 0.028 — — — —
(0.054) (0.054)
University 0.396+++ 0.387+++ — — — —
(0.048) (0.049)
High school. Native-born — — 0.264++ 0.158+ 0.171+ 0.226
(0.092) (0.091) (0.092) (0.286)
Nonuniversity postsecondary — — 0.491+++ 0.380+++ 0.399+++ −2.276++
native-born (0.109) (0.108) (0.108) (0.392)
University native-born — — 0.563+++ 0.340+++ 0.323+++ 0.352
(0.100) (0.103) (0.104) (0.359)
Foreign high school — — −0.044 −0.087 −0.082 −0.074
(0.264) (0.264) (0.265) (0.256)
Foreign nonuniversity — — 0.200 0.121 0.157 0.171
postsecondary (0.287) (0.288) (0.288) (0.278)
Foreign university — — 0.503++ 0.354 0.360 0.369
Ferrer
, Green, and Riddell
399
High school*Canadian — — −0.011+++ −0.009+++ −0.010+++ −0.019+++
experience. Native-born (0.004) (0.004) (0.004) (0.004)
Nonuniversity postsecondary — — −0.027+++ −0.027+++ −0.028+++ −0.028+++
*Canadian experience. Native-born (0.005) (0.005) (0.006) (0.006)
University*Canadian — — −0.005 −0.005 −0.005 −0.015+++
experience. Native-born (0.005) (0.004) (0.004) (0.005)
Foreign high school*foreign — — −0.007 −0.004 −0.004 −0.004
experience. Immigrant (0.020) (0.020) (0.020) (0.019)
Foreign Nonuniversity — — −0.012 −0.015 −0.017 −0.018
postsecondary*foreign (0.027) (0.027) (0.027) (0.026)
experience. Immigrant
Foreign university*foreign — — −0.039++ −0.043+++ −0.044+++ −0.044+++
experience. Immigrant (0.016) (0.015) (0.015) (0.015)
Literacy score. Native-born — — — 0.003+++ — —
(0.0004)
Literacy. Immigrants educated — — — 0.005+++ — —
after arrival (0.001)
Literacy. Immigrants educated — — — 0.003++ — —
before arrival (0.0013)
Unable to answer literacy questions — — — 0.250 0.244 0.250
(0.265) (0.265) (0.256)
Quantitative literacy native-born — — — — 0.0025+++ −0.007+++
(0.0006) (0.003)
Quantitative literacy immigrants. — — — — 0.0004 0.001
Educated after arrival (0.0013) (0.001)
Quantitative literacy. immigrant. — — — — −0.0004 −0.0003
educated before arrival (0.002) (0.0016)
Document literacy native-born — — — — 0.0003 0.007+++
(0.0005) (0.0024)
Document literacy immigrants. — — — — 0.005+++ 0.005+++
The Journal of Human Resources
400
Table 3 (continued)
Without Literacy Measure With Literacy Measure
Basic Expanded Preferred Basic Expanded Preferred
Document literacy immigrants. — — — — 0.003+ 0.0027++
Educated before arrival. (0.001) (0.0014)
Quantitative literacy*experience — — — — — 0.00043++
(0.00007)
Document literacy*experience. — — — — — –0.00036+++
Native-born (0.00007)
Quantitative literacy*high school — — — — — 0.0077+++
quantitative literacy*nonuniversity (0.0021)
postsecondary. — — — — — 0.0009
Native-born (0.0022)
Quantitative literacy*university. — — — — — 0.0013
Native-born (0.0020)
Document literacy*high school. — — — — — −0.007+++
Ferrer
, Green, and Riddell
401
Document literacy*nonuniversity — — — — — 0.008+++
postsecondary. Native-born (0.0023)
Document literacy*university. — — — — — −0.0004
Native-born (0.0019)
Observations 2,014 2,014 2,014 2,014 2,014 2,014
Adjusted R-squared 0.195 0.203 0.210 0.234 0.237 0.286
Notes: (+++) Indicates significance at 1 percent. (++) Indicates significance at 5 percent. (+) Indicates significance at 10 percent. a. Standard errors in parenthesis
b. Regressions also include controls for province of residence (native-born) and country of origin (immigrants).
c. For ease of interpretation the experience and education variables are defined in such a way that the immigrant coefficients stand on their own rather than being defined relative to the native-born coefficients.
States, the United Kingdom, or Europe. For those with poor language skills, average weekly earnings are another 30 percent lower.
The basic specification restricts immigrants’ returns to foreign experience to be the same as returns to Canadian experience for the native-born. The specification in the second column of Table 3 permits a separate return to foreign experience. This is important because Friedberg (2000) finds that negative immigrant entry earnings effects can be completely explained by a lower return to foreign experience than native experience. For immigrants from some countries, she found that foreign expe-rience was worth zero in the Israeli labor market. Similar results are found for Canada in Green and Worswick (2002), and Aydemir and Skuterud (2005). Echoing these results, when we introduce foreign experience controls in Column 2, the intercept for immigrants educated before arrival is no longer negative. At the same time, the returns to Canadian experience for this group are now estimated to be around 3 percent below those for the native-born and Canadian educated immigrants in the period after entry into the Canadian labor market.18Finally, note that introducing the foreign experience
effect does not change the impacts of education, language, and country of origin. The third column of Table 3 contains our preferred specification which we reach by first allowing a complete set of interactions among all immigrant, experience and education variables and then eliminating interactions where testing indicates it is appropriate. Thus, for example, we allowed for different returns to education for immi-grants who obtained their highest degree in Canada. We could not reject the restric-tion that the differences between these returns and those for the native-born were zero at any conventional significance level. We also allowed for the possibility that each type of experience (whether foreign- or Canadian-acquired) might interact with each type of education. In each case, interaction coefficients involving immigrants who obtained their education after arrival in Canada were neither statistically signifi-cantly different nor economically substantially different from what was observed for the native-born. Thus, in every dimension, immigrants educated after arrival appear to have equivalent returns to human capital when compared with the native-born (after holding language ability constant). We do find evidence of significant interactions of Canadian experience with education for the native-born (and immigrants educated after arrival) and of foreign experience with foreign education for immigrants edu-cated before arrival. The coefficient that stands out most among these latter interac-tions is the interaction of foreign experience with a foreign university degree. This coefficient, when combined with the foreign experience coefficient for the base group (high school dropouts) implies that individuals with a foreign university degree obtain essentially zero returns to foreign experience. Individuals with lower levels of educa-tion appear to get positive, though still small, returns to foreign experience. This sug-gests that it may be harder to translate human capital to a new country the less manual are the skills involved.
To aid in interpretation of our preferred results we present in the left panel of Table 4 fitted average earnings for a set of specific cases characterized by differing
18. This specification imposes that returns to Canadian experience for immigrants completing their educa-tion in Canada are the same as those for the native-born. Allowing the returns to differ for these two groups produces coefficients that are extremely similar, and the hypothesis that they are equal cannot be rejected at any conventional significance level.
Ferrer
, Green, and Riddell
403
Table 4
Fitted Returns to Immigrants and Native-born by Experience and Educationa
Interaction Education–Experience Interaction Literacy–Human Capital
Canadian Canadian Canadian Canadian Canadian Canadian
Experience = Experience = Experience = Experience = Experience = Experience =
0 10 20 0 10 20
Native-born (less than high school) 0.00 0.74 1.19 0.18 1.04 1.58
(0.05) (0.08) (0.26) (0.25) (0.25)
Immigrant (less than high school)
Foreign experience = 0 0.63 0.99 1.15 1.17 1.50 1.66
(0.29) (0.24) (0.23) (0.36) (0.33) (0.32)
Foreign experience = 10 0.83 1.18 1.34 1.41 1.74 1.90
(0.25) (0.19) (0.19) (0.34) (0.30) (0.30)
Native-born (high school) 0.26 0.90 1.24 0.58 1.25 1.60
(0.09) (0.10) (0.10) (0.24) (0.24) (0.24)
Immigrant (foreign high school)
Foreign experience = 0 0.59 0.94 1.10 1.09 1.42 1.59
(0.29) (0.24) (0.23) (0.36) (0.32) (0.32)
Foreign experience = 10 0.72 1.07 1.23 1.30 1.63 1.79
(0.22) (0.24) (0.24) (0.32) (0.36) (0.35)
Native-born (university) 0.56 1.25 1.65 0.79 1.50 1.90
(0.10) (0.10) (0.10) (0.25) (0.24) (0.25)
Immigrant (university)
Foreign experience = 0, foreign university 1.14 1.49 1.65 1.54 1.87 2.03
(0.24) (0.19) (0.20) (0.31) (0.29) (0.29)
Foreign experience = 10, foreign university 0.94 1.30 1.46 1.34 1.67 1.83
(0.21) (0.16) (0.18) (0.30) (0.27) (0.28)
levels of education and experience. To generate the entries in this table, we formed fit-ted average log earnings values for a base case person who is native-born, did not complete high school and has no Canadian experience. We also estimated average log earnings for native-born and immigrant workers with differing levels of Canadian and foreign experience and education. For the immigrants, we formed the fitted averages such that they are relevant for an individual who finished his education outside Canada, who is not from the United States, the United Kingdom, or Europe and who does not have poor language skills in English or French. The various fitted earnings are differenced relative to those of the base case native-born individual.
Examination of the entries corresponding to immigrants who have not completed high school with either zero or ten years of foreign experience (the second and third rows in the first column) indicates that low educated immigrants earn considerably more than similarly educated native-born workers when they first enter the Canadian labor market. By moving along the second row, we can see the effects of increasing Canadian experience for a low educated worker who entered with no foreign experi-ence. The larger increase as we move along this row rather than down the first column indicates that these immigrants receive a greater return to Canadian experience than foreign experience. It is interesting to compare the differential returns of a native-born with 20 years of experience (1.194) with those of an immigrant with 20 years of Canadian experience but no foreign experience (1.148) and those of immigrants with the same amount of total experience split between ten years of foreign experience and ten years of Canadian experience (1.178). All three estimates are similar in size. The initial immigrant advantage is whittled away by the fact that the native-born get a higher return to Canadian experience than do immigrants.19For high school
gradu-ates, immigrants with no experience again earn more than do similar native-born workers. However, an immigrant with ten years of foreign experience and no Canadian experience earns about 20 percent less than a native-born worker with ten years of experience. This is an example of an immigrant earning less than a native-born worker with the same total experience because of lower returns to foreign expe-rience. For the university-educated, foreign experience actually has a negative return, as witnessed by the fact that the earnings differential is lower for a university-educated immigrant with ten years of foreign experience than one with zero years. Immigrants with 20 years of Canadian experience and no foreign experience and native-born workers with 20 years of experience earn the same amount but immi-grants with ten years of foreign experience and ten years of Canadian experience have earnings that are about 75 percent of those of the other two groups. Thus, patterns are similar for the high school and the university-educated except that the latter have even lower returns to foreign experience.
B. Results with Literacy Variables
In the second panel of Table 3, we examine the effects of literacy. A comparison of our basic estimates (Column 4), where we simply add the literacy variables without any interactions, and our preferred specification (Column 6), which adds all significant The Journal of Human Resources
404
interactions, reveals the direct impact of literacy and its indirect impacts on other returns. The returns to literacy are substantial, with a 100 point increase in literacy (equivalent to approximately one and a half standard deviations in the literacy score dis-tribution) raising earnings by about the same amount as moving from being a high school dropout to a university graduate. As in Green and Riddell (2003), none of the experience effects or experience interactions change when we control for literacy. However, estimated returns to Canadian education decline by about one-third, and even more in the case of foreign degrees. This suggests that a substantial amount of conven-tional estimates of the return to schooling, especially foreign schooling, arises from the impact of education on literacy and the value placed on literacy in the labor market. Note, in particular, how the different returns from foreign and Canadian university edu-cation seen in more standard specifiedu-cations are eliminated once we control for literacy in a flexible way. Thus, differences in returns to university turn out to be completely explained by differences in the extent to which foreign and Canadian university pro-grams generate literacy. Recall that immigrants with a foreign-acquired university degree had an average literacy score that was 60 points lower than the score for the native-born with a Canadian degree. Differences in returns to education between immi-grants and the native-born are often attributed to insufficient recognition of credentials obtained abroad. This result speaks against that conclusion; foreign educated university graduates have lower effective literacy levels than their Canadian educated counterparts. An important question is whether returns to literacy are lower for immigrants. Our basic specification allows for different returns to literacy for the native-born, immi-grants who completed their education before arrival, and immiimmi-grants who completed their education in Canada. The estimates indicate almost identical returns to literacy for the native-born and immigrants educated before their arrival in Canada. Immigrants who finished their education in Canada have a higher return to literacy, though it is not immediately obvious why this would occur. Nonetheless, these esti-mates provide no evidence of discrimination in the sense of employers paying immi-grants less for the same literacy skills as native-born workers.20 It is worth
emphasizing that this result refers to “usable” literacy skills. Immigrants may have higher literacy scores if tested in their native language and one could argue that those skills are being undervalued, but they receive returns to literacy as measured in English or French that are no worse than those obtained by native-born workers.
In Column 5 we allow document and quantitative literacy to have separate effects. The patterns are intriguing. The native-born get a substantial return to quantitative literacy but none to document literacy. For immigrants the opposite pattern holds. One way to interpret this result would be that the document score for immigrants is picking up language proficiency. The fact that immigrants obtain no earnings impact from quantitative literacy might suggest that they are being discriminated against since this skill is highly valued among the native-born. However, the result could be due to multicollinearity. That is, it may not be possible to separately identify the effects of document and quantitative literacy given the high correlation between the
20. Recall that differences in the coefficient on the literacy variable between immigrants and the native-born can be interpreted as discrimination in cases where there are no interactions between literacy and other vari-ables such as experience. The interactions between literacy and both immigrant experience and education are not significant at any conventional level of significance.
two scores. We thus advise strong caution in pinning too much on these differences between immigrants and the native-born.21
The last specification in Column 6 is the result of a specification search involving interactions of literacy scores of both types with education and experience. The results indicate some interactions of literacy with experience and education for the native-born but no such interactions for the foreign native-born. A key implication is that literacy does not change returns to experience in a substantial way for either the native-born or immigrants. This fits with the insignificant effects on literacy of both foreign expe-rience for immigrants and Canadian expeexpe-rience for the native-born. It also agrees with the conclusion reached by Green and Riddell (2003) that experience does not gener-ate literacy but it does genergener-ate some other skill(s) that employers value. There is some evidence that this unobserved skill interacts with literacy skills for the native-born (because literacy scores and experience variables have nonzero interaction effects) but these interaction effects are not large.
A particularly interesting implication from the last column is that immigrants edu-cated abroad receive very similar returns to foreign and Canadian-acquired experience but both are valued less than experience acquired by the Canadian-born and immigrants educated in Canada. Although one might have expected that immigrants receive lower returns to experience because they don’t have the literacy skills to complement the skills generated by experience, the lack of significant interactions with literacy skills suggests that this is not the case. Whatever is behind the different returns to experience for Canadian and foreign educated workers it is not related to literacy. Thus, literacy does not help explain one of the key differences between immigrant and native-born work-ers. It stands as a separate and interesting part of the immigrant assimilation process.
Finally, the dummy variable corresponding to immigrants unable to complete the literacy test has a positive coefficient indicating that these workers earn approximately 40 percent more than one would anticipate given their literacy score and other char-acteristics. While this coefficient is not precisely estimated, it may fit with evidence on the importance of immigrant enclaves in allowing immigrants to do better than expected when they do not acquire the host-country language (Edin, Fredriksson, and Aslund 2003).
We repeat the exercise of forming fitted average log earnings for various types of workers but, in this case, holding the literacy score value constant at 292 (the over-all sample average). The results are contained in the righthand panel in Table 4. Comparison between the right and the left panel shows similar patterns to those observed when literacy is not held constant. For example, university-educated immi-grants with no foreign experience and educated abroad earn much more than their native-born counterparts. However, their lower return to experience implies that the two groups have similar earnings when they reach 20 years of Canadian experience. Foreign experience is actually a handicap for workers with this education level. There are two main differences between the results controlling and not controlling for literacy. The first is that the (positive) differential between immigrant entry earn-ings and the earnearn-ings of native-born workers with zero experience is larger when we
21. We tried to explore this issue further by interacting the document and quantitative measures with the lan-guage variable but found no significant interactions.
control for the literacy level. This implies that lower literacy levels weaken immi-grant earnings relative to similar native-born workers. The second difference between the two panels is the greater similarity in earnings at high levels of Canadian experience between immigrant and native-born earnings when not controlling for lit-eracy. This is a reflection of the rise in average literacy with Canadian experience for immigrants described earlier. This rise shows up in the earnings numbers in the left-hand panel but cannot reveal itself in the rightleft-hand panel where the literacy score is constant.
One interesting question arising from these estimates is the relative importance of lower immigrant literacy levels in explaining immigrant—native-born earnings differentials. To investigate this, we constructed a series of fitted average earnings dif-ferentials, all based on the last column in Table 3. We first construct an estimate of average log earnings for immigrants and the native-born separately using the esti-mated coefficients in conjunction with the appropriate average values for the regres-sors. Those estimates imply an overall average immigrant earnings advantage of 0.03 log points over the native-born among high school educated workers and an immi-grant disadvantage of 0.22 log points among the university-educated. We next repeated this exercise but gave immigrants the same return to foreign experience as the native-born receive for their Canadian experience. The result is an increase in the immigrant advantage for the high school educated to 0.25 log points and an immigrant advantage of 0.44 log points for the university-educated. This fits with results in ear-lier papers, described above, indicating that lower returns to foreign experience play an important role in understanding immigrant—native-born earnings differentials. Also, as in Friedberg (2000), the importance of returns to foreign experience is great-est for more-educated workers.
In our next counterfactual, we set the returns to foreign experience back to their original value but give immigrants the average literacy scores observed for native-born workers with the same level of education. For the high school educated, this increases the immigrant advantage to 0.23 log points. For the university-educated, it reduces the immigrant disadvantage from 0.22 log points to 0.06 log points. Thus, poorer literacy among immigrants has an effect on immigrant—native-born differ-entials that is very similar in size to the impact of low returns to foreign experience for the high school educated but about one-quarter the effect of low returns to for-eign experience among the university-educated. Low literacy thus appears to be an important factor for understanding immigrant earnings differentials, though not nearly as important as returns to foreign experience for understanding differentials in the group where human capital transfer is likely most important—the highly educated.
V. Conclusions
At the outset of the paper, we posed three questions related to immi-grant literacy and earnings. First, do immiimmi-grant literacy skills differ from those of the native-born? Second, do immigrants receive a different return to those skills than obser-vationally equivalent native-born workers? Third, can differences in levels and returns to literacy skills help explain differences in earnings between immigrant and native-born