and Welfare Dependency
Knut Røed
Elisabeth Fevang
a b s t r a c t
Based on Norwegian register data, we set up a multivariate mixed propor-tional hazard model (MMPH) to analyze nurses’ pattern of work, sickness absence, nonemployment, and social insurance dependency from 1992 to 2000, and how that pattern was affected by workplace characteristics. The model is estimated by means of the nonparametric maximum-likelihood es-timator (NPMLE). We find that downsizing processes involve a significant increase in the level of sickness absence among still-employed nurses. They also cause a significant increase in the probability of entering into more long-lasting health-related social insurance dependency.
I. Introduction
During the period from the early 1990s to 2003, Norway experienced a remarkable increase in sickness absence and health-related withdrawals from the labor market. The average number of sickness days paid for by the National Insur-ance Administration (NIA) increased by 75 percent, from a low of eight days per worker in 1994 to 14 in 2003; see Figure 1, Panel A. And the rate at which new
Knut Røed is a senior research fellow and Elisabeth Fevang a research assistant at the Ragnar Frisch Centre for Economic Research, Oslo, Norway. This paper is part of a Strategic Institute Program on Labor Market and Pension Research, financed by the Norwegian Ministry of Labor and Social Inclusion and the Norwegian Ministry of Finance. We have also received financial support from the Health Economics Research Program at the University of Oslo (HERO). Thanks to P ˚al Jørgen Bakke, Morten Henningsen, Jonas Lagerstro¨m, Karine Nyborg, Oddbjørn Raaum, and two anonymous referees, for valuable comments. Also thanks to Morten Henningsen for assistance in the preparation of municipality/county data. The administrative micro-data used in this paper are received from Statistics Norway by consent of the Norwegian Data Inspectorate. The authors are not in a position to make the data available to other users, but Statistics Norway can provide access subject to approval of an application. Interested Norwegian scholars may consult www.ssb.no/mikrodata/. Access from outside Norway is restricted. Statistics Norway may allow access, however, via statistical agencies in the country in question, provided they operate with sufficient guarantees of confidentiality. The authors of this paper will help scholars seeking access to these data as best they can. Correspondence to: Knut Røed, the Ragnar Frisch Centre for Economic Research, Gaustadalle´en 21, 0349 Oslo, Norway; www.frisch.uio.no. E-mail: knut.roed@frisch.uio.no.
[Submitted June 2005; accepted May 2006]
ISSN 022-166X E-ISSN 1548-8004Ó2007 by the Board of Regents of the University of Wisconsin System
Figure 1
Sickness absence, unemployment, turnover, and downsizing in Norway 1993–2003
Sources: Absence data: the Norwegian National Insurance Administration (Rikstrygdeverket); unemployment data: OECD; turnover data: based on microdata used in Dale-Olsen (2005) and kindly provided to us by the author; downsizing data: based on microdata collected by Statistics Norway and kindly provided to us by Morten Henningsen (these data may be subject to future revision).
and
Fe
v
ang
workers began absence spells that turned out to entail long-lasting social insurance dependency (for more than six months) increased at a similar pace, from 2 percent of the labor force in 1994 to just above 3 percent in 2000 (Fevang et al. 2004). Many of these spells ended in permanent disability. Hence, the number of disability pen-sioners also rose sharply, from around 236,000 in the early 1990s to 301,000 by the end of 2003.
Policymakers are concerned that this development is somehow related to the ‘‘bru-talization’’ of work environments, with fiercer competition, faster structural change, and an increased pressure to be adaptable. The pace of structural change has clearly increased in sectors of the economy that were previously sheltered against competi-tion, such as public utilities, telecommunications, postal services, healthcare, and social services. There are also indications that the general levels of downsizing and turnover have risen, see Figure 1, Panels C and D. In particular, firms’ downsiz-ing propensity has increased sharply after 1995, despite general improvements in the business cycle, see Panel B. The rise in turnover rates is a more predictable conse-quence of the cyclical developments. However, Dale-Olsen (2005) shows, on the ba-sis of micro firm data, that even after controlling for business cycles (and changes in industry composition) the turnover rate in Norwegian firms displayed a significant positive trend during 1990–2002.1
A more turbulent labor market may have increased the risk of work-related health impairments, and also made it more difficult for employees to be at work with given health problems. As we show in the next section, some international evidence sug-gests that large organizational changes sometimes do have adverse health consequen-ces. According to the influential demand-control theory (Karasek 1979; Karasek and Theorell 1990), most work-related adverse reactions of psychological strain (fatigue, anxiety, depression, and physical illness) occur when the psychological demands of the job are high while the worker’s decision latitude in the task is low. It is conceiv-able that enforced organizational changes involving downsizing of the staff increase the risk of such reactions. In Norway, as well as in other welfare state economies, there has been a recent drive toward making the public sector more efficient, and large organizational changes have been implemented to achieve this aim. Given the strong employment protection in this sector, it is a worry that publicly financed sickness and disability insurance (and ‘‘voluntary’’ withdrawals from the labor force) sometimes serves as a substitute for layoffs.2
The present paper examines the relationship between organizational change, ab-senteeism, and welfare dependency within the public sector. It focuses on a group of workers that faced substantial workplace turbulence during the 1990s—namely,
1. There is clearly also a business-cycle pattern in the sickness absence behaviour, but existing evidence (Nordberg and Røed, 2003; Askildsen,Bratberg, and Nilsen 2005) indicates that this relationship is not very strong. And business cycle effects can obviously not explain the rise in absenteeism that occurred after the cyclical peak in 1998.
nurses working in hospitals, nursing homes, and community nursing.3Our empirical basis is the municipalities’ and counties’ own employment registers for 1992–2000. These registers confirm that the pace of organizational change has increased some-what in the healthcare and social services sector. Despite a rather strong overall em-ployment growth (the total number of man-years in the sector rose by 23.8 percent from 1992 to 2000), we find that the fraction of nurses who experienced an occur-rence of large downsizing at their own workplace (encompassing at least 20 percent of the man-years) increased from an average of around 2.1 percent per year in 1992– 95 to 2.9 percent in 1996–2000. An important distinguishing feature of downsizings in this part of the economy is that they typically occur without layoffs. What usually happens is that redundant (permanent contract) employees are offered alternative employment opportunities within the municipality/county. Hence, the topic ad-dressed in this paper is not the impact of individual displacement, but rather the con-sequences of experiencing a substantial organizational change, possibly involving being transferred to a new workplace. Our key idea is to use observed organizational changes, as they materialized in downsizing and/or large staff reshuffling, together with longitudinal data on the employees’ individual work histories, to identify the causal effects of organizational change on the workers’ absence behavior and subse-quent employment and welfare dependency patterns.
Based on the population of employed nurses in October 1992, we set up a multi-variate mixed proportional hazards (MMPH) model that facilitates an analysis of how workplace events affect employee behavior in terms of transitions between pres-ence and abspres-ence, between different workplaces, and between employment and non-employment (with or without social insurance/assistance). To make this possible, we have merged the employers’ employment registers with various public administrative registers for the same period, covering all kinds of social security transfers to indi-viduals (sickness benefits, unemployment benefits, social assistance, rehabilitation benefits, and disability benefits). The statistical model we use imposes a minimum of unjustified parametric restrictions. The various selection processes, including se-lection into the initial state, are modeled by means of the nonparametric maximum likelihood estimator (NPMLE), which approximates the unknown distribution of observed heterogeneity in terms of a joint discrete distribution with an (a priori) un-known number of support points.
Our main finding is that major organizational changes do cause higher rates of ab-sence and welfare dependency even when the changes do not involve layoffs. Nurses employed at workplaces where large downsizing and/or substantial changes in the composition of the staff occurred, experienced higher rates of long-term sickness absence than nurses who worked in more stable economic environments, ceteris
paribus. They also experienced higher rates of entry into other types of social secu-rity benefits as well as to self-supported nonemployment. In total, we find that a large downsizing process (a reduction of at least 20 percent of the man-years during the course of 12 months) causes between 1.5 and 3.0 percent of the nurses who worked at the workplace in question initially to either become dependent of social insurance benefits (primarily sickness, rehabilitation, or disability benefits) or to pull out of the labor force without benefits. After the downsizing process is completed, the adverse employment effect slowly peters out, but it takes more than six years before it is no longer significantly different from zero.
The paper is structured as follows: The next section provides a brief review of the existing literature. Section III describes the data. Section IV introduces the statistical model. Section V presents the results, and Section VI concludes.
II. Existing Evidence
An extensive international economics literature covers individual costs of displacement; for overviews, see, for example, Hamermesh (1987), Kletzer (1998) and Kuhn (2002). The main conclusion arising from this literature is that the costs associated with involuntary job loss are large and persistent in terms of both subsequent income and employment propensity. A recent Norwegian study (Huttunen, Møen, and Salvanes 2006) finds that displacement of male workers in the manufactur-ing industries substantially raises the probability of permanent exits from the labor market. While 13 percent of the displaced workers in that study had left the labor force seven years after the displacement occurred, this was the case for only 8 percent of the control group containing similar nondisplaced workers. Another study (Rege, Telle, and Votruba 2005) shows that workers employed in plants that closed between 1993 and 1998 were 28 percent more likely to be disability pensioners in 1999 than comparable workers in nondownsizing plants. We have found no empirical evidence in the economics literature regarding the impact of organizational changes on individ-uals who do not themselves become displaced.
who faced job insecurity during this process experienced adverse health effects, both in terms of self-rated health measures and clinical symptoms. Furthermore, the mem-bers of the department directly threatened by job loss due to privatization went from a position of advantage or no difference in health status (prior to the ‘‘announce-ment’’ of the threat) to a significant disadvantage. Similar results are gathered from a number of Finnish municipalities, which during the large recession in the 1990s went through downsizing processes of varying degrees (Vahtera et al. 2000; Kivima¨ki et al. 2000; Kivima¨ki et al. 2001; Vahtera et al. 2004; Vahtera et al. 2005). Down-sizing turned out to be a risk factor for cardiovascular and musculoskeletal diseases as well as for subsequent disability pension, even for individuals who remained in employment.
Although there seems to be a negative causal relationship between job insecurity and health, it is not necessarily the case that increased job insecurity also leads to higher rates of sickness absence. The reason for this ambiguity is that job insecurity also acts as a disciplinary device, such that more insecurity yields less absence for a given health condition. According to the Finnish evidence, there is a significant pos-itive association between the degree of downsizing and sickness absence among permanent employees, but not among temporary employees (Vahtera et al. 2004). Hence, if the threat of direct job loss is sufficiently large, the disciplinary effects may neutralize or dominate the health effects. The Whitehall study also offers some evidence in that direction. Individuals affected by general organizational changes had a rise in sickness absence, whereas those facing imminent privatization of their de-partment had a decline (Ferrie 2001).
There is some recent empirical evidence based on U.S. data that apparently does not fit the picture of job insecurity adversely affecting health: Ruhm (2000; 2003) shows that there is a significant countercyclical variation in physical health, and that mortality rates correlate negatively with the rate of unemployment. However, aggre-gate economic fluctuations may affect health indicators differently than idiosyncratic shocks, as stigma associated with being out of work diminishes during bad times, and social networks to a larger extent move outside the workplaces; see, for example, Kelvin and Jarret (1985). Moreover, economic downturns typically do not threaten the job security of the majority of the population, hence adverse health effects for those directly affected may be counteracted by lower workloads and healthier life-styles for those who remain in secure employment (Ruhm 2005). There is also evi-dence that mental health as opposed to physical health varies procyclically (Ruhm 2003).
III. The Data: Employment, Welfare Dependency, and
Workplace Characteristics
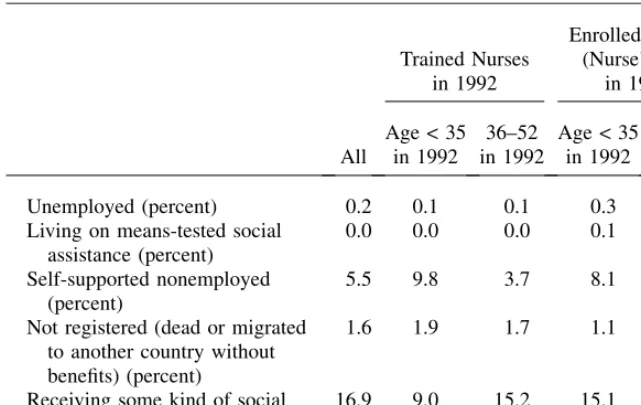
all permanent-contract employees.4Starting in October 1992, these individuals are monitored by the end of each month during the subsequent eight years. Descriptive statistics are provided in Table 1. There are 43,167 individuals included in the anal-ysis, of whom more than 95 percent are female. Half of the nurses are trained; that is, they have at least three years of college education. The rest are enrolled nurses, with vocational high-school education. Part I of Table 1 depicts the distribution of labor market positions at the time of sampling. All individuals are employed at this point (by construction of the data set), but the average number of contracted working hours is only 74 percent of the full-time equivalent.5Among young nurses there is also a substantial absence due to parental leave. Absence due to long-term sickness (more than 16 working days) is around 5 percent for the remaining trained nurses, and 7 per-cent for enrolled nurses. Part II of the table shows the distribution of labor market states for the same group of individuals exactly eight years later. More than 80 per-cent of the nurses are still in self-supporting work and most of them remain employed in healthcare or social services. There is, however, a sizable fraction of long-term sickness absence in 2000 (9.2 percent), particularly among the nurses who stayed on in these sectors. The absence level is much lower among nurses who switched to another sector of the economy (5.3 percent). A point worth noting is that this ap-parently cannot be explained by nonrandom selection. On the contrary, nurses who left had on average a higher level of sickness absence back in 1992 than those who remained in the healthcare or social services sectors (not shown in the table).
As indicated in the last row of Table 1, 16.9 percent of the individuals in our sam-ple received some kind of income support from the social security system by the end of October 2000. Approximately half of them (8.8 percent) received a lasting benefit, meaning a disability pension or a rehabilitation transfer. Layoffs seem to be rare among nurses in the public sector, and only two per thousand nurses claimed unem-ployment benefits.
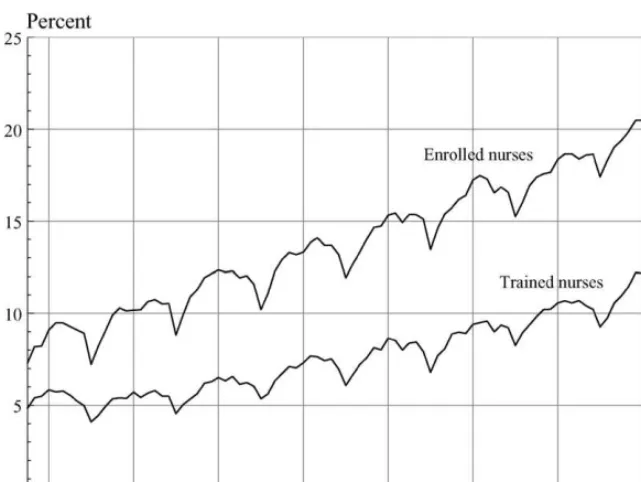
The overall rates of welfare dependency were much higher for enrolled nurses (21 percent) than for trained nurses (12 percent). Figure 2 provides a summary descrip-tion of how these fracdescrip-tions evolved over time for our analysis populadescrip-tion. As we have conditioned on participation in the labor force to start with, and since the average age of the analysis population increases with calendar time, it is of course not surprising that these curves indicate rising social insurance dependency. The rate of increase seems to be relatively stable over time, but with a strong seasonal pattern (the season-ality is primarily in sickness absence).
By merging the event histories of the individuals with other administrative regis-ters, we have been able to extract information about the workplaces, the municipal-ities/counties responsible for running them, and the local labor market conditions; see Table 2 for some selected descriptive statistics. In the remainder of this section, we discuss some features of these data that are of interest with respect to identifying the causal impact of organizational change on individuals’ absence and exit behavior.
4. Our data source distinguishes between short-term contracts (less than six months) and long-term con-tracts. We assume that the latter are permanent if they also contain a clearly defined regular working time (to avoid ‘‘semi-permanent’’ substitute workers).
Table 1
Population under study. Descriptive statistics.
All
Number of individuals 43,167 9,905 12,112 6,412 14,868
Mean age in 1992 (years) 38.0 30.0 42.6 30.0 43.1
Females (percent) 95.4 93.1 94.6 96.4 97.2
I. Status at the end of October 1992 Mean number of contracted working
hours relative to full time position (percent)
74.2 79.1 77.9 66.7 71.2
Working in hospitals (percent) 42.0 64.3 58.9 14.8 25.3
Working in nursing homes (percent) 35.8 17.5 21.6 59.1 49.4 Working in psychiatric institutions
(percent)
6.2 4.5 6.1 6.9 7.2
Working in community nursing (percent)
16.0 13.7 13.4 19.2 18.3
Absent due to parental leave (percent) 3.6 8.5 1.1 7.2 0.7 Fraction of remaining workers absent
due to long-term sickness (percent)a
6.1 5.3 4.7 7.2 7.3
II. Status at the end of October 2000 Still working without income support,
in the health-care and social service sector (percent)
81.0 81.1 83.4 79.9 79.6
Out of which absent due to parental leave (percent)
0.8 2.0 0.0 2.0 0.0
Fraction of remaining workers absent due to long-term sickness (percent)a
9.2 6.7 8.4 9.0 11.6
Still working without income support, but in another sector of the economy (percent)
2.9 4.1 3.5 3.2 1.5
Out of which absent due to parental leave (percent)
0.8 1.5 0.0 1.9 0.0
Fraction of remaining workers absent due to sickness (percent)a
5.3 4.2 4.5 5.5 8.6
Fully disabled (percent) 3.4 0.6 2.9 1.7 6.4
Partly disabled (percent) 2.5 0.5 2.6 1.1 4.3
A full list of the explanatory variables that we actually use in the analysis is pre-sented in the next section, after we have set up the statistical model.
Our key indicators for organizational change at workplaces are incidences of large observed changes in the overall number of nursing man-years and (with some reser-vations explained below) large turnovers of the nursing staff. These variables are both calculated from employment records in October each year. Letnjsbe the
num-ber of nurses at workplacejby the end of October in years,and letnjsbe the
cor-responding total number of man-years (the full-time equivalent ofnjs).6Furthermore,
letinjsbe the number of new nurses in years(those who were not employed at the
workplace in years-1) and letoutjsbe the number of nurses who have left the
work-place (those who were employed in year s-1, but not ins). We then define employ-ment growth in year s as ðnjsnjs1Þ=njs1 and turnover as minðinjs;outjsÞ=njs1. (Turnover thus measures the fraction of employees that are ‘‘reshuffled,’’ that is, the fraction of initial employees replaced by new ones.) Table 2 shows that the pace of organizational change increased somewhat during the period considered in this pa-per, both in terms of downsizing and in terms of turnover. It also shows that this was not primarily a result of general economic cutbacks. Both expenditures and incomes increased more at the end of the data-period than in the beginning, and the unem-ployment rate (the definition of which is explained below) among all Norwegian Table 1 (continued)
All
Trained Nurses in 1992
Enrolled Nurses (Nurse’s aid)
in 1992 Age < 35
in 1992
36–52 in 1992
Age < 35 in 1992
36–52 in 1992
Unemployed (percent) 0.2 0.1 0.1 0.3 0.2
Living on means-tested social assistance (percent)
0.0 0.0 0.0 0.1 0.1
Self-supported nonemployed (percent)
5.5 9.8 3.7 8.1 2.9
Not registered (dead or migrated to another country without benefits) (percent)
1.6 1.9 1.7 1.1 1.4
Receiving some kind of social security benefit (including sickness benefits) (percent)
16.9 9.0 15.2 15.1 24.2
a. Long-term sickness is defined as having been absent from work for at least 16 working days. Shorter absence spells are not recorded in administrative registers as they are not paid for by the National Insurance Administration (but by the employer).
nurses fell from the already low level of 3.3 percent in 1992–95 to 1.6 percent in 1996–2000.
In the empirical analysis, we are particularly concerned with the impact of orga-nizational changes that involve a substantive element of downsizing. Despite the rel-atively strong growth in the hospital and nursing sectors from 1992 to 2000 (2.7 percent growth in the number of man-years per year), Table 2 shows that a number of workplaces reduced their staff. During the entire estimation period, 14 percent of the nurses in our study experienced a downsizing of their workplace by more than 20 percent of the man-years, and 36 percent experienced a downsizing by more than 10 percent (these numbers are not shown in the table). Downsizings within nursing homes and community nursing were typically linked to substantial reductions in the municipality’s entire nursing staff, indicating that these organizational changes were driven by the need to cut overall costs in the municipalities. Downsizings within hospitals and psychiatric institutions on the other hand, were to a much larger extent driven by reallocation of the jobs: in the hospital sector from small (and local) to large hospitals, and in the psychiatry sector from institutions to outpatient clinics. The combination of high employment growth and the strong employment protection in this part of the economy implies that downsizings are typically implemented with-out layoffs. Instead, some employees are transferred to alternative workplaces within the county/municipality. When this has to be done involuntarily, the seniority Figure 2
principle is normally applied, other things equal. The typical situation, however, is that ‘‘other things’’ are not equal, as downsizings often involve transfers/closures of whole units or the elimination of particular functions. Hence, it is difficult to iden-tify the most affected workers, other than through actually observed transitions. Some employees may also be pressured by the management to quit ‘‘voluntarily,’’ to claim sickness benefits, or to apply for disability pension. A possible side effect Table 2
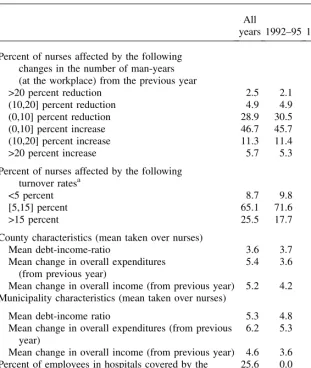
The work environment: Selected characteristics of workplaces, employers and local labor markets; by October Each Year
All
years 1992–95 1996–2000 Percent of nurses affected by the following
changes in the number of man-years (at the workplace) from the previous year
>20 percent reduction 2.5 2.1 2.9
(10,20] percent reduction 4.9 4.9 5.0
(0,10] percent reduction 28.9 30.5 27.1
(0,10] percent increase 46.7 45.7 47.8
(10,20] percent increase 11.3 11.4 11.1
>20 percent increase 5.7 5.3 6.2
Percent of nurses affected by the following turnover ratesa
<5 percent 8.7 9.8 7.5
[5,15] percent 65.1 71.6 57.4
>15 percent 25.5 17.7 34.7
County characteristics (mean taken over nurses)
Mean debt-income-ratio 3.6 3.7 3.5
Mean change in overall expenditures (from previous year)
5.4 3.6 7.7
Mean change in overall income (from previous year) 5.2 4.2 6.4 Municipality characteristics (mean taken over nurses)
Mean debt-income ratio 5.3 4.8 5.7
Mean change in overall expenditures (from previous year)
6.2 5.3 7.3
Mean change in overall income (from previous year) 4.6 3.6 5.8 Percent of employees in hospitals covered by the
pay-per-treatment regime
25.6 0.0 64.9
Mean local nurse unemployment rate (mean taken over nurses)
2.5 3.3 1.6
of the strong protection against layoffs is that health-related benefits to some extent substitute for unemployment benefits.
While we consider changes in the overall number of nursing man-years to be exog-enous with respect to the employment behavior of each nurse, this is obviously not the case for the turnover variable (since each nurse’s quit behavior affects the turnover). In the statistical model, we handle this problem by restricting our indicator of large turnover to affect individual behavior with a time lag. Large turnover clearly does not always reflect organizational changes. It may result from any source of employee dissatisfaction and/or from particularly good alternative employment opportunities.
Organizational changes at a workplace do not necessarily lead to immediate and visible changes in the staffing. In the hospital sector, for example, we suspect that increased competitive pressures were generated by a reform in the hospital financing system, from fully exogenous budgets to gradually increasing elements of the pay-per-treatment principle. The reform was introduced in July 1997 in 15 of Norway’s 19 counties (covering 75 percent of the hospital-based nurses in our data). The remaining four counties followed suit, two of them as early as in January 1998 (rais-ing the share of affected hospital nurses to 92 percent), one in January 1999 (rais(rais-ing it to 97 percent), and the last one in January 2000. The purpose of the reform was primarily to provide incentives for increased output (such as more surgical opera-tions), not to cut public health spending. Hence, it typically did not result in down-sizing. Because the reform was implemented in a staggered fashion, it is possible to identify its causal effect on sickness absence and welfare dependency without relying on calendar time or fixed county differences, provided that the staggered introduction was exogenous. A possible reason to suspect endogenous introduction is that coun-ties with highly efficient hospitals had stronger incentives to implement the reform quickly than counties with less efficient hospitals. However, a recent study of tech-nical efficiency in the Norwegian hospital sector found that there were no ex ante differences in efficiency between the early and late implementers of the reform (Biørnet al. 2003, p. 281). The main reason why some counties decided to wait was that they wanted more discretionary control over medical priorities.
admittedly limited, however, as they are few and relatively small, and employ only 0.6 percent of the nurses in our study (around 240 persons).
Finally, we have collected (imperfect) information about the cost efficiency of the municipalities’ nursing sector and their privatization strategies. The efficiency score measures are collected from Erlandsen et al. (1997) and Edvardsen, Førsund, and Aas (2000). They refer to two different points in time (1995 and 1997) and are based on detailed accounts of costs and output in the nursing sector of each municipality. The scores are computed by means of Data Envelopment Analysis (DEA), and, in short, a municipality is considered to be fully efficient in the year under consider-ation if no convex combinconsider-ation of other municipalities exists that produces more care services along all product dimension, without also using more of at least some inputs. Our privatization indicator is collected from the so-called KOSTRA database (ad-ministered by Statistics Norway), and measures for each municipality in Norway the fraction of total social service expenditures that were allocated through private companies in 2003. Although both efficiency scores and privatization indicators are measured with substantial errors (both because these concepts are difficult to measure per se, and because they are measured for just a few years, one of them well outside our observation window), we believe they may provide some information re-garding the reform-strategies that were pursued during the 1990s, and hence the pace of organizational change.
In addition to identifying the behavioral effects of organizational change, we also wish to examine the possible impact of labor market tightness on the nurses’ employ-ment and absence behavior. Because the nurses in our study typically enjoy very strong employment protection, we expect discipline effects related to changes in labor market tightness to be moderate, perhaps with an exception for nurses with relatively small part time jobs (who might be underemployed). Unfortunately, the standard local unemployment rates do not represent the employment opportunities of nurses very well. We have therefore computed monthly county-specific unemploy-ment rates for nurses in Norway particularly for the current project, based on the whole population of certified nurses in Norway (not only the permanent contract nurses covered in our analysis). These unemployment rates cover all kinds of unem-ployment registered at the emunem-ployment offices.
IV. The Model: The Dynamics of Absence and Welfare
Dependency
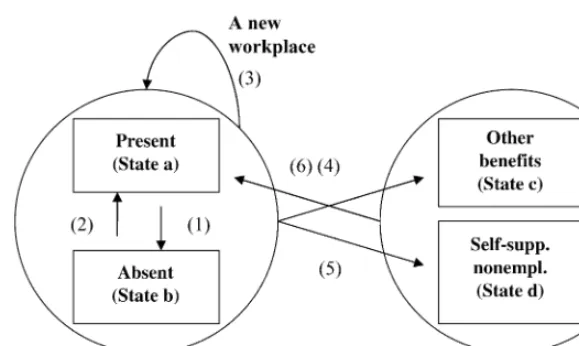
In this section, we set up a competing risks hazard rate model aimed at uncovering the causal effects of organizational change on the propensity to be-come and remain absent, and to bebe-come dependent on social insurance on a more lasting basis. The model is set up in terms of monthly transition probabilities between various labor market states, conditioned on vectors of observed and unobserved ex-planatory variables. Individuals can move among four mutually exclusive states:
(b) Absent from work with sickness benefits from the NIA.
(c) Nonemployed (or partly employed) with social security benefits (unemploy-ment benefits, rehabilitation benefits, disability benefits, social assistance). (d) Nonemployed without social security benefits.
In addition, individuals are allowed to movebetween different workplaces(given that they are in Stateaorb). To start with (October 1992), all individuals belong to one of the first two states; they are either present at work (Statea), or absent due to sickness (Stateb). Hence, the first part of our model is a binomial probability equa-tion determining the initial state. In the subsequent months, transiequa-tions may occur. Lett=1,2,.,97 be the 97 months for which we can (potentially) observe labor mar-ket states, wheret=1 is the first month (October 1992). A transition is recorded when-ever the state (or workplace) by the end of one month is different from the state (or workplace) by the end of the previous month. In total, our state space allows for 13 different transition types (12 between the four states described above and one be-tween different workplaces). However, in order to arrive at a tractable and econom-ically interpretable model, we restrict some transitionswith a common destinationto be governed by the same causal mechanisms regardless of the current state. In par-ticular, we assume that both observed and unobserved covariates have the same ef-fect on the hazard rates to the two nonemployment States (candd) regardless of the current state being presence (Statea) or absence (State b). However, sickness ab-sence is allowed to cause duration-dependent shifts in the levels of the hazard rates. These effects are modeled by means of a timing-of-events approach (Abbring and Van den Berg 2003a), implying that we do not need exclusion restrictions in order to identify the causal effects of interest.7 In a similar fashion, we assume that ob-served and unobob-served covariates have the same effect on the hazard rates from non-employment and back to work presence, regardless of the current state being other benefits (State c) or self-supported nonemployment (Stated). However, the level of the hazard rate may depend on whether the original exit involved a lasting benefit or not. We do not model transitions between the two nonemployment States (cand d); such transitions are only imperfectly observed and disregarded in the analysis. Note also that we rule out transitions from the two nonemployment states directly to sickness absence (from Statecordto Stateb). To the extent that such transitions occur in the data, we interpret the sickness spell as a continuation of the nonemploy-ment spell until work presence (Statea) occurs. Based on these considerations, we end up with the following distinct modeled transitions [the number of transitions actually occurring in the data set in brackets]:
Transition 1: From work presence (Statea) to long-term sickness absence (Stateb) [73,493]
Transition 2: From long-term sickness absence (Stateb) to work presence (Statea) [61,450]
Transition 3: From a job at one workplace (State aor b) to another workplace [20,683]
Transition 4: From a job (Stateaorb) to nonemployment benefits (Statec) [7,486] Transition 5: From a job (Stateaorb) to self-supported nonemployment (Stated)
[6,617]
Transition 6: From nonemployment (Statecor d) back to a job (Statea) [7,576] The transition pattern is illustrated in Figure 3. Individuals are included in the data set as long as they do not make a transition to a job outside the workplaces covered by our longitudinal data (in which case the spells are censored after the recording of Transition 3). Spells are also exogenously censored for nurses who give birth to a child, leave the country, or die. As and when these individuals return to the covered workplaces, their spells are reactivated.
The hazard rates are assumed to depend on six groups of covariates; (i) calendar time (t); (ii) individual and environmental characteristics (xit); (iii) municipality/
county characteristics (mit); (iv) workplace characteristics (zit); (v) duration of an
on-going sickness absence spell (dit); and (vi) unobserved individual (time-invariant)
characteristics (vi). The explanatory factors are allowed to vary between months
(except unobserved characteristics), but are assumed to be constant within months. The hazard rates are specified within the framework of a multivariate mixed propor-tional hazard rate model (MMPH); see Abbring and Van den Berg (2003a; 2003b). Figure 3
The modeled transitions (State a). The group ‘‘Not Employed’’ includes some individuals who have become partly disabled, and have some (part-time) employment (these are placed in the ‘‘other benefits’’ category).
Let ukðwkit;viÞbe the hazard rate governing transitions to state k, given an index
value computed from observed covariates and model parameterswkit, and an
un-observed (time-invariant) covariate vki. We specify the hazards in the following
way:
The exponential link-function in Equation 1 is used to ensure nonnegativity of the hazards uk without constraining the permitted space for the parameters of
inter-estðbk;rkt;lkd;ak;dkÞ. Note that since all explanatory variables and parameters
are assumed constant within each month, the hazards in Equation 1 can also be inter-preted as integrated over these months. The parametersrktandlkd are the calendar
time and duration effects, represented in the empirical model for transitions 1–6 by separate dummy variables, one for each calendar month, and one for each possible sickness absence duration. For transition 6 (from nonemployment and back to work), more restrictive assumptions are required to estimate the model, given the much smaller number of observations (the calendar time effects are assumed to be zero and the duration effects are constrained to be piecewise constant in four-month peri-ods). The initial condition is modeled in terms of a probability functionl(.). Lety0ibe
an indicator variable taking the value1if individualiwas absent from work (due to sickness) by the end of October 1992, and0otherwise. We then write the initial con-dition equation as
Letykit2Yibe equal to 1 if monthtinvolved a transition to statekfor individuali,
and0otherwise, where Yiis the complete set of observed transition outcome
indi-cators for individuali. LetKit be the set of feasible transitions for individuali in
month t; Kit¼f2;3;4;5g for individuals absent from work due to sickness,
Kit¼f1;3;4;5gfor individuals present at work, andKit¼f g6 for individuals
with-out a job. We can then write the likelihood contribution formed by individuali, con-ditional on index functions for all relevantk andtðwiÞand on the six-dimensional
vector of unobserved variablesðvi¼ ðv0i;v1i;v2i;v3i;v4i;v5i;v6iÞÞas
P2ðwi;viÞ ¼1exp + k2Kit
ukðwkit;vkiÞ
!
is the probability of making any of the available transitions inKit, and
P3ðwi;viÞ ¼
ukðwkit;vkiÞ
+
j2Kit
ujðwkit;vkiÞ
is the conditional probability that the transition is of typek.8
Because the likelihood contribution in Equation 3 contains unobserved variables, it cannot be used directly for estimation purposes. We approximate the unobserved joint heterogeneity distribution in a nonparametric fashion with the aid of a discrete distribution. LetQbe the (a priori unknown) number of support points in this distri-bution and letfvl;plg;l¼1;2; :::Q;be the associated location vectors and
probabil-ities. In terms of observed variables, the likelihood function is then given as
ð4Þ L¼Y
To estimate the model, we also have to specify a functional form for the initial condition probability function l(.) in Equation 2. For computational convenience, we have chosen to specify it as a complementary log-log function, that is, lð:Þ ¼1expðexpð:ÞÞ.9 Our estimation procedure is to maximize the likelihood function in Equation 4 with respect to all the model and heterogeneity parameters repeatedly for alternative values ofQ. The nonparametric maximum likelihood es-timators (NPMLE) are obtained by starting out with Q = 1, and then expanding the model with new support points until the model is ‘‘saturated’’ in the sense that it is no longer possible to increase the likelihood function by adding more points (Lindsay 1983; Heckman and Singer 1984). At each stage of the estimation process, we examine the appropriateness of an additional mass-point by means of simulated annealing (Goffe, Ferrier, and Rogers 1994).10Monte Carlo evidence presented in Gaure, Røed, and Zhang (2005) indicates that there is little reason to believe that pa-rameter estimates obtained this way are inconsistent or that they are nonnormally 8. The probability of making a transition to statekbetween(t-1)andt, given the feasible set of transitions K(and given that hazard rates are assumed constant within each month), can then be derived as
Zt
distributed. They also indicate that the standard errors conditional on the optimal number of support points are also valid for NPMLE.
A complete list of observed explanatory variables used in each of the seven equa-tions (the initial condition and the six hazard rates) is provided in Table 3.11Note that changes in the level of workplace employment are allowed to have three different types of effects on the various hazard rates in our model. First, current (ongoing) changes in the employment level potentially affects all hazard rates; to sickness absence (and back again), to other jobs, and to nonemployment (with or without benefits).12Second, some of these effects may persist after the changes are imple-mented. We allow these ‘‘lag-effects’’ to last for one year after implementation, and also to differ between ‘‘survivors’’ (those who stay at the same workplace after the changes) and ‘‘movers’’ (those who change to a new workplace, for example, as a result of downsizing). Third, we may expect that the conditions (in terms of employ-ment changes) under which some nurses leave employemploy-ment (that is, make a transition of Type 4 or 5) have a causal impact on their propensity to return to work. Note that effects of downsizing on sickness absence behavior do not necessarily reflect effects on individuals’ health; see Section II. They also may reflect effects on the threshold at which a given health status is deemed to justify sickness absence and on the extent to which sickness is untruthfully reported to conceal other reasons for absence.13It is not obvious whether such effects contribute to a positive or a negative relationship between downsizing and absence. While the disciplinary effects of the downsizing process may contribute to a negative relationship (Barmby, Sessions, and Treble 1994), reduced loyalty/commitment and higher workload may contribute to a positive rela-tionship (Armstrong-Stassen 2004; Greenglass and Burke 2001).
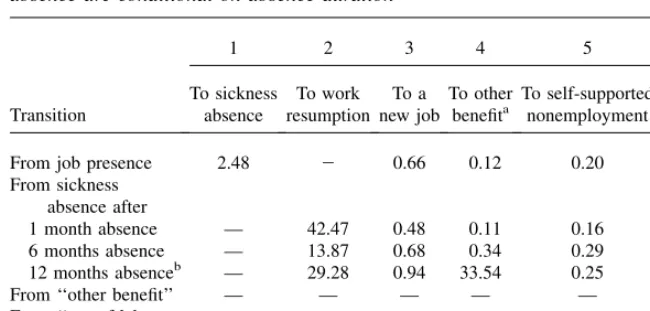
In order to interpret the estimation results that we present in the next section, note that exp(parameter3variable) enters into the various hazard functions as proportion-ality terms. This implies that that the exponential function of a parameter attached to a dummy variable measures the hazard rate for an observation with the corresponding dummy equal to 1, relative to an individual belonging to the reference group (with the appropriate dummy variables set to zero), ceteris paribus. The substantive significance of a given relative change depends on the level of the hazard to start with. To facilitate correct interpretation of our estimation results, we therefore present in Table 4 an overview of the monthly transition rates actually observed in the data. On average, 2.5 percent of the nurses make a transition from presence to long-term sickness ab-sence every month. Most of them (42.5 percent) return to work-preab-sence the month after. Monthly transition probabilities to ‘‘other benefit’’ and to self-supported nonem-ployment are typically very small (below 0.5 percent), except at the end of the max-imum sickness absence period where a large fraction transits to ‘‘other benefit.’’
11. We also have estimated a version of the model in which all time-constant workplace characteristics are replaced by workplace fixed effects in Transitions 1 and 2; that is, 1,227 workplace dummy variables. We return to this issue at the end of the results section (Section V).
12. Because employment is measured yearly (based on October records each year), these variables are con-stant (at the workplace level) in 12-month periods; that is, the ‘‘ongoing employment change’’ from October in yeart-1 to October in yeartis assumed to affect the employees from November yeart-1 through October yeart.
Table 3
List of explanatory variables included in the initial conditions equation (IC) and in the hazard rates (1–6)
Variable Functional form/number of variables Included in
I. Individual explanatory variables and environmental characteristics (xit)
Gender One dummy variable IC, 1, 2, 3, 4, 5, 6
Age 38 dummy variables (<24, 24, 25, . . ., 60) IC, 1, 2, 3, 4, 5, 6
Education/position Four dummy variables (enrolled nurse, trained
nurse, trained nurse with additional specialized education, trained nurse in administrative position)
IC, 1, 2, 3, 4, 5, 6
Basic working time Three dummy variables (less then 50 percent,
50–80 percent, >80 percent)
IC, 1, 2, 3, 4, 5
Shift work Three dummy variables (shift, not shift, unknown) IC, 1, 2, 3, 4, 5
County 18 dummy variables, one for each county IC, 1, 2, 3, 4, 5
Single parent One dummy variable IC, 1, 2, 3, 4, 5
Children 0–6 One dummy for having children below six years IC, 1, 2, 3, 4, 5, 6
Children 6–12 One dummy for having children between six and 12 IC, 1, 2, 3, 4, 5, 6
Pregnancy Seven dummy variables (for 7,6,.,1 months left until
birth, respectively, plus one interaction term between a dummy for pregnancy and a linear time trend)
IC, 1, 2, 3, 4, 5
G.P. reform One dummy for nurses living in one of the four
municipalities that were subject to a G.P. panel doctor reform during the estimation period
1, 2, 3, 4, 5
Local unemployment rate for nurses
Three linear terms, one for each type of basic working time
IC, 1, 2, 3, 4, 5
II. Employer (municipality/county) characteristics (mit)
Debt by the end of previous year, relative to total incomes that year
Two linear terms, one for municipalities and one for counties
IC, 1, 2, 3, 4, 5a
The
Journal
of
Human
income and high income) Percentage change in tax and transfer
incomes previous year, relative to incomes the year before that
Two linear terms, one for municipalities and one for counties
IC, 1, 2, 3, 4, 5a
Very rich municipality One dummy for municipalities with pure rents from
natural resources above 10,000 NOK per inhabitant
IC, 1, 2, 3, 4, 5
Absolute majority of privatization-friendly political parties (H and F)
Two dummy variables (majority this period, majority this period, but not previous period)
IC, 1, 2, 3, 4, 5
Urbanity Three dummy variables for municipalities and three
dummy variables for counties
IC, 1, 2, 3, 4, 5
Small municipality One dummy for municipalities with less than
5,000 inhabitants
IC, 1, 2, 3, 4, 5
Efficiency score municipalities 1997/2000 Three dummy variables (fully efficient, medium
efficiency, low efficiency). 1997-score is attributed to observations before 1997, and 2000-score thereafter.
IC, 1, 2, 3, 4, 5
Degree of privatization in care sector, 2003 Three dummy variables (less than 1 percent, 1–20 percent, more than 20 percent)
IC, 1, 2, 3, 4, 5
III. Workplace characteristics (zit)
Type of workplace Four dummy variables (nursing home, community
nursing, psychiatric institution, somatic hospital)
IC, 1, 2, 3, 4, 5
Current change in the number of man-years (from the previous year to this year) (for Transition 6, values at the time when Transition 4 or 5 were made are used)
Six dummy variables (more than 20 percent reduction, 10–20 percent reduction, 0–10 percent reduction, 0–10 percent increase, 10–20 percent increase, more than 20 percent increase)
IC, 1, 2, 3, 4, 5, 6
Past change in the number of man-years at the current workplace for ‘‘stayers’’
Six dummy variables (more than 20 percent reduction, 10–20 percent reduction, 0–10 percent reduction, 0–10 percent increase, 10–20 percent increase, more than 20 percent increase)
IC, 1, 2, 3, 4, 5
(continued)
Røed
and
Fe
v
ang
Table 3 (continued)
Variable Functional form/number of variables Included in
Past change in the number of man-years at the previous workplace for job-changers
Six dummy variables (more than 20 percent reduction, 10–20 percent reduction, 0–10 percent reduction, 0–10 percent increase, 10–20 percent increase, more than 20 percent increase)
IC, 1, 2, 3, 4, 5
Newly hired Dummy indicating that a new job was started at
the current workplace less than 12 months ago
IC, 1, 2, 3, 4, 5
Turnover from the year before previous year to previous year
Three dummy variables (less than 5 percent turnover, 5–15 percent turnover, more than
15 percent turnover)
IC, 1, 2, 3, 4, 5
Number of nursing man-years Four linear terms, one for each type of workplace IC, 1, 2, 3, 4, 5
Pay-per-treatment in hospitals One dummy, indicating that the employer workplace
is currently part of the pay-per-treatment experiment
1, 2, 3, 4, 5
IV. Calendar time 97 dummy variables, one for each calendar month 1, 2, 3, 4, 5
V. Duration of sickness spells 13 dummy variables, one for not being absent due to sickness,
and one for each possible ongoing duration (1,2,.,12)
2, 3, 4, 5
VI. Duration without a job Four dummy variables (1–4, 5–8, 9–12, >12 months) 6
VII. Nonemployment status One dummy indicating nonemployment status
(with or without benefits)
6
VIII. Status before nonemployment One dummy indicating sickness absence prior to
transition to nonemployment
6
a. Variables dropped in the final model specifications due to lack of significant impacts for all transition
The
Journal
of
Human
The model we estimated ended up with as many as 51 support points in the discrete joint distribution of unobserved heterogeneity.14The estimated model contains a total of 1,656 estimated parameters. All the results are robust toward the exact number of support points. In fact, there were only small changes in the parameter estimates after the inclusion of 12–15 points (except in the heterogeneity distribution itself).
V. Results
Selected estimation results are presented in Table 5. A key result (see part I of the table) is that a large downsizing at a workplace not only causes a large increase in the job-to-job hazard, as excess workers are channeled into other jobs in the municipality/county, but also increases the still-remaining nurses’ probability of becoming absent due to sickness, to become dependent on other welfare transfers, and/or to pull out of the labor force. In particular, compared to a stable environment a downsizing exceeding 20 percent of the man-years is associated with a small, yet statistically significant rise in sickness absence for individuals still in employment at the downsizing workplace, in the form of an approximately 7 percent increase in the hazard into sickness absence and a 10 percent decline in the hazard out of sickness absence (point-estimates). The effects of large downsizings on the hazard into other forms of welfare dependency and on unsubsidized exits from the labor force are much larger in proportional terms than the effects on sickness absence, though from Table 4
Average observed monthly transition rates (percent) Transition rates from sickness absence are conditional on absence duration
Transition
1 2 3 4 5 6
To sickness absence
To work resumption
To a new job
To other benefita
To self-supported nonemployment
Back to work
From job presence 2.48 2 0.66 0.12 0.20 —
From sickness absence after
1 month absence — 42.47 0.48 0.11 0.16 —
6 months absence — 13.87 0.68 0.34 0.29 —
12 months absenceb — 29.28 0.94 33.54 0.25 —
From ‘‘other benefit’’ — — — — — 1.93
From ‘‘out of labor force’’
— — — — — 2.70
a. Approximately 75 percent of these transitions are to health-related (G. P. certified) benefits, such as rehabilitation and disability benefits. The rest are mainly transitions to unemployment benefits. b. Due to time aggregation, not all sickness spells are terminated after exactly 12 months.
Table 5
Selected parameter estimates (standard errors in parentheses)
Transitions
I. Workplace and employer characteristics Current changes in # man-labor years
at workplace (last observed change for transition 6)
(0,10] percent reduction 20.004
(0.010)
(0,10] percent increase Ref. Ref. Ref. Ref. Ref. Ref. Ref.
(10,20] percent increase 0.021
>20 percent increase 20.009
(0.018) Past downsizing >20 percent for
individuals still working at the same
workplace(ref¼(0,10] percent increase)
workplace(ref¼[0,10] percent increase)
[5,15] percent Ref. Ref. Ref. Ref. Ref. Ref.
>15 percent 0.027** Efficiency in the municipality’s care
sector according to DEA analysis, (see Section III)
Low efficiency Ref. Ref. Ref. Ref. Ref. Ref.
Privatization in municipality’s care sector in 2003 (percent of total expenditure)
More than 20 percent 0.119*
(0.051)
1–20 percent Ref. Ref. Ref. Ref. Ref. Ref.
Less than 1 percent 20.003
(0.020) Very rich municipality (due to ‘‘windfall gains’’
Table 5 (continued)
II. Labor market tightness for nurses
County unemployment3dummy for
less than 50 percent position
20.014
County unemployment3dummy for
50–80 percent position
County unemployment3dummy for
more than 80 percent position
20.022** III. Individual and job characteristics
Gender
Female Ref. Ref. Ref. Ref. Ref. Ref. Ref.
Male 20.408**
Enrolled nurse Ref. Ref. Ref. Ref. Ref. Ref. Ref.
Type of workplace
Nursing home (municipality) Ref. Ref. Ref. Ref. Ref. Ref.
Community nursing (municipality) 20.026
(0.017)
Psychiatric institution (county) 20.083*
(0.033)
$80 percent Ref. Ref. Ref. Ref. Ref. Ref.
Working shifts 0.114**
Having a child 0–6 0.078**
(0.018)
Having a child 7–12 0.044**
(0.014)
Being a single parent 0.144**
(0.041) Change in effect of pregnancy
Table 5 (continued)
Transitions
1 2 3 4 5 6 IC
To absence
To work resumption
To new job
To other benefit
To self-supported nonemployment
Back to work
Absent first month
IV Out-of-job situation Having a benefit (having made transition 4 rather than transition 5)
0.360** (0.083)
Absent prior to transition 4/5 0.029
(0.046) Duration without a job
1–4 months Ref.
5–8 months 0.042
(0.044)
9–12 months 0.325**
(0.049)
>12 months 0.095*
(0.041)
a. Past downsizing is defined at the individual level. For those who change workplaces, the dummy refers to a downsizing at the previous workplace (and hence may have been the reason for the change in workplace).
Note: *(**) indicates significance at the 5(1) percent level (in two-sided tests).
The
Journal
of
Human
a lower base (conf. the average transition rates in Table 4). A downsizing exceeding 20 percent of the employees yields around a 44 percent increase in the hazard to more lasting social insurance dependency (‘‘other benefit’’), and a 50 percent in-crease in the hazard to unsubsidized nonemployment. Having made a transition to ‘‘other benefit’’ or unsubsidized nonemployment, the fact that this happened during a downsizing process implies a 28 percent reduction in the hazard back to work.
Past (completed) downsizings apparently do not have statistically significant effects on the survivors other than an increase in the subsequent job-change hazard. However, even though each destination-specific effect is not significantly different from zero, all the point-estimates seem to indicate a reinforcement of the direct effects referred to above (the joint significance of all the downsizing effects is con-sidered below by means of simulation). Moreover, individuals who change work-places during the downsizing process have significantly higher hazard rates to ‘‘other benefit’’ during the subsequent year.
More moderate downsizing incidences (10–20 percent of the man-years) do not seem to affect sickness absence at all. They do, however, increase the hazard to ‘‘other benefits’’ by 20 percent and to ‘‘nonemployment without benefits’’ by 44 percent. Even more minor downsizing incidences (0–10 percent of the man-years) have no significant effects at all, except its trivial impact on the hazard to a new job. The potential turbulence created by ‘‘upsizing’’ also seems to have no significant effects on the transition pattern.
Parameter estimates measuring the proportional impact on the various hazard rates are not easily combined into a convenient summary measure. Hence, to assess the sub-stantive and statistical significance of the estimated downsizing effects, we provide a simulation exercise using the estimated model to simulate event histories, based on observed individual characteristics in October 1992 and drawings from the estimated distribution of unobserved heterogeneity. These simulations are produced under two alternative downsizing scenarios; (i) no downsizing at all (all employment changes are set to the reference level of 0–10 percent employment growth), and (ii) an initial downsizing of at least 20 percent from October 1992 to October 1993, and no employ-ment changes thereafter (that is, reference level only).15To obtain confidence inter-vals for our simulation results, we use a parametric bootstrap procedure that consists of making 100 drawings from the distribution of parameter estimates (based on the assumption of multivariate normality) and letting each drawing be used in a simulation exercise. The resultant 90 percent confidence intervals represent, at each point in time, the 6th and 95th percentile in the distribution of outcomes.16Figure 4
15. Because there are some events (such as pregnancy and maternity leave) and developments in time-varying covariates that are treated as exogenous in the model, the simulations cannot reproduce the real data perfectly. We are also unable to identify the new employer in cases of simulated job-to-job transitions. In the simulation we therefore assume that a job-to-job transition does not change the vector of employer characteristics.
16. Note that we make drawings from the vector of 1,249 parameters attached to observed covariates only, since the parameters describing the unobserved heterogeneity are not normally distributed; see Gaure, Røed, and Zhang (2005). We thus condition on the individual drawings of unobserved heterogeneity. The drawings of parameter estimates are made by means of the Cholesky decomposition; that is, letL be a lower triangular matrix, such that the covariance matrix isV¼LL9. Letzsbe a vector of 1,249
Figure 4
Simulated social insurance dependency rates without downsizing (upper panel) and changes as a result of an initial downsizing period (lasting from October 1992 to October 1993), followed by stability. Mean simulation results (based on 100 trials) with 90 percent confidence intervals.
Note: Social security dependency includes sickness benefits, rehabilitation benefits, disability benefits, social assistance, and unemployment benefits.
The
Journal
of
Human
illustrates the simulated impact of the initial one-year downsizing process for the nurses’ social insurance dependency rate over time. The upper panel plots the dicted dependency rates with no downsizing at all, while the lower panel plots the pre-dicted percentage change resulting from a once-and-for-all downsizing of more than 20 percent from October 1992 to October 1993 (with stable conditions thereafter). According to the mean simulation results, a downsizing process causes up to a 1.2 per-centage point (20 percent) increase in the social insurance dependency rate during the downsizing process. After the downsizing process is completed the effect on social insurance dependency gradually fades out, but it takes around four more years before it is no longer significantly different from zero. Figure 5 illustrates the corresponding impact on self-supported nonemployment. During the downsizing process, approxi-mately 1 percent of the nurses ‘‘voluntarily’’ pull out of the labor force as a direct re-sult of the downsizing process. This effect seems to be even more long lasting than the effect on social insurance dependency. Taken together, the two curves suggest that as a direct causal effect of a large downsizing process at a workplace between 1.5 and 3.0 percent (90 percent confidence interval) of the nurses belonging to the workplace to start with either become dependent of social security transfers or pull out of the labor force without benefits. Two years after the completion of the downsizing process the effect is reduced to between 0.8 and 1.8 percent. It takes as much as six years before the effects on social security dependence and nonemployment are no longer statisti-cally significant (not shown in the graphs).
These calculations are all partial, in the sense that all other explanatory variables are kept constant. We now take a brief look at the effects of other ‘‘pressure indica-tors,’’ with reference to estimates and standard errors reported in Table 5, Part I. Institutions that have gone through a period of significant staff reshuffling (a turnover of more than 15 percent) have higher hazard rates to all states (sickness absence, other jobs, ‘‘other benefit’’ and ‘‘unsubsidized nonemployment’’) than more stable institutions. A high level of privatization in a municipality’s social services (by 2003) and a high efficiency score for its care sector (see Section III) is associated with higher hazard rates into sickness absence, even when conditioned on downsiz-ing and turnover. The variables capturdownsiz-ing economic vigor in the municipality/county have small and statistically insignificant effects (and most of them were dropped in the final model specification; see Table 3). Interestingly, the only exception from this pattern is the exogenous windfall gain dummy variable (identifying municipalities with large rents from hydro power stations), which stands out with a significantly negative effect on the ‘‘other benefit’’ hazard.
The introduction of the pay-per-treatment reform in the hospital sector apparently did not affect the hazards into sickness absence or work resumption, but it quite sig-nificantly raised the hazards to ‘‘other benefit’’ and unsubsidized nonemployment while reducing the hazard rate into other jobs. Together, these findings suggest that the reform did not imply impaired job opportunities in general, but that it neverthe-less pushed some workers out of their jobs, partly on the NIA’s account.
Figure 5
Simulated rate of self-supported nonemployment without downsizing (upper panel) and changes as a result of an initial downsizing period (lasting from October 1992 to October 1993), followed by stability. Mean simulation results (based on 100 trials) with 90 percent confidence intervals.
The
Journal
of
Human
suggest that the unemployment effect on sickness absence for this group of workers is not primarily a discipline effect, but rather a workload (stress) effect, reflecting that very low unemployment among nurses implies a shortage of qualified labor in some institutions. This finding is in accordance with the more general evidence reported by Ruhm (2000; 2003) that unemployment correlates positively with health; see Section II). It is also consistent with the finding reported by Greenglass and Burke (2001) that a nurse’s workload is the most significant and consistent predictor of distress during restructuring processes.
The hazard rates strongly depend on the current state (present or absent) and on the duration of an ongoing sickness spell. This is illustrated for a typical nurse (de-fined such that the transition rates after one month of sickness match the correspond-ing data frequencies) in Figure 6. The work resumption hazard displays significant negative duration dependence until approximately nine months of sickness absence. However, as the moment of benefit exhaustion (after 12 months) approaches, there is a substantial increase in the work resumption hazard, leaving little doubt that eco-nomic incentives matter. The transition rate to other types of benefits is almost neg-ligible for nurses present at work and during most of a sickness absence spell as well. This illustrates that the typical path into long-lasting social insurance dependency goes through a one-year period of sickness absence.
We do not discuss the results regarding the impact of individual and job character-istics in any detail. But it is clear from the estimates reported in Part III of Table 5 that there are large differences in individual hazard rates according to education and job type. A point worth noting is that a lower position in the work hierarchy gives higher sickness absence and benefit hazards and a lower work resumption hazard. Although this clearly can be interpreted in more ways than one, the finding is in ac-cordance with a substantial body of medical research that has identified a strong so-cial gradient in individuals’ health status (see Marmot 2004 for a recent survey). Enrolled nurses are more absent than ordinary trained nurses who are more absent than specialized nurses. Nurses in nursing homes are much more absent than nurses in hospitals. There are also large differences in hazard rates according to gender, family situation, and age (not shown). Parents with small children, particularly single parents, have high hazard rates into sickness absence. Unsurprisingly, pregnant women also have high hazard rates into sickness absence, and the hazard increases strongly as the birth approaches (not shown). More interestingly, we find that the im-pact of pregnancy on the sickness absence hazard rate has increased significantly over time, suggesting either that it has become more difficult to be present at work with given health problems, or that the threshold for claiming benefits has been low-ered due to changes in social norms (Lindba¨ck 1995a; 1995b).17
The estimated discrete heterogeneity distribution has no direct convenient inter-pretation. However, Monte Carlo evidence reported by Gaure, Røed, and Zhang (2005) suggests that the first and second order moments tend to be consistently es-timated (albeit with large and unknown uncertainty). The correlation coefficients
Figure 6
Estimated transition probabilities, normalized such that the transition probabilities in the first sickness month correspond to the observed averages (with 90 percent point-wise confidence intervals). Note: Confidence intervals reflect statistical uncertainty in each of the two hazard rates separately.
The
Journal
of
Human
may be of some interest since they characterize the unobserved selection process into the various states. The correlation coefficients that can be derived from our multivar-iate 51-point distribution are presented in Table 6, and indicate for example that indi-viduals with a high unobserved absence propensity also have high ‘‘other benefit’’ and nonemployment propensities, and low work-resumption propensities during sickness absence and nonemployment. It may be noted that the signs of the correla-tion coefficients were robust with respect to the exact number of support points in the heterogeneity distribution. Table 6 also reports some summary statistics aimed at in-dicating the overall impact on unobserved covariates. Unobserved heterogeneity appears to account for a substantial fraction of the overall variance in predicted haz-ard rates. For some of the transitions it turns out that unobserved heterogeneity con-tributes more to this variance than observed characteristics do.
In order to evaluate the robustness of our main results with respect to workplace-specific effects, we have also estimated a version of the model where we for the two ‘‘main’’ transitions (from presence to absence and from absence to presence) replace all time-invariant workplace-specific covariates with a vector of workplace dummy variables (one dummy for each of the 1,227 workplaces represented in the data).18 This estimation was terminated at 19 support points in the heterogeneity distribution (to save on the high computational costs associated with estimating this model), after the parameters of interest had been stabilized. While the estimated negative effects of downsizing on the work-resumption propensity were virtually unchanged compared to our main results (and still highly significant), the effects on the hazard into sick-ness absence became weaker (and statistically insignificant). Hence, it seems that adverse effects of downsizing on sickness absenceduration are more robust than the effects on sickness absence incidence.19 The estimated effects of downsizing on the hazards to ‘‘other benefit’’ and unsubsidized nonemployment were not signif-icantly altered by the introduction of workplace-specific effects in the sickness ab-sence and the work-resumption hazards.
VI. Conclusion
In this paper we have traced the employment and benefit paths of nurses in Norway during 1992–2000 (given that they were employed at the start of this period), and investigated the extent to which institution-specific events, such as downsizings of the work force, have affected their propensity to claim social in-surance benefits and/or leave the labor force. Our results provide evidence that a large downsizing of the work force causes statistically significant increases in the employees’ nonemployment rates as well as in their propensity to claim sickness
18. It was not possible to introduce the same degree of flexibility in the other hazard equations, since a large fraction of workplaces did not experience the transitions in question at all. Hence, for these events, the model specification was the same as before. The estimated parameters in these hazards changed only marginally.
Table 6
Some Properties of the Distribution of Unobserved Heterogeneity
Coefficients of Variation
ffiffiffiffiffiffiffiffiffiffiffiffiffiffiffiffiffi
varðexpðvkiÞ
p EðexpðvkiÞ
Fraction of Variance in Hazard Rates Caused byvk a
Correlation coefficients corrðexpðvkiÞ;expðvjiÞÞ;k6¼j
To Work Resumption
To a New Job
To Other Benefit
To Self-Supported Nonemployment
Back to Work
Sickness Absence in First Month
To sickness absence 1.094 0.682 20.385 0.176 0.217 0.258 20.148 0.326 To work resumption 0.453 0.536 — 0.056 20.197 20.033 0.058 20.176
To a new job 1.390 0.403 — 0.025 0.275 0.193 0.074
To other benefit 5.568 0.019 — 0.148 20.030 0.115
To nonemployment 2.179 0.216 — 20.103 0.051
Back to work 1.226 0.820 — 20.069
Sickness absence in first month
4.799 — —
a. These fractions are based on a simulated data set with all explanatory variables set to their true values to start with. In contrast to the real data, only age and calendar time dummies are allowed to vary over time, hence the reported fractions probably exaggerate the relative impact of unobserved heterogeneity slightly. Letul;l¼1; :::;51
be the mean hazard rate within heterogeneity groupl, letplthe fraction of observations belonging to that group. Furthermore, letVarðulÞbe the variance in hazard rates
taken over all observations within groupj. The fraction of variance caused by unobserved heterogeneity is calculated as 1+lpl3VarðulÞ VarðulÞ .
The
Journal
of
Human