Študija primera razvoja podatkovnega skladišča za spremljanje porabe energije v javnih stavbah
Bebas
83
0
0
Teks penuh
(2)
(3) UNIVERZA V MARIBORU FAKULTETA ZA ELEKTROTEHNIKO, RAČUNALNIŠTVO IN INFORMATIKO. Goran Kovačić. CASE STUDY OF DATA WAREHOUSE DEVELOPMENT FOR MONITORING OF ENERGY CONSUMPTION IN PUBLIC BUILDINGS. Magistrsko delo. Maribor, junij 2016.
(4)
(5) CASE STUDY OF DATA WAREHOUSE DEVELOPMENT FOR MONITORING OF ENERGY CONSUMPTION IN PUBLIC BUILDINGS Študija primera razvoja podatkovnega skladišča za spremljanje porabe energije v javnih stavbah Magistrsko delo Student:. Goran Kovačić. Study programme:. 2nd Bologna degree – a Master's Programme Informatics and Technologies of Communication. Mentor:. Associate professor Dr. Boštjan Brumen. Editing:. Martina Mavrek, professor of English Language.
(6)
(7)
(8)
(9) ACKNOWLEDGEMENTS I would like to thank my mentor Dr. Boštjan Brumen for his guidance and help in writing this thesis.. I also thank my colleagues Dr. Vladimir Špišić and Kornelije Petak for their advices and support.. Special thanks goes to my family for their constant support and patience during all the years of studies..
(10)
(11) Študija primera razvoja podatkovnega skladišča za spremljanje porabe energije v javnih stavbah Ključne besede: podatkovno skladišče, dimenzijski model, zvezdna shema, snežinkasta shema, ETL proces UDK:. 004.658(043.2). Povzetek Sestavni del Energetskega informacijskega sistema (EIS), ki je bil razvit za kupca, je obsežen in dinamičen sistem poročanja. Ustvarjanje kompleksnih poročil ima velik vpliv na zmogljivost poslovne (transakcijske) podatkovne baze. Da bi se izognili obremenitvam nje, je bila uvedba podatkovnega skladišča logičen korak. Podatkovno skladišče je vrsta baze podatkov, ustvarjena s ciljem priprave podatkov za analizo in poročanje. Po pregledu literature na področju skladiščenja podatkov je bil naslednji korak v procesu implementacije podatkovnega skladišča oceniti potrebe in ugotoviti, kateri pristop razvoja izbrati. Po oceni zahtev, značilnosti sistema in tehnologij ter osebja, ki smo jih imeli na razpolago, je bila sprejeta odločitev, da bomo uporabili pristop, katerega zagovarja Ralph Kimball. Argumenti za to odločitev so podani v delu. Posledica Kimballovega pristopa je dimenzionalni model podatkovnega skladišča. Dimenzionalni model podatkovnega skladišča je lahko zasnovan na shemi v obliki zvezde ali snežinke. Po posvetovanju z dokumentacijo in sprejetjem mnenja članov naše skupine, smo se odločili, da bomo uporabljali zvezdno shemo. Vendar nam je inženirska radovednost dala idejo, da izvedemo študijo primera, v kateri bi primerjali izvajanje ETL (ExtractTransform-Load) procesa za implementacijo podatkovnega skladišča, zasnovanega na obeh shemi modela. V okviru študije primera smo implementirali dve različici podatkovnega skladišča, eno zasnovano na podlagi modela z zvezdasto shemo in drugo na podlagi modela sheme v obliki snežinke.. v.
(12) Cilj te raziskave je bil ugotoviti, katera izmed implementacij podatkovnega skladišča bo prinesla boljše rezultate v zvezi izvedbe procesa ETL. ETL je proces zajemanja, preoblikovanja in prenosa podatkov iz različnih virov v podatkovno skladišče. Po implementaciji smo opravili vrsto testov s ciljem ocenitve obeh različic podatkovnega skladišča. Merili smo trajanje ETL procesa in velikost podatkovne baze podatkovnega skladišča za različne velikosti operativne baze podatkov. Statistična analiza pridobljenih podatkov nam je omogočila podajanje odgovorov na naša raziskovalna vprašanja: . Raziskovalno vprašanje 1: Ali obstaja razlika v trajanju ETL procesa za različne velikosti operativne podatkovne baze, če primerjamo modele podatkovnega skladišča v obliki zvezde in snežinke?. . Raziskovalno vprašanje 2: Ali obstaja razlika v velikosti podatkovnega skladišča med implementacijo na podlagi sheme v obliki zvezde in snežinke?. . Raziskovalno vprašanje 3: Kako je trajanje ETL procesa odvisno od količine podatkov v operativni podatkovni bazi?. . Raziskovalno vprašanje 4: Kako je velikost podatkovnega skladišča odvisna od količine podatkov v operativni podatkovni bazi?. Rezultati statistične analize so pokazali, da je za opazovane scenarije implementacija, ki temelji na shemi snežinke, bolj uspešna - tako v krajšem času trajanja ETL procesa in manjši velikosti podatkovnega skladišča. Poleg tega smo ugotovili, da se odvisnost med velikostjo operativne baze podatkov in trajanja ETL procesa za obe izvedbi lahko enako dobro opišejo z linearnim in močnostnim regresijskim modelom.. vi.
(13) Case study of data warehouse development for monitoring of energy consumption in public buildings Key words: data warehouse, dimensional model, star schema, snowflake schema, ETL process UDK:. 004.658(043.2). Abstract. The goal of this case study was to examine which implementation of the data warehouse will yield better results in the observed scenario – monitoring of energy consumption in public buildings. Data warehouse (DW) is a type of database created with the goal of preparing data for analysis and reporting. We implemented two versions of DW, one based on the star and the other on the snowflake schema model. Series of tests were conducted to evaluate implemented solutions. Statistical analysis showed that for the observed scenarios, implementation based on snowflake schema performs better, in both shorter ETL execution time and smaller size of DW.. vii.
(14)
(15) TABLE OF CONTENTS 1. Introduction ............................................................................................................... 1 1.1. Domain ............................................................................................................... 1. 1.2. The purpose, goals and basic arguments ........................................................... 2. 1.2.1. 2. 1.3. Assumptions and limitations of the research ....................................................... 6. 1.4. Research methods.............................................................................................. 6. 1.5. Requirements ..................................................................................................... 7. 1.6. Content description ............................................................................................. 7. Data warehouse ........................................................................................................ 9 2.1. Data warehouse development approaches ........................................................11. 2.2. Components of a data warehouse .....................................................................12. 2.2.1. Data sources ..............................................................................................12. 2.2.2. Data staging area .......................................................................................13. 2.2.3. Data presentation .......................................................................................13. 2.2.4. Data access ................................................................................................14. 2.3 3. 4. Research questions and hypotheses ........................................................... 2. Dimensional data model ....................................................................................14. Case study ...............................................................................................................15 3.1. Choosing the approach ......................................................................................15. 3.2. Data warehouse development ...........................................................................17. 3.2.1. Source database ........................................................................................17. 3.2.2. Dimensional model design ..........................................................................18. 3.2.3. Dimensional model implementation ............................................................32. 3.2.4. ETL process implementation ......................................................................34. 3.3. Testing...............................................................................................................36. 3.4. Results ..............................................................................................................37. Hypotheses evaluation and conclusion ....................................................................41. viii.
(16) 4.1. RQ1: Is there a difference in the duration of ETL for a specific operational database. size when comparing star and snowflake schema model? ...........................................41 4.2. RQ2: Is there a difference in the size of DW between the star and snowflake. schema model for specific operational database size?.................................................45 4.3. RQ3 – How does the duration of the ETL process depend on the amount of data. in the operational database? ........................................................................................45 4.3.1. Regression analysis for the linear model ....................................................46. 4.3.2. Regression analysis for the power model ...................................................48. 4.3.3. Regression analysis for the exponential model ...........................................49. 4.4. RQ4 – How does DW size depend on the amount of data in the operational. database ......................................................................................................................52 5. Conclusions .............................................................................................................54. Literature .........................................................................................................................55 Apendix A ........................................................................................................................56. ix.
(17) LIST OF ABBREVIATIONS DW ETL OLAP OLTP SQL EF POCO. Data Warehouse Extract-Transform-Load On-Line Analytical Processing On-Line Transaction Processing Structured Query Language Entity Framework Plain Old CLR Object. x.
(18)
(19) LIST OF IMAGES Image 3.1: EIS operational database model ....................................................................17 Image 3.2: Model of entity's consumption fact table with its dimensions in star schema...21 Image 3.3: Model of customer's consumption fact table with its dimensions in star schema ........................................................................................................................................22 Image 3.4: Model of entity's consumption fact table with its dimensions in the snowflake schema ............................................................................................................................23 Image 3.5: Model of customer's consumption fact table with its dimensions in the snowflake schema ............................................................................................................................24 Image 3.6: DimensionDate POCO class in C# programing language ...............................33 Image 3.7: DimensionDate table in DW ...........................................................................34 Image 4.1: The average duration of the ETL process for both implementations ...............46 Image 4.2: Size of DW .....................................................................................................52. xi.
(20)
(21) LIST OF TABLES Table 2.1 Comparison of the essential features of Inmon's and Kimball's models ............11 Table 3.1: Specific characteristics in favour of Inmon's or Kimball's model ......................16 Table 3.2: Attributes of dimension DimensionEntity for star schema ................................25 Table 3.3: Attributes of dimension DimensionCustomer for star schema..........................26 Table 3.4: Attributes of dimension DimensionEnergySource for star schema ..................26 Table 3.5: Attributes of dimension DimensionEnergySource for star schema ..................26 Table 3.6: Attributes of dimension DimensionEnergySourceConsumption for star schema ........................................................................................................................................27 Table 3.7: Attributes of dimension DimensionMeasurementPoint for star schema ...........27 Table 3.8: Attributes of dimension DimensionServiceItem for star schema ......................27 Table 3.9: Attributes of dimension DimensionBill for star schema ....................................27 Table 3.10: Attributes of dimension DimensionBill for snowflake schema ........................28 Table 3.11: Attributes of dimension DimensionCustomer for snowflake schema ..............28 Table 3.12: Attributes of dimension DimensionCustomerSubtype for snowflake schema .28 Table 3.13: Attributes of dimension DimensionCustomerType for snowflake schema ......28 Table 3.14: Attributes of dimension DimensionDate for snowflake schema......................29 Table 3.15: Attributes of dimension DimensionEnergyEfficiencyClass for snowflake schema ........................................................................................................................................29 Table 3.16: Attributes of dimension DimensionEnergySource for snowflake schema .......29 Table 3.17: Attributes of dimension DimensionEnergySourceConsumption for snowflake schema ............................................................................................................................30 Table 3.18: Attributes of dimension DimensionEntity for snowflake schema ....................30 Table 3.19: Attributes of dimension DimensionEntityDetails for snowflake schema .........31 Table 3.20: Attributes of dimension DimensionEntityType for snowflake schema ............31 Table 3.21: Attributes of dimension DimensionMeasurementPoint for snowflake schema31 Table 3.22: Attributes of dimension DimensionServiceItem for snowflake schema ..........31 Table 3.23: Data sets used in tests ..................................................................................36 Table 3.24: Test result for the star schema model ETL process duration in seconds .......38 Table 3.25: Test result for the snowflake schema model ETL process duration in seconds ........................................................................................................................................39 Table 3.26: The size of star and snowflake schema DW ..................................................40 Table 4.1: Duration difference, in seconds, between both implementations .....................41 Table 4.2: Results of the Shapiro-Wilk test of normality for distribution of duration difference ........................................................................................................................................42. xii.
(22) Table 4.3: Results of the T-test on the process duration difference ..................................44 Table 4.4: The average duration and difference of the ETL process between both implementations...............................................................................................................44 Table 4.5: Results of the linear regression analysis .........................................................47 Table 4.6: Relusts of the power regression analysis ........................................................49 Table 4.7: Relusts of the exponential regression analysis ................................................50 Table 4.8: The coefficient of determination for linear, power and exponential regression model...............................................................................................................................51 Table 4.9: Results of the regression analysis for dependency between operational database size and DW size .............................................................................................................53. xiii.
(23) Case study of data warehouse development for monitoring of energy consumption in public buildings. 1 INTRODUCTION Information is an asset to any organization. Today, almost every organization uses database management systems to increase the value of their data. The corporate decisionmakers require access to all of the organization’s data at any level but as the amount of the data increases, it becomes harder to access it, because it may be in different formats, on different platforms, and resides in different structures. Organizations have to write and maintain several programs to consolidate data for analysis and reporting. This process is costly, inefficient and time consuming for an organization. Traditional database systems, called operational or transactional, do not satisfy the requirements for data analysis of the decision-making users. An operational database supports daily business operations and the primary concern of such a database is to ensure concurrent access and recovery techniques that guarantee data consistency. Operational databases contain detailed data and often do not include historical data. Since they are usually highly normalized1, they perform poorly for complex queries that need to join many relational tables or to aggregate large volumes of data. Data warehousing provides an excellent approach in transforming operational data into useful and reliable information to support the decision making process. It also provides the basis for data analysis techniques like data mining and multidimensional analysis. According to W.H. Inmon, “Data Warehousing (DW) is a subject-oriented, integrated, timevariant, and non-volatile collection of data in support of the management’s decision making process”. Data warehousing process contains extraction of data from heterogeneous data sources, cleaning, filtering and transforming data into a common structure and storing data in a structure that can be easily accessed and used for reporting and analysis purposes [8]. More detailed discussion of DW follows in chapter 2.. 1.1. Domain. Growing energy use raises concerns over supply difficulties, exhaustion of energy resources and environmental impact. Energy consumption is usually split into three main sectors: industry, transport and ‘other’, including agriculture, service sector and residential. Although this makes it considerably difficult to gather information about energy consumption. 1. Database normalization - The process of organizing the attributes and tables of a relational database to minimize data redundancy. Normalized database complies with normal forms.. 1.
(24) Case study of data warehouse development for monitoring of energy consumption in public buildings. generated by buildings, it is estimated that they account for 20-40% of the total energy consumption [9]. To efficiently manage requirements for energy and reduce building energy consumption, a quality insight into energy consumption is required. To improve energy consumption management and reduce both environmental impact and the financial cost of public building expenditures, the customer has decided to invest in a solution for monitoring energy consumption. Their request was to have the ability to monitor and analyse energy consumption by bringing together the data acquired from automated energy consumption measurement infrastructure and the data received from energy suppliers. The goal of software solution and its data monitoring and analysis abilities is to provide quality data on which the decision on energy savings measures can be made.. 1.2. The purpose, goals and basic arguments. The integral part of the energy consumption monitoring solution (EIS2) is data warehouse. Data warehouse provides an excellent approach in transforming operational data into useful and reliable information to support the decision making process. It also provides the basis for data analysis techniques like data mining and multidimensional analysis. The goal of this thesis is to examine which design schema will yield better results in real world scenarios regarding the performance of importing the data into the DW (performing the Extract-Transform-Load process). We can break down the main goal into these sub goals: . Design and implementation of data warehouses based on two different design schemas (star model and snowflake model). . Execution of performance tests. . Evaluation of the results. 1.2.1 Research questions and hypotheses Following research questions and hypotheses were formulated and will be accepted or rejected, depending on the test results:. 2. 2. EIS – Energetski informacijski sustav (Croatian) – Energy information system (English).
(25) Case study of data warehouse development for monitoring of energy consumption in public buildings. . RQ1 – Is there a difference in the duration of the ETL process for a specific operational database size when comparing the star and snowflake schema model? o. H10 – There is no difference in the duration of the ETL process between the star and snowflake schema model for the operational database containing 100.000 bill items.. o. H1a – There is a difference in the duration of the ETL process between the star and snowflake schema model for the operational database containing 100.000 bill items.. o. H20 – There is no difference in the duration of the ETL process between the star and snowflake schema model for the operational database containing 200.000 bill items.. o. H2a – There is a difference in the duration of the ETL process between the star and snowflake schema model for the operational database containing 200.000 bill items.. o. H30 – There is no difference in the duration of the ETL process between the star and snowflake schema model for the operational database containing 400.000 bill items.. o. H3a – There is a difference in the duration of the ETL process between the star and snowflake schema model for the operational database containing 400.000 bill items.. o. H40 – There is no difference in the duration of the ETL process between the star and snowflake schema model for the operational database containing 800.000 bill items.. o. H4a – There is a difference in the duration of the ETL process between the star and snowflake schema model for the operational database containing 800.000 bill items.. 3.
(26) Case study of data warehouse development for monitoring of energy consumption in public buildings. o. H50 – There is no difference in the duration of the ETL process between the star and snowflake schema model for the operational database containing 1.600.000 bill items.. o. H5a – There is a difference in the duration of the ETL process between the star and snowflake schema model for the operational database containing 1.600.000 bill items.. o. H60 – There is no difference in the duration of the ETL process between the star and snowflake schema model for the operational database containing 3.200.000 bill items.. o. H6a – There is a difference in the duration of the ETL process between the star and snowflake schema model for the operational database containing 3.200.000 bill items.. . RQ2 – Is there a difference in the size of DW between the star and snowflake schema model for specific operational database size?. . RQ3 – How does the duration of the ETL process depend on the amount of data in the operational database? o. H70 – Duration of the ETL process for DW based on the star schema model is linearly dependent on the amount of data in the operational database.. o. H7a – Duration of the ETL process for DW based on the star schema model is not linearly dependent on the amount of data in the operational database.. o. H80 – Duration of the ETL process for DW based on the snowflake schema model is linearly dependent on the amount of data in the operational database.. o. H8a – Duration of the ETL process for DW based on the snowflake schema model is not linearly dependent on the amount of data in the operational database.. 4.
(27) Case study of data warehouse development for monitoring of energy consumption in public buildings. o. H90 – Duration of the ETL process for DW based on the star schema model is power dependent on the amount of data in the operational database.. o. H9a – Duration of the ETL process for DW based on the star schema model is not power dependent on the amount of data in the operational database.. o. H100 – Duration of the ETL process for DW based on the snowflake schema model is power dependent on the amount of data in the operational database.. o. H10a – Duration of the ETL process for DW based on the snowflake schema model is not power dependent on the amount of data in the operational database.. o. H110 – Duration of the ETL process for DW based on the star schema model is exponentially dependent on the amount of data in the operational database.. o. H11a – Duration of the ETL process for DW based on the star schema model is not exponentially dependent on the amount of data in the operational database.. o. H120 – Duration of the ETL process for DW based on the snowflake schema model is exponentially dependent on the amount of data in the operational database.. o. H12a – Duration of ETL the process for DW based on the snowflake schema model is not exponentially dependent on the amount of data in the operational database.. . RQ4 – How does DW size depend on the amount of data in the operational database? o. H100 – Data warehouse size is linearly dependent on the amount of data in the operational database.. o. H10a – Data warehouse size is not linearly dependent on the amount of data in the operational database.. 5.
(28) Case study of data warehouse development for monitoring of energy consumption in public buildings. o. H110 – Data warehouse size duration is exponentially dependent on the amount of data in the operational database.. o. H11a – Data warehouse size duration is not exponentially dependent on the amount of data in the operational database.. o. H120 – Data warehouse size is power dependent on the amount of data in the operational database.. o. H12a – Data warehouse size is not power dependent on the amount of data in the operational database.. 1.3. Assumptions and limitations of the research. The research is based on the following assumptions: 1. Operational database of EIS is and will remain the only source database Limitations of the research: 1. Research was done without any previous experience in data warehousing 2. Data warehouses on both model schemas was developed using the same technology and software frameworks. The research ignored the influences of those technologies and frameworks on performance. 3. Data warehouse was implemented using following technologies: a. C#/.NET programming language b. Entity Framework object-relational mapping framework c. MS SQL database 4. The data model on which DW is based was defined in advance. 5. Test data made available for this study contained bills and related data for the timespan of 6 years, from 2010 to 2015, containing 173.914 bills with 3.216.855 bill items.. 1.4. Research methods. To evaluate DW Extract-Transform-Load process performance, a case study research was conducted.. 6.
(29) Case study of data warehouse development for monitoring of energy consumption in public buildings. Data acquired by conducting an experiment testing ETL process execution time was evaluated by using statistical methods. Hypotheses were tested using following statistical methods: 1. RQ1: The Shapiro-Wilk test for normality followed by the T-test or Wilcoxon test, depending on normality test results. 2. RQ2: Basic statistics. 3. RQ3: Regression analysis 4. RQ4: Regression analysis.. 1.5. Requirements. The customer ordered a software solution which will allow them to monitor the consumption of energy in public buildings and which would suggest savings measures to contribute to energy efficiency in each building. They would like to monitor the consumption of electrical and thermal energy, natural gas, light fuel oil, water and alike. As it regards the domain, water is also considered as an energy source. The customer wants to be able to perform a series of analyses and make reports regarding energy consumption. Because of the performance issues, reporting system needs to be able to access the data required to create a report without slowing down the operational database. Operational database holds the live data on which users perform actions by using client side web application. The reporting system should, on the other hand, use a different database, so that the operational database doesn’t get slowed down by time and resource demanding queries executed by the reporting system. As the response to this requirement, DW emerged as the potential solution.. 1.6. Content description. Introduction to the domain and goals of this case study are given in the first chapter. We defined the assumptions and limitations of the research, as well as the goals, research methods and requirements of the research. The second chapter summarizes the existing literature on DWs and introduces the DW development approaches.. 7.
(30) Case study of data warehouse development for monitoring of energy consumption in public buildings. In the third chapter, we described the conducted case study. This chapter includes the description of the implementation process and test procedure, and at the end, presents us with the test results. The fourth chapter contains the evaluation of the test results and presents the conclusions of this thesis. We conclude by examining possible areas for further study.. 8.
(31) Case study of data warehouse development for monitoring of energy consumption in public buildings. 2 DATA WAREHOUSE Data warehouse technology was formed as a response to business management and analysis needs. After the extraction of data from transactional systems to query-oriented databases, users are able to analyse the data of warehouses in real time, without affecting business operations [12]. Data warehouse is a type of database created with the goal of bringing together selected data from multiple heterogeneous databases and other information sources. A DW literally warehouses information about an organization or process and allows the extraction of meaningful, consistent and accurate data for analysis and decision making. Data is extracted from each of the sources, it is then filtered and transformed as needed, merged with data from other sources and then loaded into DW. The process of extracting data from sources, transforming it according to the DW data model and loading it into the DW is called Extract-Transform-Load (ETL) process. DW brings some advantages over the traditional approaches to the integration of multiple sources [13], which explains the growing interest of the industry for it: . The queries can be answered without accessing the original information sources (usually operational databases). In that way high query performance can be obtained for complex aggregation queries that are needed for in-depth analysis, decision support and data mining.. . On-Line Analytical Processing (OLAP) is decoupled as much as possible from OnLine Transaction Processing (OLTP). Therefore, the data is highly available and there is no interference of OLAP with local processing at the operational sources [11].. DW systems must structure data to be intuitive for decision makers to interactively analyse them by means of different techniques, such as OLAP or data mining, thus meeting their information needs. As it is also in our case, one of the most common customer’s requests that leads to DW development is the need of extensive report generation. When generating reports, it is of central importance for these systems to compute summaries of data in a simple and efficient way. In order to do this, DWs organize data according to the multidimensional model. In the multidimensional model, dimensions reflect the perspectives from which facts are viewed. Facts correspond to events which are usually. 9.
(32) Case study of data warehouse development for monitoring of energy consumption in public buildings. associated to numeric values known as measures, and are referenced using the dimension elements [3]. Design methods of traditional database design have clearly defined goals. Those methods define the design process as a series of steps during which a conceptual design phase is performed. The results of this phase are transformed into a logical model as the basis of schema implementation. As mentioned before, these methods have clearly defined goals, such as minimality in resulting schemas, freedom from redundancy, completeness in regard of coverage of the underlying application, etc. Some of these requirements can be made precise, like understanding the reasons for redundancies in database relations provided by the rational dependency theory. This theory also formalizes normal forms and normalization as a way to avoid them. There are even algorithmic approaches forms constructing normalized schemas [4, 10]. When this is compared to DW, there are at least two important differences [7]: . First, a DW integrates the information provided by a number of pre-existing source.. . Second, DWs are used for analysis and decision making purposes, usually for OLAP, where complex queries frequently compute aggregate values over huge amounts of data, while users never initiate update transactions. For those reasons, there is a difference in data access observed on DWs and operational databases, where short transactions are more common, providing high performance and short response time [7].. Lechtenbörger and Vossen conclude that, although it is generally agreed that DW design is a nontrivial task, hardly any formal guidelines exist to date for deriving a good schema from given data sources. As a result, there appears to be a considerable discrepancy between traditional database design as applied to operational databases, and the design principles that apply to DWs [7]. According to R. Kimball we can isolate following DW requirements: 1. The DW must make an organization’s information easily accessible. 2. The DW must present the organization’s information consistently. 3. The DW must be adaptive and resilient to change. 4. The DW must be a secure bastion that protects our information assets. 5. The DW must serve as the foundation for improved decision making. 6. The business community must accept the DW if it is to be deemed successful [6].. 10.
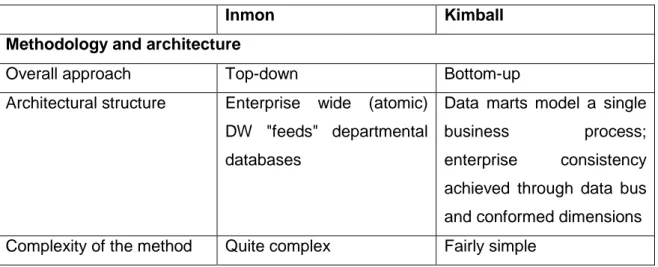
(33) Case study of data warehouse development for monitoring of energy consumption in public buildings. 2.1. Data warehouse development approaches. Although DWs are today widely spread and used today, there lacks a single opinion regarding best DW development approach. Pioneers of data warehousing, Bill Inmon and Ralph Kimball, introduced their own approaches which are dominant today. Inmon advocates building a central enterprise-wide DW that would provide an overall business intelligence system. This approach is also known as top-down approach that adapts traditional relational development tools to the needs of DW. From this central enterprise-wide DW, individual department based DWs are developed to serve the analytical needs of that department. Kimball’s approach recommends building business process based databases, known as data marts, which can later be integrated using an information bus. This approach is also known as bottom-up, because it first addresses individual business process needs and then sums them up to the enterprise-wide solution. Kimball’s approach is unique to data warehousing as it introduces a dimensional data model, which organizes data in several fact and dimensional tables. The dimensional data model will be explained in more detail in chapter 2.3. The differences between Inmon’s and Kimball’s approaches are many and deep, where development methodologies, data modelling and DW architectures are the most essential [2]. According to M. Breslin these differences are represented in Table 2.1. Table 2.1 Comparison of the essential features of Inmon's and Kimball's models. Inmon. Kimball. Methodology and architecture Overall approach. Top-down. Architectural structure. Enterprise. Bottom-up wide. (atomic) Data marts model a single. DW "feeds" departmental business databases. enterprise. process; consistency. achieved through data bus and conformed dimensions Complexity of the method. Quite complex. Fairly simple. 11.
(34) Case study of data warehouse development for monitoring of energy consumption in public buildings. Comparison. with Derived. established. from. the. spiral Four-step. development methodology. departure. methodologies Discussion. of. process; from. a. RDBMS. methods physical Fairly thorough. Fairly light. design Data modelling Data orientation. Subject- or data-driven. Process oriented. Tools. Traditional (ERDs, DISs). Dimensional modelling; a departure from relational modelling. End-user accessibility. Low. High. Primary audience. IT professionals. End users. Place in the organization. Integral. Philosophy. part. Corporate. of. the Transformer and retainer of. Information operational data. Factory (CIF) Objective. Deliver a sound technical Deliver. a. solution. that. solution based on proven makes it easy for end users database. methods. technologies. and to directly query the data and still get reasonable response times. 2.2. Components of a data warehouse. According to R. Kimball there are four main components of DW:. 2.2.1 Data sources Typically, the source of the data for DW are operational applications, or to be precise, their databases. These databases are referred to as operational databases. Operational databases are designed with the purpose of managing dynamic data in real-time, in short transactions and with the aim of providing the best performance and availability while creating and modifying the data.. 12.
(35) Case study of data warehouse development for monitoring of energy consumption in public buildings. Operational databases should be thought of as outside the DW because presumably we have little to no control of the content and format of the data stored in them. Queries against source systems are narrow, one record at a time queries that are part of the normal transaction flow and severely restricted in their demands on the operational system.. 2.2.2 Data staging area Data staging area of the DW is both a storage area and a set of processes commonly referred to as Extract-Transform-Load (ETL). It includes everything between operational source systems and the presentation area. As Kimball illustrates, it is somehow analogous to the kitchen of a restaurant, where raw food products are transformed into a fine meal. The key architectural requirement for the data staging area is that it is off-limits to business users and does not provide query and presentation services. Its only responsibility should be accessing the selected data from multiple heterogeneous databases and other information sources and transforming it to the shape fit for user query and consumption. The process of getting data from operational sources to DW consists of three steps. The first step is the extraction of data from various sources. Extracting means reading and understanding the source data and preparing it for further manipulation. Once the data is extracted to the staging area, there are numerous potential transformations, such as cleaning the data, combining data from multiple sources, deduplication of data, assigning warehouse keys, etc. These transformations are all precursors to the final step, loading the data into the DW.. 2.2.3 Data presentation Data presentation, as Kimball calls it, is where data is organized, stored and made available for querying by users, reports and other analytical applications. When the DW is mentioned, this is the component which is commonly being referred to. It represents extracted and transformed data being stored in the way that is suitable for extensive querying while being understandable to the business users. Data presentation area is organized in a series of data marts, which presents the data from a single business process. A single data mart consists of dimensional and fact tables where the actual data. 13.
(36) Case study of data warehouse development for monitoring of energy consumption in public buildings. is stored. The data model consisting of dimensional and fact tables is called dimensional model and is discussed in chapter 2.3.. 2.2.4 Data access This is the final component of the whole DW system. It represents a variety of techniques and tools that allow the user to access the data in the presentation area, including report systems, OLAP or data mining tools.. 2.3. Dimensional data model. Databases in transactional (operational) systems comply with normal forms and are optimized for giving best performances in the context of handling individual transactions. A dimensional model is a logical design technique that seeks to present the data in a standard, intuitive framework that allows for high-performance access. It adheres to a discipline that uses the relational model with some important restrictions. Every dimensional model is composed of one table with a multipart key, called the fact table, and a set of smaller tables called dimension tables. Each dimension table has a single-part primary key that corresponds exactly to one of the components of the multipart key in the fact table [5]. Dimensional models can be implemented in the following two methods: . Star schema. . Snowflake schema. The difference between those two schemas is in the arrangement of the dimensional tables and their relationships towards the fact table. The fact table of the star schema is directly connected to all the dimension tables that describe it. All dimensions are in one to many relationship and they visualize a star. The snowflake schema is an extension of the star schema which is also composed of a fact table and a set of related dimension tables, but they are normalized into sub-dimension tables. Not all dimension tables are related to the fact table because some dimension tables are related only to other dimensions.. 14.
(37) Case study of data warehouse development for monitoring of energy consumption in public buildings. 3 CASE STUDY The integral part of the Energy information system (EIS) developed for the customer is the extensive and dynamic reporting system. Generating complex reports has a significant impact on performance of operational (transactional) database. And to avoid the load on it, the logical step was to introduce DW. The first step in the process of implementing a DW was to evaluate requirements and to determine what development approach to choose. After evaluating the requirements, characteristics of the system and technologies and personnel we had on our disposal, a decision was made to take Kimball’s bottom-up approach. Arguments for this decision are provided in Chapter 3.1. After deciding that our DW would use the dimensional model, we still didn’t know what model schema would best suit our needs. After consulting the documentation and taking the opinions of team members into consideration, we made the decision to go with the star schema, but engineering curiosity gave us the idea to conduct a case study on ETL process performance for DW model implemented with the snowflake schema. The goal of this study was to determine which dimensional data model schema implementation will yield better results concerning execution of the ETL process.. 3.1. Choosing the approach. A decision on what development approach to take had to be made taking the following into consideration: . Data warehouse needed to be implemented in a very short time frame. . Our team members didn’t have any practical experience with DW development. . The customer agreed to develop the DW in phases, where each development phase would address one specific area of the system. . Data source system was stable and developed by our team. Based on the theoretical knowledge of the team members, our decision was leaning toward Kimball’s approach and further research confirmed the decision. In her article Data Warehousing Battle of the Giants: Comparing the Basics of the Kimball and Inmon Models,. 15.
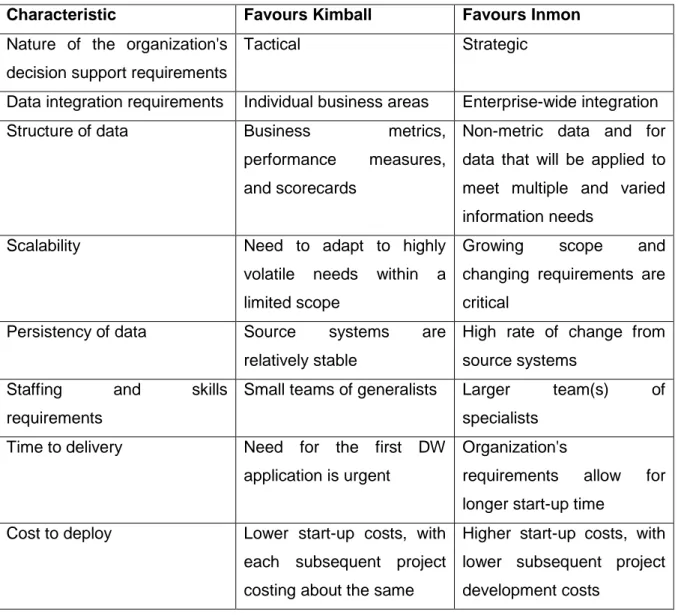
(38) Case study of data warehouse development for monitoring of energy consumption in public buildings. M. Breslin presented guidelines that helped us make a decision. She summarizes specific characteristics in favour of Inmon’s or Kimball’s model, which are presented in Table 3.1. Table 3.1: Specific characteristics in favour of Inmon's or Kimball's model. Characteristic. Favours Kimball. Favours Inmon. Nature of the organization's Tactical. Strategic. decision support requirements Data integration requirements. Individual business areas. Structure of data. Business. Enterprise-wide integration. metrics, Non-metric data and for. performance. measures, data that will be applied to. and scorecards. meet multiple and varied information needs. Scalability. Need to adapt to highly Growing volatile. needs. within. Source. systems. critical are High rate of change from. relatively stable Staffing. and. and. a changing requirements are. limited scope Persistency of data. scope. source systems. skills Small teams of generalists. requirements. Larger. team(s). of. specialists. Time to delivery. Need. for. the first. application is urgent. DW. Organization's requirements. allow. for. longer start-up time Cost to deploy. Lower start-up costs, with Higher start-up costs, with each subsequent project lower subsequent project costing about the same. development costs. After consulting those guidelines, the following characteristics were in favour of Kimball’s model: . Data integration requirements A solution was needed to address an individual business area – monitoring of a building’s energy consumption.. . Persistency of data The data source system is an EIS operational database. . 16. Staffing and skills requirements.
(39) Case study of data warehouse development for monitoring of energy consumption in public buildings. We had a small team which didn’t include a data warehousing specialists at our disposal . Time to delivery The first phase of DW had a deadline of just 2 months. Taking everything into account we chose Kimball’s DW approach.. 3.2. Data warehouse development. 3.2.1 Source database Data source for this warehouse is the operational database of EIS application. Only one data source made the development of the database easier because we did not need to integrate and merge data from various sources. Image 3.1 presents the part of the model of the EIS operational database that is relevant for DW. Bill. Customer. CustomerSubtype. BillItemStatus. BillItem ServiceItemType. EnergySource. CustomerType. Measurement PointUser EnergySourceType CounterRawData. EnergySource Consumption. ServiceItem. Measurement Point. Tariff. EnergySource Purpose. EntityUse. Counter Measurement PointEntity. TariffModel. Entity Details Entity. Service. EntityType WeatherStation. WeatherStation VariableForEntity WeatherStation Variable. EntityHierarchy Monthly Consumption IndicatorValue. AssetCategory. WeatherData. AssetType. Asset. Consumption Indicator. WeatherDataType. numerator. AssetDetails Definition. Yearly Consumption IndicatorValue. AssetDetails. Supplier. EnergyEfficiency Report EnergyEfficiency Class. denominator. Consumption IndicatorElement. EnergyEfficiency Certificate. Image 3.1: EIS operational database model. 17.
(40) Case study of data warehouse development for monitoring of energy consumption in public buildings. 3.2.2 Dimensional model design Data model of DW depends on both input and output data. Data is acquired from the operational database. The operational database model is presented in Image 3.1. Due to the intellectual ownership of the software solution and all of its parts, for the purpose of this case study the data model had to be obfuscated, but obfuscation was done in such a way that the model kept its integrity and all the major parts necessary for credible results of this study. Also, only a part of the model that is relevant for this study is presented. Data warehouse data model had to be designed in a way that will allow storing the data necessary for analysis and report generation. According to Kimball, dimensional data model design consists of four steps:. 3.2.2.1 Step 1 In the first step of the dimensional model design the goal is to fully understand the business process and need of the future users. Based on the requirements analysis and consulting with users, the knowledge of values on which the reports will be based was gained. This information was the foundation for defining the fact tables. After requirements analysis it was determined that we need the following eight fact tables: . FactBillItemForEntity – Entity’s3 energy consumption4 fact table. . FactBillItemForCustomer – Customer’s5 energy consumption fact table. . FactEntityUse – Fact table that represents using of Entities by Customers. . FactAssetDetailsValue – Fact table that represents Asset6 in Entities. . FactIndicatorElementValueForEntity – Fact table of Energy consumption indicators for Entities. . FactIndicatorElementValueForCustomer – Fact table of Energy consumption indicators for Customers. . 3. FactMeasurementData – Measurement data7 fact table. In EIS every room, building or complex that can have its own energy consumption (energy consumption measurement devices) is considered as an Entity 4 Energy consumption refers to consumption stated on bills provided by suppliers 5 Customer is someone who is using an Entity (e.g. school, public library, hospital) and generates energy consumption in that Entity through activities (e.g. heating, cooling, using the lights) 6 Asset is equipment in Entity that can consume some energy source (e.g. heating source, air conditioner, light bulb) 7 Measurement data is energy consumption data acquired directly from energy consumption measurement devices. 18.
(41) Case study of data warehouse development for monitoring of energy consumption in public buildings. . FactWeatherData – Meteorological data fact table. For the purpose of this case study, analysis was done only on the example of Entity energy consumption fact table (FactBillItemForEntity) and Customer energy consumption fact table (FactBillItemForCustomer). Every schema will have both of those fact tables, so that will result in four fact tables in total that will be developed in this case study. In EIS DW we need to track the consumption of energy source and cost associated with that consumption. Consumption and cost need to be tracked regarding who consumed the energy, the time period of consumption and the purpose of that consumption.. 3.2.2.2 Step 2 In this step the granularity of fact tables needs to be defined. Kimball and Ross give advice to develop the dimension model on most atomic information captured by a business process [6]. Energy consumption and the financial cost of energy being consumed are tracked on the basis of official data provided by the energy source suppliers, and are expressed in bills. For that reason, the smallest or most atomic information that can be tracked from the bill is the bill item expressed on that bill. The bill item with its time period is taken as the grain of both Entity and Customer energy consumption fact tables. The same grain is also defined for both star and snowflake schemas.. 3.2.2.3 Step 3 During the first two steps of DW model design there were no differences when both schemas that are used are compared. In both cases the same business model and the same facts were compared. But in the third step of the development process dimensions describing the facts need to be defined. The star and snowflake schema use different approaches to arranging dimensional tables, so models differ. The snowflake schema complies with the third normal form and is similar to the operational database model. Dimensions that describe a single fact have similar dependencies as associated tables in the operational database, so not every dimensional table is directly connected to the fact table.. 19.
(42) Case study of data warehouse development for monitoring of energy consumption in public buildings. On the other hand, the star schema is denormalized and thus differs from the operational EIS database significantly. There are no dependencies between dimensions and the dimensions are directly connected to the facts. According to Kimball and Ross, the basic dimensions for every fact table are derived from its granularity. Since granularity for energy consumption based on the data derived from bills is the same for all the fact tables that are going to be developed in this case study, they all have the some common basic dimension. Those are: . Date dimension (DimensionDate) – all consumption data has to be placed in the time period in which it was made. To fulfil this request, every record in the fact table has to be described with two dates – it has to have two connections to dates dimension table.. . Bill dimension (DimensionBill) – fact tables represent bill items, so every fact table must have a connection to the bill’s dimension. (poveznicu s dimenzijom računa?). . Measurement point dimension (DimensionMeasurementPoint) – every consumption is made at some measurement point. A measurement point is an object in the EIS model that connects consumption data from the bills with the measurement data acquired directly through measurements by measuring devices.. . Energy source dimension (DimensionEnergySource) – consumption refers to some of the energy sources so every fact table must have a connection to the energy source’s dimension.. . Energy source purpose dimension (DimensionEnergySourcePurpose) – all energy consumption is made with some purpose. Through the energy source purpose dimension all of the consumption is associated with some purpose, like heating, cooling, cooking, preparation of domestic hot water, etc.. Those dimensions shared across more fact tables in different data marts are called conformed dimensions. Other dimensions are not shared among all four fact tables but relate only to one fact table. In the next two chapters the third design step for models of both schemas is described, first for Snow and later for Snowflake schema.. 20.
(43) Case study of data warehouse development for monitoring of energy consumption in public buildings. (a) Dimension definition of Star schemas The star schema is characterized by having dimensions connected directly to fact tables. Both of the energy consumption fact tables in the star schema rely on the same source data, so they share a majority of dimensions. In addition to common dimensions, the only difference is that Entity energy consumption fact table (FactBillItemForEntity) is connected to Entity dimension (DimensionEntity) and Customer energy consumption fact table (FactBillItemForCustomer) is connected to Customer dimension (DimensionCustomer). Image 3.2 and Image 3.3 represent dimensions in the star schema model of Entity’s and Customer’s consumption fact tables, respectively. DimensionBill. DimensionEnergySourceConsumption. FactBillItemForEntity DimensionServiceItem. EntityId EnergySourceId EnergySourcePurposeId FromDateId ToDateId MeasurementPointId. DimensionDate. DimensionEntity. ServiceItemId EnergySourceConsumptionId BillOwnerId BillId Quantity QuantityInKWh AmountWithoutTax. DimensionCustomer. AmountWithTax ConfirmationUser EntryUser. DimensionEnergySource. DimensionEnergySourcePurpose. DimensionMeasurementPoint. Image 3.2: Model of entity's consumption fact table with its dimensions in star schema. 21.
(44) Case study of data warehouse development for monitoring of energy consumption in public buildings. DimensionMeasurementPoint. DimensionEnergySource. FactBillItemForCustomer CustomerId. DimensionServiceItem. EnergySourceId EnergySourcePurposeId FromDateId. DimensionDate. ToDateId MeasurementPointId ServiceItemId EnergySourceConsumptionId BillOwnerId BillId Quantity. DimensionCustomer. QuantityInKWh. DimensionBill. AmountWithoutTax AmountWithTax ConfirmationUser EntryUser. DimensionEnergySourceConsumption. DimensionEnergySourcePurpose. Image 3.3: Model of customer's consumption fact table with its dimensions in star schema. (b) Dimension definition of Snowflake schemas Snowflake schemas comply with the 3rd normal form so a model in that schema is a lot closer to the model in the source database. But because fact tables in the star and snowflake schemas are based on the same source data they have to be described with the same information. For that reason, a model complying with both star and snowflake share the same dimensions but with different relations. While there are no relations between dimension tables in the star schema, dimensions are related to each other in the snowflake schema. Image 3.4 and Image 3.5 represent fact tables with their dimensions in the snowflake schema.. 22.
(45) Case study of data warehouse development for monitoring of energy consumption in public buildings. DimensionEnergySource. DimensionEntityType. DimensionServiceItem. FactBillItemForEntity DimensionServiceItemId DimensionEntityDetailsId DimensionEnergySourceId. DimensionDate. DimensionDateFromId. DimensionEntity. DimensionDateToId Quantity AmountWithoutTax AmountWithTax EisBillItemId. DimensionEntityDetails. QuantityInKWh DimensionMeasurementPointId DimensionBillId DimensionEnergySourceConsumptionId. DimensionEnergyEfficiencyClass. DimensionMeasurementPoint. DimensionCustomer. DimensionBill. DimensionEnergySourceConsumption. DimensionCustomerSubtype DimensionEnergySourcePurpose. DimensionCustomerType. Image 3.4: Model of entity's consumption fact table with its dimensions in the snowflake schema. 23.
(46) Case study of data warehouse development for monitoring of energy consumption in public buildings. DimensionEnergySourcePurpose. DimensionEnergySourceConsumption DimensionEnergySource. FactBillItemForCustomer. DimensionCustomerType. DimensionCustomerId DimensionServiceItemId DimensionEnergySourceId DimensionDateFromId. DimensionCustomerSubtype. DimensionDateToId Quantity QuantityInKWh AmountWithoutTax. DimensionCustomer. AmountWithTax EisBillItemId DimensionBillId DimensionMeasurementPointId. DimensionMeasurementPoint. DimensionEnergySourceCons.... DimensionServiceItem. DimensionDate. Image 3.5: Model of customer's consumption fact table with its dimensions in the snowflake schema. 3.2.2.4 Step 4 The fourth step of the dimensional model design implies a more detailed analysis of what information has to be included in the fact tables. That information is:. 8. . Energy consumption in the basic measurement unit stated in the bill (Quantity). . Energy consumption stated in kWh (QuantityInKWh). . Amount8 with tax (AmountWithTax). . Amount without tax (AmountWithoutTax). All amounts are expressed in Croatian national currency Kuna (HRK). 24.
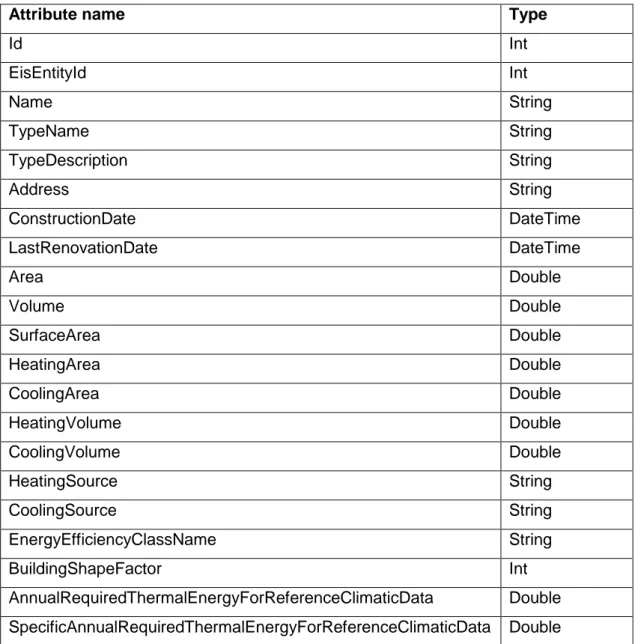
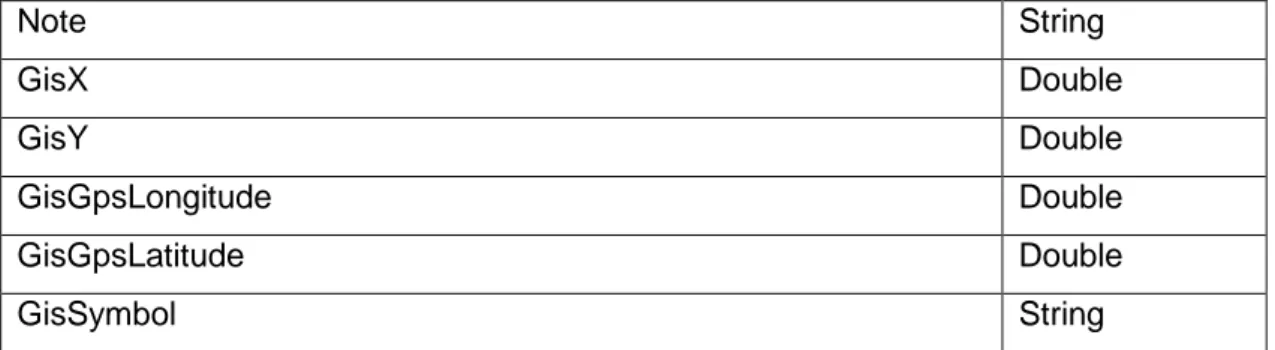
(47) Case study of data warehouse development for monitoring of energy consumption in public buildings. 3.2.2.5 Defining of attributes of dimension tables At the end of the process of dimensional model design, attributes of dimension tables still had to be defined. Because dimensions describe values in fact tables, dimension tables must have all the information that can be used to describe fact tables. That is particularly important because the customer’s request was to provide them with the ability to create dynamic custom reports, thus we had to predict what attributes they might need. Tables Table 3.2 to Table 3.22 present attributes of all dimension tables for both schemas.. (a) Attributes of dimension tables in the star schema Table 3.2: Attributes of dimension DimensionEntity for star schema. Attribute name. Type. Id. Int. EisEntityId. Int. Name. String. TypeName. String. TypeDescription. String. Address. String. ConstructionDate. DateTime. LastRenovationDate. DateTime. Area. Double. Volume. Double. SurfaceArea. Double. HeatingArea. Double. CoolingArea. Double. HeatingVolume. Double. CoolingVolume. Double. HeatingSource. String. CoolingSource. String. EnergyEfficiencyClassName. String. BuildingShapeFactor. Int. AnnualRequiredThermalEnergyForReferenceClimaticData. Double. SpecificAnnualRequiredThermalEnergyForReferenceClimaticData. Double. 25.
(48) Case study of data warehouse development for monitoring of energy consumption in public buildings. Note. String. GisX. Double. GisY. Double. GisGpsLongitude. Double. GisGpsLatitude. Double. GisSymbol. String. Table 3.3: Attributes of dimension DimensionCustomer for star schema. Attribute name. Type. Id. Int. EisCustomerId. Int. Name. String. TypeName. String. TypeId. Int. SubtypeName. String. SubtypeId. Int. EmployeesCount. Int. Address. String. Table 3.4: Attributes of dimension DimensionEnergySource for star schema. Attribute name. Type. Id. Int. EisEnergySourceId. Int. Name. String. Type. String. TypeDefinition. String. Table 3.5: Attributes of dimension DimensionEnergySource for star schema. Attribute name. Type. Id. Int. EisEnergySourcePurposeId. Int. Name. String. 26.
(49) Case study of data warehouse development for monitoring of energy consumption in public buildings. Table 3.6: Attributes of dimension DimensionEnergySourceConsumption for star schema. Attribute name. Type. Id. Int. EisEnergySourceConsumptionId. Int. Table 3.7: Attributes of dimension DimensionMeasurementPoint for star schema. Attribute name. Type. Id. Int. EisMeasurementPointId. Int. Name. String. Number. String. Table 3.8: Attributes of dimension DimensionServiceItem for star schema. Attribute name. Type. Id. Int. EisServiceItemId. Int. Name. String. Unit. String. Type. String. TypeDefinition. String. Table 3.9: Attributes of dimension DimensionBill for star schema. Attribute name. Type. Id. Int. BillId. Int. BillNumber. String. 27.
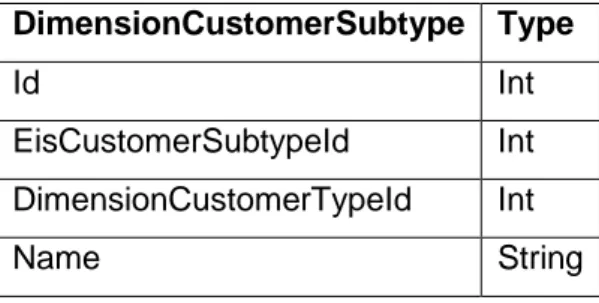
(50) Case study of data warehouse development for monitoring of energy consumption in public buildings. (b) Attributes of dimension tables in the snowflake schema Table 3.10: Attributes of dimension DimensionBill for snowflake schema. DimensionBill. Type. Id. Int. EisBillId. Int. BillOwnerId (Id of DimensionCustomer) Int. Table 3.11: Attributes of dimension DimensionCustomer for snowflake schema. DimensionCustomer. Type. Id. Int. EisCustomerId. Int. DimensionCustomerSubtypeId Int Name. String. Table 3.12: Attributes of dimension DimensionCustomerSubtype for snowflake schema. DimensionCustomerSubtype Type Id. Int. EisCustomerSubtypeId. Int. DimensionCustomerTypeId. Int. Name. String. Table 3.13: Attributes of dimension DimensionCustomerType for snowflake schema. DimensionCustomerType Type Id. Int. EisCustomerTypeId. Int. Name. String. 28.
(51) Case study of data warehouse development for monitoring of energy consumption in public buildings. Table 3.14: Attributes of dimension DimensionDate for snowflake schema. DimensionDate Type Id. Int. DateTime. DateTime. Hour. Int. Day. Int. Month. Int. Year. Int. Season. String. DayOfWeek. Int. Weekday. Int. Holiday. Bit. Table 3.15: Attributes of dimension DimensionEnergyEfficiencyClass for snowflake schema. DimensionEnergyEfficiencyClass Type Id. Int. EisEnergyEfficiencyClassId. Int. Name. String. DimensionEnergyEfficiencyClass. String. Table 3.16: Attributes of dimension DimensionEnergySource for snowflake schema. DimensionEnergySource Type Id. Int. Name. String. EisEnergySourceId. Int. PrimaryEnergyFactor. Double. EnergyValue. Double. EnergyValueUnit. String. CO2Emission. Double. CO2EmissionUnit. String. 29.
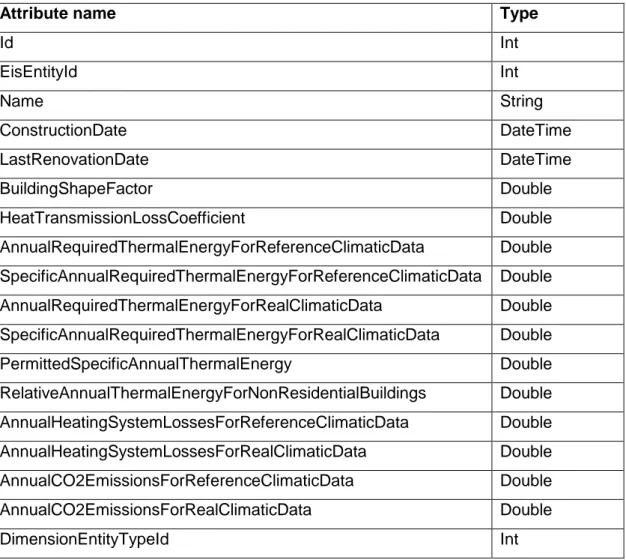
(52) Case study of data warehouse development for monitoring of energy consumption in public buildings. Table 3.17: Attributes of dimension DimensionEnergySourceConsumption for snowflake schema. DimensionEnergySourceConsumption Type Id. Int. EisEnergySourceConsumptionId. Int. DimensionEnergySourcePurposeId. Int. Table 19: Attributes of dimension DimensionEnergySourcePurpose for snowflake schema. DimensionEnergySourcePurpose Type Id. Int. EisEnergySourcePurposeId. Int. Name. String. Table 3.18: Attributes of dimension DimensionEntity for snowflake schema. Attribute name. Type. Id. Int. EisEntityId. Int. Name. String. ConstructionDate. DateTime. LastRenovationDate. DateTime. BuildingShapeFactor. Double. HeatTransmissionLossCoefficient. Double. AnnualRequiredThermalEnergyForReferenceClimaticData. Double. SpecificAnnualRequiredThermalEnergyForReferenceClimaticData. Double. AnnualRequiredThermalEnergyForRealClimaticData. Double. SpecificAnnualRequiredThermalEnergyForRealClimaticData. Double. PermittedSpecificAnnualThermalEnergy. Double. RelativeAnnualThermalEnergyForNonResidentialBuildings. Double. AnnualHeatingSystemLossesForReferenceClimaticData. Double. AnnualHeatingSystemLossesForRealClimaticData. Double. AnnualCO2EmissionsForReferenceClimaticData. Double. AnnualCO2EmissionsForRealClimaticData. Double. DimensionEntityTypeId. Int. 30.
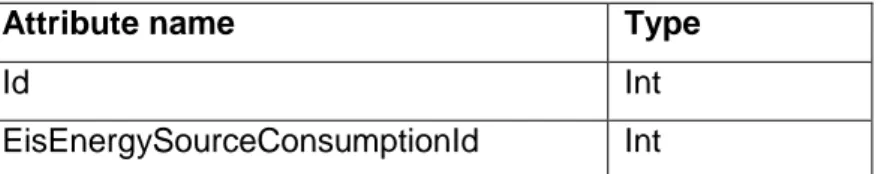
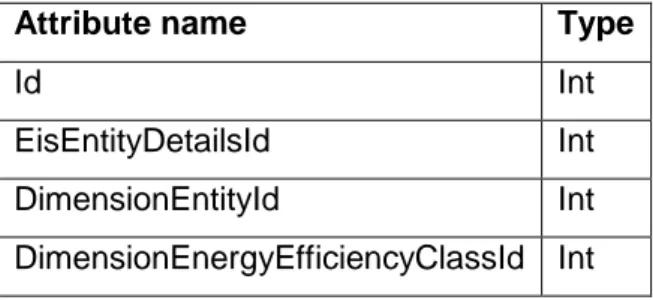
(53) Case study of data warehouse development for monitoring of energy consumption in public buildings. Table 3.19: Attributes of dimension DimensionEntityDetails for snowflake schema. Attribute name. Type. Id. Int. EisEntityDetailsId. Int. DimensionEntityId. Int. DimensionEnergyEfficiencyClassId Int. Table 3.20: Attributes of dimension DimensionEntityType for snowflake schema. Attribute name Type Id. Int. EisEntityTypeId. Int. Name. String. Table 3.21: Attributes of dimension DimensionMeasurementPoint for snowflake schema. Attribute name. Type. Id. Int. EisMeasurementPointId. Int. OwnerId (Id from DimensionCustomer) Int Number. String. Table 3.22: Attributes of dimension DimensionServiceItem for snowflake schema. Attribute name. Type. Id. Int. EisServiceItemId. Int. DimensionEnergySourceId Int Name. String. Unit. String. Type. String. TypeDefinition. String. 31.
(54) Case study of data warehouse development for monitoring of energy consumption in public buildings. 3.2.3 Dimensional model implementation Models were implemented using Entity Framework (EF), an open source object-relational mapping framework for ADO.NET, part of .NET Framework. EF enables .NET developers to work with relational data using domain-specific objects. It eliminates the need for most of the data-access codes that developers usually need to write. EF made the implementation of the models easier and faster by allowing us to write object classes in C# programing language, EF then took care of creating and updating underlying database tables and columns. Instead of manually developing the data model in the database management tool or by writing SQL scripts, we developed POCO9 Classes and EF then took care of creating corresponding tables and relationships in the database. In Image 3.6 we can see an example of a POCO class, and Image 3.7 depicts a table in database created by EF on base of this class.. POCO – Plain Old CLR Object. Term used by developers targeting the Common Language Runtime of the .NET Framework for class that does not have any dependency on an external framework. 9. 32.
(55) Case study of data warehouse development for monitoring of energy consumption in public buildings. Image 3.6: DimensionDate POCO class in C# programing language. 33.
(56) Case study of data warehouse development for monitoring of energy consumption in public buildings. Image 3.7: DimensionDate table in DW. 3.2.4 ETL process implementation The ETL process represents the basis of every DW. The goal of the ETL process is the acquisition of data from external data sources, transformation of that data and its loading into the DW. As both star and snowflake schema models were implemented, we developed two separate implementations of the ETL process, each for every schema type. This resulted in two separate console applications being developed using C# programing language and Entity Framework, each taking the responsibility for the ETL process for one implemented schema. The implementation of the ETL process was the most challenging and time consuming task. Not all data from the source database was needed at once and there was particular order in which we needed the data form the operational database to be loaded into DW. Also acquiring all the data to go into the ETL would be demanding for the computer running the DW. Because of those reasons we broke the process into smaller phases that would be responsible for the actions needed to be executed in that particular phase of the ETL. For example, to be able to load the data into fact tables we need the primary keys of dimension tables. That requires the dimension table to be loaded into DW prior to the fact tables.. 34.
(57) Case study of data warehouse development for monitoring of energy consumption in public buildings. The steps of extraction, loading and transformation of data was done so that the ETL process for dimension tables was done first, and only after the dimension tables were successfully loaded into DW, the ETL process for fact tables started. The process for dimension and fact tables was broken down into these steps: . . For dimension tables loading – a step was repeated for every dimension table o. Extraction of data for the dimension table from the source database. o. Filtration and transformation of data. o. Loading of data into the dimension table. For fact tables loading – a step was repeated for every fact table o. Preparation of hash dictionaries of the dimension tables needed for a particular fact – this was done to make the process faster. o. Extraction of data from the source database needed to fill the DW fact table. o. Filtration and transformation of data. o. Connecting facts data with corresponding dimensions that describe that data. o. Loading of data into the fact table. As there was only one source database we avoided the challenge of integrating data from various sources, which made the transformation and loading of data the most challenging part of the ETL process implementation.. 35.
(58) Case study of data warehouse development for monitoring of energy consumption in public buildings. 3.3. Testing. After the ETL process implementation and verification for both models, we had to evaluate both implementations to find out which one performs better in the terms of execution time and space consumption. Our goal was to find out if there is a difference in the duration between two implementations, and if the difference exists, how it changes with the increase of data in the operational database. We also wanted to find out if there is a difference in DW size when comparing both implementations and how the size changes with the increase of data in the operational database. As mentioned earlier, bill items are most atomic data in the operational database model and therefore we divided the operational database data in sets by number of bill items. That way we had fine control over how much data is being taken into the ETL process. The process was run for the following data sets: . 100.000,. . 200.000,. . 400.000,. . 800.000,. . 1.600.000 and. . 3.200.000 bill items.. Later we will address to each data set as follows: Table 3.23: Data sets used in tests. Count of bill items in data set. Data set name. 100.000,. k100. 200.000,. k200. 400.000,. k400. 800.000,. k800. 1.600.000. k1600. 3.200.000. k3200. 36.
(59) Case study of data warehouse development for monitoring of energy consumption in public buildings. 3.4. Results. For each bill item count we run the process 30 times. The results of the ETL process duration are presented in Table 3.24 and Table 3.25. The size of DW for each data set is presented in Table 3.26.. 37.
(60) Case study of data warehouse development for monitoring of energy consumption in public buildings. Table 3.24: Test result for the star schema model ETL process duration in seconds. Run. Bill item count 100.000. 200.000. 400.000. 800.000. 1.600.000. 3.200.000. 1. 28,5593253. 51,8403101. 93,8880062. 175,2660474. 488,1665460. 776,1902788. 2. 28,2597145. 51,4918138. 91,6759339. 178,3418412. 481,1158888. 894,8316071. 3. 27,6768219. 51,3610569. 94,1192820. 174,5898587. 457,3965794. 855,5274553. 4. 27,6484695. 50,3363241. 93,0483201. 178,7769904. 465,1025074. 850,5492311. 5. 27,7063267. 52,4856314. 93,0156718. 179,2973351. 478,0004588. 898,6974912. 6. 26,8545422. 51,2761122. 91,5050973. 177,9433058. 461,9637297. 797,7746313. 7. 27,1239556. 51,4658796. 92,4841594. 176,5458354. 482,1301775. 807,4517618. 8. 26,7683811. 51,7639166. 91,3884539. 176,3737828. 478,6661271. 840,5591278. 9. 26,4731313. 51,2990046. 92,6880005. 178,6035347. 456,7303452. 923,7901513. 10. 26,9348206. 51,5978577. 93,0189511. 180,1192604. 488,7360758. 815,1570542. 11. 26,9018137. 50,4534386. 91,1721287. 174,8959098. 484,7564831. 878,2165537. 12. 27,3343301. 50,7771341. 90,8680081. 175,6864699. 466,8339284. 812,5613754. 13. 27,2248274. 50,3306275. 92,6298838. 178,2147210. 465,5936459. 840,9180990. 14. 27,2479475. 50,8039744. 91,9112480. 177,6220701. 483,9585996. 905,5074791. 15. 27,1582900. 50,4907410. 92,2641312. 179,5330582. 452,5324869. 835,0413134. 16. 27,3207670. 50,5586776. 92,0905615. 177,7011536. 465,7589252. 858,7042322. 17. 26,9269493. 50,1454507. 91,3293284. 177,0724025. 490,0663575. 886,6320741. 18. 27,2711781. 50,5605934. 91,7705564. 173,9473936. 470,5501895. 856,0833576. 19. 27,1006420. 49,5654837. 91,8211951. 177,9682030. 471,5875036. 872,9452771. 20. 26,7944101. 51,0604380. 93,7613381. 178,7500969. 483,7903404. 912,2178812. 21. 26,7864483. 50,7361004. 90,2700589. 178,0817811. 460,4118203. 845,2460558. 22. 27,2573095. 49,0860623. 91,1402277. 178,5402889. 471,3907318. 848,5006067. 23. 27,4500694. 49,8552895. 90,7427279. 177,0989114. 478,0746242. 898,8375285. 24. 27,6249252. 50,6684897. 92,2610394. 176,3587985. 467,3789032. 808,9266093. 25. 26,6999503. 50,3701785. 93,8431687. 178,2946740. 483,2113664. 827,7189278. 26. 26,8223338. 51,8802438. 93,2405996. 178,4793513. 486,0878071. 846,3347631. 27. 27,0022084. 51,4009139. 91,4069702. 176,1150467. 458,8362683. 798,9811912. 28. 27,2695608. 51,3599701. 92,6478298. 178,9060148. 461,2365426. 812,9427651. 29. 27,2972104. 51,1771206. 90,3294790. 177,8096724. 479,1020349. 881,2412995. 30. 26,8468561. 50,4837733. 90,1939928. 177,2539207. 469,6552585. 819,8728904. 38.
Gambar
+7


Dokumen terkait
aliran, volume, dan kapasitas buffer dengan terjadinya S-ECC pada anak usia 37-71. bulan di Kecamatan Medan Selayang, maka dapat direncanakan
Jika sebuah sumber informasi tidak mempunyai banyak pilihan atau memiliki derajat keacakan yang rendah, maka. informasi atau entropy tersebut
Perkembangan asuransi kesehatan sosial di berbagai Negara telah mengubah konsep asuransi kesehatan tradisional dimana selanjutnya asuransi kesehatan sosial tidak hanya
Jackson (2006, p379) manajer menerima tiga jenis informasi berbeda mengenai bagaimana para karyawan melakukan pekerjaan mereka. a) Informasi berdasar-sifat menidentifikasi
Puji dan Syukur penulis panjatkan atas kehadirat Allah SWT yang telah memberikan kekuatan dan kesehatan sehingga penulis dapat menyelesaikan penyusunan Laporan Akhir yang diberi
Namun lebih lanjut untuk menentukan pertemuan tersebut termasuk kedalam kondisi near miss atau tidak diperlukan pendapat oleh para ahli, senior officer, mengenai panjang
pertama tersebut, maka peneliti melakukan uji statistik dengan menggunakan rumus korelasi dan regresi sederhana yang dalam perhitungannya peneliti menggunakan alat
Sihombing, M.F., 2006, ‘Uji Efek Antidispepsi Ekstrak Daun Salam (Syzygium polyanthum ) terhadap Tikus Putih’, Skripsi, Sarjana Farmasi, Universitas Katolik
