BODY MASS INDEX STATUS
AMONG DIABETIC AND NON DIABETIC SAMPLES WHO ATTENDED WORLD DIABETIC DAY EVENT 2013
IN KERTALANGU VILLAGE
I Gusti Agung Ayu Indrayuni1 and Wira Gotera2 1
Faculty of Medicine, Udayana University
2
Internal Medicine, Sanglah Hospital Denpasar
ABSTRACT
The uncontrolled lifestyle is followed by the increasing risk of disease, especially the degenerative one. Diabetes mellitus is a metabolic disease that can cause mortality by its complication. Risk factors that contribute to the disease are lack of physical activity, family history, age, overweight and also obesity. The aim of this research is to find out the prevalence of body mass index status in diabetic and non diabetic samples. The research is held in Kertalangu Village, Badung, Bali at November 24th 2013 on World Diabetic Day event. Data were collected from people who came into the event. Diabetic status were
collected by intervew. Sample’s height and body weight are measured by researcher. The classification of sample’s BMI are 1.5% in underweight status, 51.5% are in normal BMI state, 36.8% are classified as overweight and 10.3% are obese. It is found that 50% of diabetic samples are classified as above-normal BMI status, the rest is in normal BMI state. Among non diabetic sample 53.33% are in normal BMI sate, 43.33 % are classified as above-normal BMI value (overweight and obese), 3.33 % in underweight state.
STATUS INDEKS MASSA TUBUH
DI ANTARA SAMPEL DIABETES DAN NON DIABETES PADA HARI DIABETES SEDUNIA TAHUN 2013
DI DESA KERTALANGU ABSTRAK
Gaya hidup yang tidak terkontrol berisiko mengalami berbagai penyakit, khususnya penyakit degeneratif. Diabetes mellitus merupakan penyakit metabolik yang dapat meyebabkan mortalitas karena komplikasi yang ditimbulkan. Faktor risiko dari penyakit ini adalah kurangnya aktivitas fisik, riwayat penyakit dalam keluarga, usia dan obesitas. Tujuan dari penelitian ini adalah untuk mengetahui prevalensi dari Indeks Massa Tubuh di antara sampel yang menderita dan tidak menderita diabetes. Penelitian ini diadakan di Desa Kertalangu, Badung, Bali pada tanggal 24 November 2013 pada acara Hari Diabetes Sedunia. Data didapatkan dari peserta yang datang ke acara tersebut. Status diabetes didapatkan dengan wawancara. Tinggi dan berat badan sampel diukur oleh peneliti. Klasifikasi IMT sampel adalah 1,5% berat badan kurang, 51,5% normal, 36,8% berat badan lebih dan 10,3% obesitas. Ditemukan 50% dari sampel yang menderita diabetes memiliki IMT di atas normal, sisanya dalam kategori normal. Di antara sampel yang tidak menderita diabetes 53,33% memiliki IMT normal, 43,33% dengan berat badan lebih dan 3,33% berat badan kurang.
katakunci: body mass index, obesity, diabetes mellitus.
BACKGROUND
The uncontrolled of lifestyle is followed
by the increasing risk of disease, especially
the degeneratif one. There are several
reason why people can’t control their
healthy lifestyle. It could be because they
are too busy to remember when they
should eat, what to eat, have no time to
exercise, using drugs or smoke as a stress
reliever, or don’t care how the food are
made. Other reason could be educational
factor, lack of knowledge. They don’t
know the cause of disease, how to prevent
or treat it. All of those reason can leads
people to suffer bad physical condition
such as obesity, and this condition then
leads to suffer any degenerative disease, in
this case is Diabetes Mellitus (DM). But
one thing that we should remember is
genetic also has a role in this case.
Obesity can be determined by Body Mass
Index (BMI) status. It is calculate from
individual height and body weight. Under
18.5 is categorized as underweight, BMI
between 18.6-24.9 is categorized as
normal (some article called it healthy
weight), overweight is ≤ 25and obese is ≤
Diabetes mellitus is a group of metabolic
diseases characterized by elevated blood
glucose levels (hyperglycemia) resulting
from defects in insulin secretion, insulin
action or both.2
WHO diagnostic criteria for diabetes
should be maintained fasting plasma
glucose ≥7.0mmol/l (126mg/dl) or 2–h
plasma glucose ≥11.1mmol/l (200mg/dl).3
It is known that the risk factor of the
disease are lack of physical activity, family
history, age, overweight and also obesity.1
METHOD
The research is held in Kertalangu Village,
Badung, Bali at November 24th 2013 on World Diabetic Day (WDD) event. Data
were collected from people who come into
WDD event. Sample’s height and body
weight were measured by researcher.
Sample’s height and body weight then calculated to know the BMI value by
dividing the body weight (in Kilogram)
with body height (in meter2). Other data that were also collected are name, sex, age,
job, and marital status. This research is
using cross sectional descriptive analysis
to find out the prevalence of obese (BMI
status) and Diabetic Mellitus. Univariate
cross sectional descriptive analysis is used
to analysze the characteristic of samples.
Bivariate cross sectional descriptive
analysis is used to find out the prevalence
of obese (BMI status) and Diabteic
Mellitus status.
The population are diabetic and non
diabetic adult people. The samples are
diabetic and non diabetic adult people (≥17
years old) who attended World Diabetic
Day event in Kertalangu on November 24th 2013. Samples are chosen by using quota
sampling method.
Subject in this research are both diabetic
and non diabetic adult people who come
into World Diabetic Day event in
Kertalangu on November 24th 2013. Both diabetic and non diabetic adult people who
came into World Diabetic Day event in
Kertalangu on November 24th 2013 were passing the measurement of body weight
(Kg) and height (m), and the diabetic
status (yes or no question) by interview,
and DM status is determine according to
doctor’s diagnose. Other data that are also
collected are sample’s name, age, sex, body weight, body height, diabetic status
and duration of suffering DM.
The variable in this research are sample’s
characteristic (age, sex, body weight, body
height), the BMI status (underweight,
normal, overweight, obese) and Diabetic
Mellitus status. Sample’s BMI is classified
RESULT
The average age of samples is 58 ± 12.47
years, the youngest sample is 17 years old
and the oldest is 78 years old. The
proportion of male and female is 45.6%
and 54.4%. The average of samples’ body
weight is 63.91 ± 11.07 Kg, with the
lowest body weight is 43.4 Kg and the
highest body weight is 94.6 Kg. The
average body height of sample is 1.59 ±
0.08 m, the shortest height is 1.40 m and
the tallest is 1.80 m. The mean BMI value
of sample is 25.34 ± 4.04 with the lowest
BMI is 18.40 and the highest one is 39.38.
Table 1. Sample’s Characteristic
Characteristic
Total (N=68 people)
Percentage (%) Sex
Male
Female
31
37
45.6
54.4
BMI
Underweight
Normal
Overweight
Obese
1
35
25
7
1.5
51.5
36.8
10.2
Diabetic Status
Diabetes
Non Diabetes
38
30
55.9
44.1
Table 1 explain that the classification of
sample’s BMI are 1.5% in underweight status, 51.5% are in normal BMI state,
36.8% are classified as overweight and
10.3% are obese. The proportion of
diabetic sample is higher (55.9%) rather
than non diabetic patient (44.1%). By an
interview with 38 diabetic samples, it is
known that 34.2% of them are suffering of
the disease since ≤5 years ago, 39.5% are suffering of the disease since 6-10 years
ago, and 26.3% are suffering of the disease
more than 10 years ago.
From 68 samples, 38 of them are suffering
diabetes and 30 are non diabetic samples.
The proportion of diabetic and non
diabeticsamples in underweight BMI
category is 0:1. In normal BMI category
there are 19 sample suffering diabetes and
16 sample have no diabetes. In overweight
category, the proportion of diabetic sample
is higher (17 samples) thannon diabetic
sample (8 samples). In obese category
there are 2 samples that suffering diabetes
and 5 samples of non diabetic status.
Below are the table of the prevalence of
BMI status among diabetic and non
diabetic samples. The data is written as
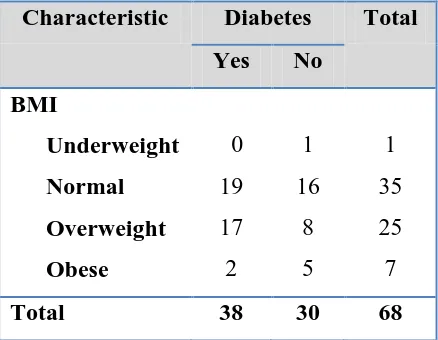
Table 2. The prevalence of BMI Status
among Diabetes and non Diabetic Sample
Characteristic Diabetes Total Yes No
BMI
Underweight Normal Overweight Obese
0
19
17
2
1
16
8
5
1
35
25
7
Total 38 30 68
The dominant BMI state in non diabetic
samples is in normal state, 16 samples
(53.3%). It is appropriate with the theory
that normal body weight or BMI will
reduce the risk of diabetic disease,
especially Type 2 DM,4 but the correlation
between this condition can’t conclude by this research because it needs further
analytical research.
DISSCUSION
From total 68 samples, it is found that the
average age is 58 ± 12,47 years, with the
youngest sample is 17 years old and the
oldest is 78 years old. The average of
sample’s body weight is 63.91 ± 11.07 Kg, with the lowest body weight is 43.4 Kg
and the highest body weight is 94.6 Kg.
The average body height of sample is 1.59
± 0.08 m, the shortest height is 1.40 m and
the tallest is 1.80 m. The proportion of
diabetic sample and non diabetic sample is
55.9% : 44.1%. According to data and
calculation, we can conclude that the
samples’ distribution is normal.
The dominant BMI state in non diabetic
samples is in normal state, 16 samples
(53.3%). One of the non diabetic sample
is in underweight state, 8 samples in
overweight state and 5 samples are at
obese state. Obesity is the major risk factor
of type 2 diabetes mellitus.4 In this research found that 55.9% of sample (38
samples) are suffering diabetes mellitus,
and 50% of them are classified as
above-normal BMI state (overweight and obese).
The dominant BMI status category among
diabetic samples is in normal state (19
samples), there are 17 diabetic samples
that classified in overweight state, and
there are only 2 sample in obese state. This
condition can affected by several factor,
such as the diet, the duration of suffering
disease, therapy, daily activity, and stress
level.
Those 50% from total diabetic samples and
43.33% non diabetic sample who has BMI
value above normal should be reduce the
body weight to control the disease and also
to control the complication because based
on the theory, samples who are has BMI
[image:5.595.67.286.139.309.2]factor that can worse the disease since
obesity is associated with an increase in
TNF production in adipose tissue that lead
to inflammation and being the major driver
to Type 2 DM that cause desensitization to
insulin signaling.4 Either overweight or
obesity can affect adiponectin.
Adiponectin is adipose tissue-specific
bioactive substances that can improves
insulin sensitivity.5
Study shows that intensive and structured
lifestyle modification that results in loss of
approximately 5% of initial body weight
can reduce the risk of progression from
impaired fasting glucose or impaired
glucose tolerance to type 2 diabetes by
almost 60%.6
CONCLUSION
The result shows that 50% of diabetic
samples are classified as above-normal
BMI value (overweight and obese), the
rest is in normal BMI state. Among non
diabetic sample 53.33 % are in normal
BMI state, 43.33 % are classified as
above-normal BMI value (overweight and
obese) 3.33 % in underweight state, but the
correlation among those condition can’t
conclude by this research because it needs
further analytical research.
After the result found, the suggestion to
samples and reader are exercise and diet to
control body weight. Exercise provides a
multitude of general health benefits such
as bettering bone and muscle strength,
blood pressure levels, mental health, and it
can also reduce the risk of cardiovascular
disease and diabetes. However, diet
playing a larger role in weight loss than
exercise.1
REFFERENCE
1. Lindsay Jones, M.S.; Sangeetha Shivaji, M.S.; Arthur G. Cosby, Ph.D.; Tara MorganWith the Advice of: Marshall Bouldin, M.D.; Herman A. Taylor, Jr., M.D., M.P.H. Obesity, Cardiovascular Disease & Diabetes. 2010
2. Emily Loghmani. Diabetes Mellitis: Type 1 and Type 2. Guidelines for Adolescent Nutrition Services (2005). Chapter 14
3. World Health Organization.
Defianition and Diagnosis of Diabetes
Mellitus and Intermediate
Hyperglycemia. 2006
4. Terrence P. McGarty. Obesity and Type 2 Diabetes: Cause And Effect. The Telmarc Group. November 2010
5. A. Hussain, M.Z.I .Hydrie, B
.Claussen, S. Asghar. Type 2 Diabetes and obesity: A review. Journal of
Diabetology, June 2010; 2:1