LAMPIRAN A
PERCOBAAN VALIDASI METODE ANALISA PROPRANOLOL
HCL
1. Penentuan Kurva Baku
Berikut ini adalah data dari kurva baku selama tiga hari berturut – turut
C1 ( g/
ml)
A1 C2
( g/ ml)
A2 C3
( g/ ml)
A3
5,1 0,085 5 0,002 5 0,09
10,2 0,18 10 0,088 10 0,173
15,3 0,259 15 0,185 15 0,253
20,4 0.387 20 0,272 20 0,362
25,5 0,472 25 0,375 25 0,466
30,6 0,503 30 0,528 30 0,643
35 0,622 35 0,698
40 0,697 40 0,815
45 0,794 45 0,877
55 0,999 55 1,024 a = b = r = 0,000214 0,0175 0,9934 a = b = r = -0,1098 0,02016 0,9986 a = b = r = -0,007 89 0,0194 0,9943
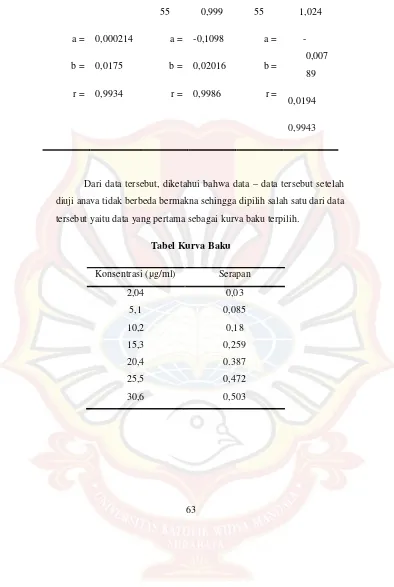
Dari data tersebut, diketahui bahwa data – data tersebut setelah diuji anava tidak berbeda bermakna sehingga dipilih salah satu dari data tersebut yaitu data yang pertama sebagai kurva baku terpilih.
Tabel Kurva Baku
Konsentrasi ( g/ml) Serapan
2,04 0,03
5,1 0,085
10,2 0,18
15,3 0,259
20,4 0.387
25,5 0,472
1. Perhitungan LOD dan LOQ
LOD diperoleh dari rumus Q = 3 Sy/x / b, sedangkan LOQ diperoleh dari
rumus Q = 10 Sy/x / b.
C A Yi Yi - Yt ( Yi - Yt )2
2,04 0,03 0,03599 0,00599 3,588E-05 5,1 0,085 0,08968 0,00468 2,19E-05 10,2 0,18 0,1791 -0,0009 8,1E-07 15,3 0,259 0,2686 0,0096 9,216E-05 20,4 0.387 0,3581 -0,0289 8,3521
E-04 25,5 0,472 0,4475 -0,0245 6,0025
E-04 30,6 0,503 0,5369 0,0339 1,1492
E-03
Sy/x =
= 0,023389527
Nilai b diperoleh dari kurva baku = 0,0175 LOD = 3 Sy/x / b
= 4,0096 g/ml LOQ = 10 Sy/x / b
2. Uji Akurasi
Penimbangan C teoritis
(
g/ml
)
Serapan C pengamatan
( g/ml )
%
recov
ery
50 mg/ml 30 0,518 29,52 98,4
50 mg/ml 30 0,527 30,03 100,1
50 mg/ml 30 0,523 29,80 99,3
50 mg/ml 30 0,528 30,09 100,3
49 mg/ml 30 0,517 29,46 98,2
51 mg/ml 30 0,531 30,26 100,9
3. Uji Presisi
C teoritis
(
g/ml)
Serapan C
pengam
atan
( g/ml)
% recovery
30 0,670 38,1825 127,275
30 0,644 36,7 122,333
30 0,671 38,2395 127,465
30 0,664 37,8404 126,1347 30 0,641 36,5292 124,2493
30 0,687 39,1516 127,946
Rata – rata % recovery = ( 127,275 + 122,333 + 127,465 + 126,1347 + 124,2493 + 127,946 ) / 6
= 125,9005 SD = 2,1922
KV = x 100%
LAMPIRAN B
DATA – DATA DAN PERHITUNGAN MOISTURE CONTENT
Formula (-1)
W1 (gram) W2 (gram) ( W1 – W2) % moisture
content
0,3494 0,3387 0,0107 3,06 %
0,3578 0,3462 0,0116 3,24 %
0,3542 0,3388 0,0154 4,46 %
Rata – rata 3,58 ± 0,88 %
Formula (a)
W1 (gram) W2 (gram) ( W1 – W2) % moisture
content
0,5202 0,5096 0,0106 2,04 %
0,5173 0,5064 0,0109 2,11 %
0,5187 0,5059 0,0128 2,47 %
Formula (b)
W1 (gram) W2 (gram) ( W1 – W2) % moisture
content
0,8177 0,7862 0,0315 3,85 %
0,8190 0,7845 0,0345 4,21 %
0,8219 0,7913 0,0306 3,72 %
Rata – rata 3,93 ± 0,28 %
Formula (ab)
W1 (gram) W2 (gram) ( W1 – W2) % moisture
content
0,9673 0,9417 0,0256 2,65 %
0,9513 0,9294 0,0219 2,30 %
0,9534 0,9267 0,0267 2,80 %
Anova: Single Factor
SUMMARY
Groups Count Sum Average Variance
Column 1 3 10.76 3.586667 0.580133 Column 2 3 10.89 3.63 0.0889 Column 3 3 11.78 3.926667 0.064433 Column 4 3 14.03 4.676667 0.040533
ANOVA Source of
Variation SS df MS F P-value F crit
Between
Groups 2.2887 3 0.7629 3.942636 0.053608 4.066181 Within
Groups 1.548 8 0.1935
LAMPIRAN C
JUMLAH PROPRANOLOL HCL YANG MELINTASI MEMBRAN
SEBAGAI FUNGSI AKAR WAKTU
Waktu (meni
t)
Jumlah proranolol HCl yang melintasi membran ( g/ml)
(-1) (a) (b) (ab)
LAMPIRAN D
JUMLAH PROPRANOLOL HCL YANG MELINTASI MEMBRAN
SEBAGAI FUNGSI WAKTU
Waktu (menit)
Jumlah proranolol HCl yang melintasi membran ( g/ml)
(-1) (a) (b) (ab)
LAMPIRAN E
PERHITUNGAN ANAVA UNTUK MODEL PELEPASAN
Response1 PELEPASAN
ANOVA for selected factorial model Analysis of variance table [Partial sum of squares -
Type III]
Sum of Mean F p-value
Source Squares df Square Value Prob> F Model 34.66 3 11.55 5172.82 < 0.0001
A-HPMC 18.65 1 18.65 8350.81 < 0.0001 B-PROPILEN
GLIKOL 1.18 1 1.18 527.52 < 0.0001 AB 14.83 1 14.83 6640.13 < 0.0001 Pure Error 0.018 8 2.233E-003
Cor Total 34.68 11
The Model F-value of 5172.82 implies the model is significant. There
is only
a 0.01% chance that a "Model F-Value" this large could occur due to noise.
Values of "Prob > F" less than 0.0500 indicate model terms are significant.
In this case A, B, AB are significant model terms.
Values greater than 0.1000 indicate the model terms are not significant. If there are many insignificant model terms (not counting those
required to support hierarchy),
model reduction may improve your model.
Std. Dev. 0.047 R-Squared 0.9995 Mean 5.23
Adj R-Squared 0.9993
The "Pred R-Squared" of 0.9988 is in reasonable agreement with the
"Adj R-Squared" of 0.9993.
"Adeq Precision" measures the signal to noise ratio. A ratio greater
than 4 is desirable. Your
ratio of 172.870 indicates an adequate signal. This model can be used to navigate the design space.
Final Equation in Terms of Coded Factors:
PELEPASAN = +5.23
-1.25 * A
+0.31 * B
LAMPIRAN F
PERHITUNGAN ANAVA UNTUK MODEL PENETRASI
Response 2 PENETRASI
ANOVA for selected factorial model Analysis of variance table [Partial sum of
squares - Type III]
Sum of Mean F p-value
Source Squares df Square Value Prob > F Model 0.010 3 3.449E-003 537.43 < 0.0001 A-HPMC 9.075E-005 1 9.075E-005 14.14 0.0055
B-PROPILEN
GLIKOL 5.334E-00 1 5.334E-003 831.29 < 0.0001 AB 4.921E-003 1 4.921E-003 766.87 < 0.0001 Pure Error 5.133E-005 8 6.417E-006
Cor Total 0.010 11
The Model F-value of 537.43 implies the model is significant. There is only
a 0.01% chance that a "Model F-Value" this large could occur due to noise.
Values of "Prob > F" less than 0.0500 indicate model terms are significant.
In this case A, B, AB are significant model terms.
Values greater than 0.1000 indicate the model terms are not significant. If there are many insignificant model terms (not counting those
required to support hierarchy),
model reduction may improve your model.
Std. Dev. 2.533E-003 R-Squared 0.9951 Mean 0.088 Adj R-Squared 0.9932 C.V. % 2.88 Pred R-Squared 0.9889 PRESS 155E-004 Adeq Precision 56.524
"Adeq Precision" measures the signal to noise ratio. A ratio greater
than 4 is desirable. Your
ratio of 56.524 indicates an adequate signal. This model can be used to
navigate the design space.
Final Equation in Terms of Coded Factors:
PENETRASI= +0.088
+2.750E-003 * A
+0.021 * B
LAMPIRAN G
KONDISI UJI OPTIMAL
Lower Upper Lower Upper Name Goal Limit Limit
Weight Weight
A:HPMC is in range -1 1 1 1 B:PROPILEN
GLIKOL is in range -1 1 1 1 PELEPASAN maximize 3.18 7.95 1 1 PENETRASI maximize 0.048 0.133 1 1
Solutions
No. HPMC PROPILEN PELEPASAN PENETRASI Desirability
GLIKOL
1 -0.82 1.00 7.48561 0.0900414 0.668
2 -0.80 1.00 7.4365
0.0905203 0.668
3 -0.86 1.00 7.58092
0.0891118 0.668
4 -0.76 1.00 7.32273
0.0916299 0.668
5 -0.90 1.00 7.66607
0.0882814 0.668