59 (Uji Kelarutan Phospor secara In vitro dari Berbagai Sumber Phospor Berbeda)
Amriana Hifizah
Jurusan Ilmu Peternakan, Fakultas Sains dan Teknologi, Universitas Islam Negeri Alauddin Jl.Sultan Alauddin No.63, Kabupaten Gow a
Corresponding email: annaw [email protected]
ABSTRAK
Kelarutan phospor dari berbagai suplemen phospor diukur dengan menggunakan prosedur in vitro, dalam tiga jenis uji yang berbeda, yaitu kelarutan dalam air; kelarutan dalam asam sitrat; dan kelarutan dalam asam chloride (0,1M HCl). Uji kelarutan air dan sitrat merupakan metode yang telah umum digunakan, sedangkan uji kelarutan asam merupakan uji baru untuk sampel yang akan dicobakan, dimana uji ini dikembangkan dengan mensimulasikan kondisi dalam saluran pencernaan ternak. Materi penelitian yang digunakan adalah: Lomon MDCP (M ono Dicalcium Phosphate), Duchess RP (Rock
Phosphate), Kynofos, M eat meal and MSOP (M ono Sodium Ortho Phosphate). Selain untuk
menguji daya larut posfor, juga untuk mengetahui pengaruh masa inkubasi terhadap posfor inorganik yang terlarut dalam larutan asam. Total kadar posfor tertinggi pada Lomon MDCP (21,6%) dan terendah pada meat meal (5,5%). Analisis statistik menunjukkan bahwa daya larut tergantung dari jenis sumber Posfor dan jenis larutan, dimana terdapat interaksi yang signifikan antara jenis posfor dan jenis larutan (P<0,001). Daya larut dalam 0,1M HCl meningkat seiring dengan peningkatan masa inkubasi pada semua sampel. Duchess RP dan meat meal memiliki daya larut terendah, meskipun pada masa inkubasi 1 jam, daya larutnya masing-masing mencapai 74% dan 83%. Nilai pH dari semua sampel berkisar 1,37-1,48. Terdapat interaksi yang signifikan antara jenis sumber posfor dengan masa inkubasi dalam larutan 0,1M HCl (P<0,001). Hasil penelitian mengindikasikan bahwa semua jenis sumber posfor yang digunakan memiliki daya larut yang tinggi dalam 0,1M HCl, sehingga dapat digunakan sebagai suplemen posfor pada ternak, jika diasumsikan bahwa uji daya larut dalam 0,1M HCl menyerupai kondisi dalam saluran pencernaan.
Kata Kunci: Posfor, Daya larut, in vitro, Rock phosphate, Monodicalcium phosphate
ABSTRACT
60
meal (5.5%). Duchess RP and meat meal had lowest solubility for all three tests. The statistical analysis showed that solubility depended on source of P and type of solution, with a significant interaction between P sources and type of solution (P<0.001). Solubility in 0.1M HCl increased with time incubated in all samples. Duchess RP and Meat Meal had lowest solubility at all time points but had reached 74 and 83% solubility respectively at 1 hr of incubation. pH value of all samples in acid solution ranged from 1.37 – 1.48. Solubility depended on source of P and time of incubation in 0.1M HCl with a significant interaction between P sources and time of incubation (P<0.001). The results indicated that all of the P sources used in this experiment were highly solubilised in dilute acid (0.1 M HCl) and so can be used as P supplements for animals if it is assumed that the 0.1 M HCl test mimics conditions within the digestive tract.
Key words: Phosphor, Solubility, In vitro, Rock phosphate, Monodicalcium phosphate
INTRODUCTION
It is important that animals are fed a balanced diet. Phosphor is one of the essential minerals and needs to be adequate in the diet for live weight gain, and reproduction, growth of rumen microorganisms and biochemical process in the body. Currently, there are many sources of phosphate that are produced for the farming industry. For instance organic phosphate is available largely as phytate P in cereal by-products and inorganic phosphate is found in sources such as monocalcium/ monodicalcium phosphate, rock phosphate, monosodium orthophosphate and meat and bone meal. There are different brand names of these kinds of phosphate in the market, and some are regarded as less soluble.
There is 14% P found in soft tissue and 1% in extracellular fluid (Blair-West et al., in Pfeffer and Hristov, 2005). In addition, 80% - 90% of body P is found in skeletal tissue and teeth of dairy cows (NRC in Pfeffer and Hristov, 2005). Pfeffer and Hristov (2005) indicated that most P was found in the skeleton of a cow, at about 3.8 kg P in a 60 kg skeleton compared to 600 g P in 500 kg soft tissues and organs of the cow. It is likely that gut contents of the cow contain about 100 g P (Pfeffer and Hristov, 2005).
Phosphor requirement for the animal varies with physiological state. For example, finishing cattle, require less at 0.16%P in DM. In pregnancy a 544 kg (1200lb) mature cow during pregnancy needs 0.15%P in DM and during lactation when producing 9 kg (20lb) milk, it needs higher P at 0.19% of DM (NRC in Fluharty, 2008). The net P requirement for growth of cattle is 8g P/ kg LW gain. Phosphor requirements also increased with increase in month of pregnancy. At five months pregnancy, the net gain of P of foetus and uterine tissues is 1 g P/ d compared to 5 g P/ d in 9 months pregnancy (Ternouth, 1990).
61 with a very low pH of 2.5 – 3 and so water solubility and citrate solubility may have little application to solubility within the digestive tracts of animal. It appears that there may be some absorption of P as organic acid but most is absorbed as inorganic P (Thompson et al. in Allen, 1984). High Ca levels in small intestine may decrease P absorption, if the animals consume low P diets. In addition, some other factors that appear to influence the P absorption are genetic, parasitism and interaction with other minerals, for example aluminium. Phosphor absorption can also be influenced by parathyroid hormone (Ternouth, 1990).
Phosphor interaction with minerals such as: Ca, Mg, K, Fe, Zn, Mo and Al, to form complexes which may decrease P absorption. This is probably caused by the formation of insoluble complexes from that interaction (Iqbal et al., 2005). It is also reported that young calves that consume milk have higher absorption of P (Lofgreen et al., in NRC, 2000). In addition, it is predicted that absorption of P from forage was 64% P, and concentrate 70% (AFRC in NRC, 2000).
M ATERIALS AND M ETHODS
All the samples used in this study were supplied by Ridleys Company from different sources. MSOP was laboratory grade chemical from UQ Gatton. The phosphorus sources that were investigated in this project were: Meat meal, Kynofos, Monosodium orthophosphate-MSOP (NaH2PO42H2O), Duchess rock phosphate, and Lomon MDCP. Prior to total P analysis, the samples were ground manually using a mortar and pestle. Sample weight for the solubility test was 1 g, and 2 g for total P analysis.
Phosphor was analysed by a spectrophotometric method after samples had been digested by a nitric-perchloric digest or had been solubilised by various tests. The preparation of Molybdovanadate reagent and the stock standard is based on AOAC Official Method 958.01, with a small modification. The standards were prepared from potassium dihydrogen phosphate (KH2PO4) to give final concentrations of between 10 and 50 mg/ 100ml of P.
Three tests were done to determine the solubility of P. They were water solubility, citrate solubility and acid (HCl) solubility. Water solubility and citrate solubility were common tests used by the fertiliser industry and acid solubility was a new test developed to simulate conditions within the digestive tract. Samples were tested as supplied with granule size by supplier. Total P was measured on ground samples. pH of the samples was also determined in each solution after 3 hr incubation, using pH probe.
W ater solubility test
62
0.125 ml of each sample was then added to 3.75 ml water and 1 ml Molybdovanadate reagent prior to measuring the absorbance in a spectrophotometer.
Citrate solubility test
The citrate solubility test was based on the inorganic feed phosphate test method (Regulation 2003/ 2003/ EC, method 3.1.3) (IFP, 2003) with modification of the shaking process.A 1 g triplicate sample was weighed, diluted in 200 ml of 2% citric acid, and shaken in water bath at 390C for about three hours. A 1 ml subsample was then, centrifuged for 3 minutes. Further, a 0.125 ml of each sample was then added to 3.75 ml water and 1 ml Molybdovanadate reagent prior to measuring the absorbance in a spectrophotometer.
Acid (0.1M HCl) solubility test
A 1 g triplicate sample was weighed, diluted in 200 ml of 0.1 M HCl, and shaken in a water bath at 390C for three hours. A 1 ml subsample was then centrifuged for three minutes and 0.125 ml of each sample was then added to 3.75 ml water and 1 ml Molybdovanadate reagent prior to measuring the absorbance in a spectrophotometer. A separate test was conducted with the acid solubility test to examine the effect of time of incubation. Samples in triplicate were incubated as above for 0.5, 1, 2, 3, and 24 hrs and inorganic P in solution determined.
Total P analysis
The method of total P analysis was based on inorganic feed phosphate test method (Regulation 2003/ 2003/ EC, method 3.1.3) (IFP, 2003), with a modification on the reagent. Total P was analyzed using a nitric-perchloric acid mixture. Samples were ground and a triplicate sample (2 g) was mixed with 20 ml of nitric-perchloric acid mixture (ratio 5:1) and incubated at 500C. After about an hour, the temperature was increased to 1500C, and incubated again for about 17 hour, prior to shaking vigorously. The samples were then put in small containers. One ml of each sample was sub sampled into small tubes, centrifuged for 3 minutes, and 0.125 ml of each sample was then added to 3.75 ml H2O and 1 ml Molybdovanadate reagent prior to measuring the absorbance in a spectrophotometer.
RESULTS
The P content of the samples are presented in Table 1, where Lomon MDCP had the highest level of P and meat meal has the lowest. The solubilities of P from the 3 tests are presented in Table 2 and Fig. 1. There were marked differences between the supplements for water solubility and citrate solubility but less differences were observed for acid solubility.
63 water and citrate solution. All P sources in acid solution had a similar low pH value (Table 3).
Table 1. Mean P content of some common P sources used as supplement for cattle (Lomon MDCP-Mono Dicalcium Phosphate from China, Duchess RP-Rock Phosphate from Queensland, Kynofos from South Africa (Callaghan and Lavers, 2008); meat meal from Queensland, and MSOP-Monosodium Ortho Phosphate from laboratory reagent (NaH2PO42H2O).
P sources Total P (%)
Lomon MDCP Duchess RP Kynofos Meat meal MSOP
21.6 8.0 20.2 5.5 18.8
Table 2. Solubilities of P from various sources in water, citrate and 0.1M HCl solutions after three hours of incubation.
P sourcesa
P solubilities (%)bc
Water Citrate Acid
Lomon MDCP Duchess RP Kynofos Meat meal MSOP
58 3 64 25 98
69 1 73 13 94
95 85 100 88 97 aStandard error of LS Mean of P sources = 0.797, bStandard error of LS Mean of solution = 0.617 cStandard error of LS Mean of interaction of P sources and solution = 1.380
Table 3. pH of various P sources in water, citrate and 0.1M HCl solutions after three hours of incubation
P sources pH
Water Citrate Acid
Lomon MDCP Duchess RP Kynofos Meat meal MSOP
4.76 8.42 4.70 7.30 4.60
6.54 9.45 6.53 8.72 6.42
[image:5.612.104.517.549.664.2]64
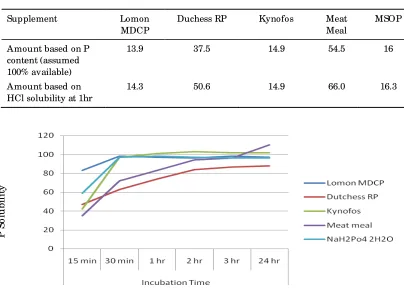
[image:6.612.103.518.172.287.2]Solubility increased with incubation time in all samples. Duchess RP and Meat Meal had lowest solubility at all early time points. Statistical analysis using two way analysis of variance, showed that solubility depended on source of P and time of incubation with a significant interaction between P sources and time of incubation (P<0.001).
Table 4. Effect of incubation time on P solubility % in 0.1M HCl acid solution
P sources a P solubility %
bc
15 min 30 min 1 hr 2 hr 3 hr 24 hr Lomon MDCP
Duchess RP Kynofos Meat meal MSOP
83 47 42 34 59
98 63 97 72 97
97 74 101 83 98
97 84 103 94 97
98 87 102 97 96
97 88 102 111 96 aStandard error of LS Mean of P sources = 0.289
bStandard error of LS Mean of incubation time = 0.317
cStandard error of LS Mean of interaction of P sources and time effect = 0.709
Table 5. The effect of P content and P solubility on the level of supplement (g supplement/ d) required to provide 3 g P/ d to 200 kg weaner steers
Supplement Lomon
MDCP
Duchess RP Kynofos Meat Meal
MSOP
Amount based on P content (assumed 100% available)
13.9 37.5 14.9 54.5 16
Amount based on HCl solubility at 1hr
14.3 50.6 14.9 66.0 16.3
Figure 1. Phosphor (%) solubility of different P sources at different incubation time.
P
S
o
lu
b
il
it
[image:6.612.99.503.363.666.2]65 DISCUSSIONS
This experiment investigated solubility of P from different P supplements with in
vitro procedures, using three different tests, namely water solubility, citric acid solubility
and acid (0.1M HCl) solubility. There is speculation in the beef industry that the solubility of P is important in determining the level of supplement requirement. However the test used to measure solubility varies between companies and analytical laboratories based largely on requirements for P as a fertilizer. Water and citrate solubility tests have previously been applied for testing P solubility for soil (Callaghan and Lavers, 2008). Ruminant animals have a digestive tract where pH changes markedly from approximately 7 in the rumen, 2.5-3 in the abomasum and rising quickly to 7-7.5 in the intestines (Orskov et al., 1986; Parish et al., 2009). The retention time of material in these parts of the tracts varies with retention time in the rumen ranging from 10-30 hrs, abomasum 0.3-0.6 hrs and transit through the small intestine of 3 hrs (Smuts et al., 1995). Thus fertilizer tests for solubility may have little application to solubility within the digestive tract where pH and time exposed to digesta conditions vary markedly from soil conditions. The results indicate that type of test and times of incubation markedly affect the solubility result obtained. A new in vitro P solubility test based on the dilute acid (0.1M HCl) found in the abomasum to deliver a pH close to 2 in the solubility solution found a much higher P solubility than the fertilizer tests of water solubility and citric acid solubility. This suggests that the availability of P from tw o P supplements recognised in the industry as low availability P, is much higher than thought. The final pH in the 0.1M HCl solution was lower than found in the abomasum (1.4 vs 2.5) and this may have affected the results. The effect of this small difference in pH should be clarified. The biggest factor affecting the level of supplement needed is total P content rather than solubility.
All of the samples appear to be highly soluble in acid solution (above 80%). If it is assumed that on average the retention within the abomasum is 0.5 hrs and transit through the acidic part of the small intestine is 0.5 hrs (Scharrer, 1985), then an incubation time of 0.5-1 hr is an appropriate test. Solubility increased in acid as time of incubation increased (Table 2, Fig 1). At 1hr the acid solubility of Duchess RP and Meat Meal was 74 and 83% respectively compared to a mean 99% for the other sources. Once solubilised P is available for absorption and can occur anywhere along the intestines including the large intestine although most absorption occurs in the small intestine (Ternouth, 1990). These values for Duchess RP and Meat Meal may be compared to the 3 hr values obtained in water (3 and 25%) and citric acid (1 and 13%) respectively. The test is thus important to rank and quantify solubility. These tests have not been compared to in vivo availability but it is more likely that the 0.1M HCl solubility simulates to what happens in the digestive tract although this has to be confirmed. This concentration of HCl was chosen based on the Tilley and Terry method for in vitro dry matter digestibility where there will be some buffering of the acidic conditions when rumen digesta is added.
66
for Lomon MDCP which is close to the pH of the abomasum (2.5 – 3) (Orskov et al., 1986). The soluble inorganic form of P is absorbed under this acid condition.
At 1 hr incubation the solubility of Duchess RP and Meat Meal was lower than the 3 hr incubation and also the 3 hr incubation of the other P sources. However the difference was not great and not as large as the difference in P content between supplement types. Phosphor content will have most influence on the level of supplement to be provided so as to supply an available level of P to the animal rather than the solubility of the P source. The differences in solubility are not large compared to the differences in P content. All the other P sources were highly soluble in acid but showed variable solubility in water and citric acid. Thus solubility in water and citric acid may be misleading in determining P availability for animals.
If samples were well mixed at each sampling time, as would occur with a fixed incubation time, then a higher result would be expected. Samples were not ground and were incubated at the granule size provided by the manufacturer and this might further inhibit solubilisation especially at early incubation times. The observation that coarse rock phosphate is quickly solubilized within 1 hr provides further evidence that these samples, quickly go into solution under the HCl conditions created. It is recommended that an incubation time of 1 hr be used for the 0.1M HCl test based on the approximate time that digesta is exposed to low pH conditions within the digestive tract.
A 200kg steer will consume approximately 3kg DM/ d. If the diet is low in P (<1 g P/ kg DM) and a P supplement of 1 g P/ kg DM is needed to raise P content to approximately 2 g P/ kg DM (Freer 2007) then a P supplement needs to provide approximately 3 g P/ d. Table 3 shows the effect of the 1hr P solubility in acid and P content of supplement on the level of supplement required. Phosphor content has by far the biggest effect on the level of supplement needed. There is an effect of solubility with Duchess RP where its 1 hr solubility value was 74% and therefore, quantitatively more Duchess RP has to be added if one wanted to take solubility into account. Given the variability in supplement intake between animals when fed loose licks (Cockwill et al., 2000) this is not as important as providing enough total supplement, but nevertheless could be taken into account when comparing supplements based on cost. However if water or citrate solubility was used as an indicator then there would be much larger differences in amounts required as the solubility was much lower especially for Duchess RP and Meat Meal.
CONCLUSION
67 REFERENCES
Allen, V. G. 1984. Influence of dietary aluminium on nutrient utilization in ruminants. Journal of Animal Science, Vol. 59 No. 3: 836 - 844.
Callaghan, M. and M. Lavers. 2008. Australian Feed Phosphate Market Overview.
Cockwill, C.L., T.A. McAllister, M.E. Olson, D.N. Milligan, B.J. Ralston, C. Huisma, and R.K. Hand. 2000. Individual intake of mineral and molasses supplements by cows, heifers and calves. Canadian Journal of Animal Science, Vol. 80: 681–690.
Fluharty, F.L. 2008. Updating Phosphorus Supplementation in Ruminants to Meet the Animal’s Requirement. Reduce Excess Cost, and Reduce Environmental Concerns. http:/ / beef.osu.edu/ Neweconomics/ ReTkgPhos.pdf (5 Agustus 2009).
Freer, M. 2007. Nutrients requirements of domesticated ruminants. CSIRO Publishing.
IFP, IFP. 2003. Inorganic feed phosphate test method. Quality Feed Phosphates.
Iqbal, M.U., Q. Bilal, G. Muhammad, and M.S. Sajid. 2005. Absorption, availability, metabolism, and excretion of phosphorus in ruminants. International Journal of Agriculture and Biology., Vol. 7 No. 4: 689-693.
Niethe, G. 2008. Phosphorus Final Report on Phosphorus Forum. Meat and Livestock Australia Townsville.
NRC. 2000. Nutrient Requirements of Beef Cattle. Seventh Revised Edition, National Academy Press, Washington, D.C.
Orskov, E. R., N. A. Macleod, and D. J. Kyle. 1986. Flow of nitrogen from the rumen and abomasum in cattle and sheep given protein-free nutrients by intragastric infusion. British Journal of Nutrition, Vol. 56: 241-248.
Parish, J. A., J.D. Rivera, and H.T. Boland. 2009. Understanding the Ruminant Animal's Digestive System.
Pfeffer, E. and A. Hristov. 2005. Nitrogen and Phosphorus Nutrition of Cattle. CABI Publishing.
Scharrer, E. 1985. Phosphate absorption at different intestinal sites in the developing lamb. Quarterly Journal of Experimental Physiology, Vol. 70: 615-621.
Smuts, M., H.H. Meissner, and P.B. Cronje. 1995. Retention time of digesta in the rumen: its repeatability and relationship with wool production of Merino rams. Journal of Animal Science, Vol. 73: 206-210.