Urban Morphology at Lowland Environment in Palembang
Palembang, located on the lower basin of the Musi River, has experienced of urbanization which transformed the physical environment of urban areas. Irregular and unplanned physical growth of cities has been one of the most important problems of urban development. Low-lying area is one of most rapid growing area of the city therefore the main result of land use changes process in this area that not fully controlled was decreasing natural hydrological function and ecological value of urban areas. This paper aimed to present the form and character of urban development in its geographical setting (at lowland environment). Urban morphological approach is used in this study and the results revealed that the urban morphology analysis can provide an appropriate framework for solution of the complicated urban planning issues to achieve good quality development and at the same time maintaining the natural configuration of the environment.
Key words: urban development, lowland environment, urban morphology
---I. INTRODUCTION
Palembang, located on the lower basin of the Musi River, lowland and flood prone areas can be found in the city and the surrounding area. Musi River is the main drainage for the city and the river influenced by tides that have the difference 0.8 – 1.30 m (study at 2001). Fluctuation of the river also influences streams and swampy areas in the city.
The city has experienced of urbanization which transformed the physical environment of urban areas. In Palembang river basin area has been part of the city system. Low-lying area is one of most rapid growing area of the city therefore the main result of land use changes process in this area that not fully controlled was decreasing natural hydrological function and ecological value of urban areas.
Urban morphological approach is used in this study to understand the form and character of the city in its geographical setting. The urban morphology analysis can provide an appropriate framework for solution of the complicated issues of urban spatial planning. Moreover, urban morphological approach will be used to generate alternative urban development scenario on the basis of environmental constraints and predictions about future urbanization which are critical to the protection of ecosystems and the sustainability of communities.
sustainability to achieve good quality development. Since the city is located in a lowland environment, creating better places can improve the life of the people who live in them, and at the same time can maintain the natural configuration of the environment
II. EXPERIMENT
2.1
Study Area
.
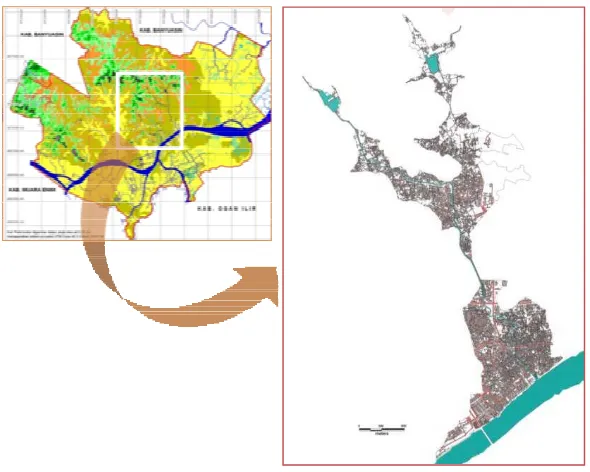
The study area is located at the densely populated and urbanized low-lying area in the heart of the city, where the growth of the city began. In accordance with the hydrological conditions, the study area belongs Bendung sub-basin, part of the Musi river system. DEM between 0.10 – 3.00 m above sea level has been delineated. Streams flows in the area and functioned as the drainage network, and all rivers and swampy areas inside are influenced by fluctuation of Musi river tide. Figure 1
shows the location of the study area in the city of Palembang.
Figure 1. Study Area Source:
Table 1. Land Use of The Study Area Source: Analysis
No Land Use Area (Ha) %
1 Greenland and reservation area 27.37 3.53 2 Wetland (swampy area, retention pond, river) 15.36 1.98 3 Residential area(settlement and housing) 585.47 75.51
4 Commercials and services 71.07 9.17
5 Public Facilities 40.36 5.20
6 Infrastructure 35.67 4.60
775.30 100.00
2.2
Identifying urban growth process at the study area
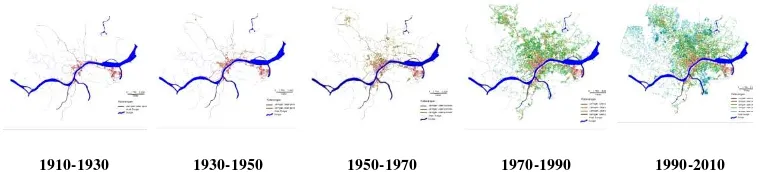
As an inner city of Palembang, the study area has experienced severe urban growth since the colonial era that resulted changes in the spatial structure of the area with respect to diverse population, morphology, and it relation to the whole city.
1910-1930 1930-1950 1950-1970 1970-1990 1990-2010
Figure 2. The growth of Palembang urban area Source: analysis
In the past, urban patterns of the study area used to be tied to the logics of the watershed, with water being one of the most important factors. The built up area, mostly dwelling, was growing alongside the river banks and stretched not far inland following the watercourses, and transport was principally carried out by ship. Urban road network was first built during the colonial era and initially constructed by considering watercourses. The built of bridge over the Musi river at the 1960s gave a big influence on the area development and increasing the accessibility of study area. River is no longer functions as the transportation mode.
III. DISCUSSION AND RESULT ANALYSIS
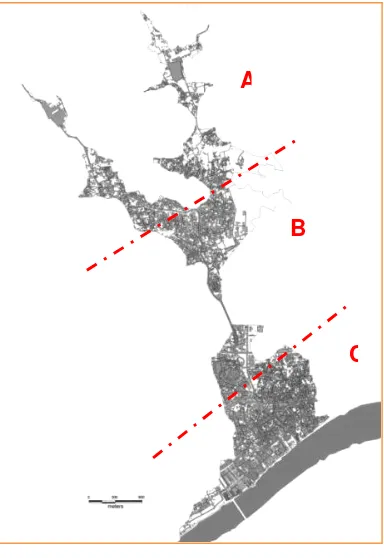
The morphological form of the study area will be identified and explored by figure ground and linked. and the area is divided into 3 zones (sub areas): Zone A (upstream area) has around
319.4
ha, Zone B (midstream) has around332.5
ha, and Zone C (downstream) has around123.3
ha area.Figure 3. 3 Zones of Study area. Source: Analyses
Figure Ground
Spatial configuration in most part of the study area on the current is influenced by the spatial intensification with random small open spaces that provides a form of densely, and the adjustment processes on land use function has associated with more informal urban development. The texture patterns of urban area will be explained by the amount of gaps in roads or by the distance between buildings.
Zone A (upstream)
In general the zone is considered as an interior area since no main roads pass by the area. The area of 118.26 ha contains 4.955 buildings and the average building size is small, mostly functioned as housing or settlements. Clustered of buildings which big in size in the area function as public, and the other buildings located along the street has commercial function for the local needs. Around 36.40% of the area is
A
B
considered as non-built spaces, mostly swampy area where many small unit of neighborhoods were founded and still intensively occupying the area.
The spatial configuration of small buildings inside the area is mostly organic, no center point and a clear pattern in the setting, and group of buildings located along the roadside tend to have more obvious pattern. This indicates that the small size buildings within the area are not long ago built, and show particular urban forms associated with the more informal development.
ZONE A ZONE B ZONE C Remarks
Building Density:
Area 319.40 ha Area 332.50 ha Area 123.30 ha Building Density
Road 5.16 ha Road 10.10 ha Road 9.44 ha ZONE GROSS NETT
Wetland 10.08 ha Wetland 2.93 ha Wetland 2.35 ha Zone A 26.00 % 57.39 %
Building (4.955 u) 47.92 ha Building (3.993 u) 45.45 ha Building (7.179 u) 76.35 ha Zone B 56..00% 64.15 %
Greenland 16.62 ha Greenland 10.75 ha Greenland 0.00 ha Zone C 62.00 % 77.35 %
Built Spaces 83.50 ha Built Spaces 70.85 ha Built Spaces 97.48 ha
Non-built spaces 36.40 ha Non-built spaces 37.25 ha Non-built spaces 13.02 ha
Building Dominance:
§ Big Buildings connected with roads having more clear pattern
§ Irregular pattern in the area tend influenced from the pattern before
Orientation
§ Building orientation
§ Area orientation
Diagram 1. Building Density, building dominance and building orientation Source: Analyses
Zone B (midstream)
The built up area 82.67 ha and contains 2.755 buildings with 31.22 ha. The average building coverage is 37.76%. Some big buildings dominated the area, most of them are functioned as public services, and some big size buildings along the main streets side are functioned as commercials. In some areas show the well planned residencial area, grid-like street pattern.
Zone C (downstream)
The downstream of Bendung is considered as the core of the city. Some part of the area is well planed, and another part is dominated by old neighborhoods which have an organic character. The built up area is 11.79 ha and contains 7.179 buildings. The total area of buildings 7.63 ha and the average building coverage is 77.35%. Some big buildings functioned as commercials and public services dominated the area. The buildings height mostly 2-3 floor (12 m) and the 4th floor of Pasar 16 is the tallest building of the area.
In the bank of Bendung as well as Musi river neighborhoods were still intensively occupying the area. Growth and development pattern of the watershed areas are not completely follow the pattern of river flows in the area. Groups of buildings which formed away from the flow direction of rivers indicated that the river is no longer functioned as a major orientation in the development of the buildings and the area.
ZONE A ZONE B ZONE C Remarks
Building Pattern:
§ Granary of small buildings spread out the area, mostly in irregular pattern.
§ Irregular pattern in the area tend to be influenced from the pattern before
§ Big buildings at the edge of Musi river & connected road network have a linier pattern
§ large group of buildings of other forms of linear patterns parallel to the main road.
§ Group of big buildings connected
with roads having more clear pattern
§ Irregular pattern in the area tend to be influenced from the pattern before
§ The residential buildings form an irregular pattern, growing organically by S.Bendung or in the inner area.
Spatial Strucure:
§ Growth pattern of the area not related with rivers
§ Rivers is no longer as orientation of the area buildings and built-up area
Diagram 2. Building Pattern and Spatial Structure Source: Analyses
Linkage
area, especially in Zone B and Zone C, and serve as a connecting with the wider city area. In Zone A the main road just passed by some locations then they were connected with the smaller roads that spread to the inside.
Small roads and pathways are linking between buildings in the neighborhood or at the riverside settlements, however, roads network is no longer developed in line with river, as seen in the past. The roads also do not have a fixed pattern, some have a grid-like patterns, but mostly irregular. The irregular shaped pattern formed in the area is no binding patterns, both from the main road up to the hierarchy of the environment. From the road hierarchy can also be concluded that the growth / movement over the area caused or influenced by the pattern formed on the inside and outside of the area.
ZONE A ZONE B ZONE C Remarks
Hier ar chy:
§ No hierarchy of main road, road, pathway.. § Movement of the area influenced by roads pattern
outside §
Pattern:
§ No fixed pattern, a grid-like patterns mostly irregular. § Pattern rof oad development not related with river flow
pattern
§ Impact to hidrological reclamation
§ Building dominance located the roads directed the growth of settlement inward
Diagram 3. Hirarchy and Pattern of Linkage Source: Analyses
Impact on the wetland
Each development will result in side effects and in many cases these caused a lot of trouble. Some typical impacts on the urban river basin and flood prone area are: the development-related changes the hydrological condition, the aspect of water pollution and over exploitation.
IV. CONCLUSSION
Lowland area in the center of Palembang is already highly urbanized, the urban problems requiring innovative and more locally adapted solutions. The needs for development in flood prone urban areas are generally justified by the areas needed for living and other social economic development. However, the dynamic land use changed processes that occurred in the area may result in disordered that give some negative influences on the development of the city.
In the socio-economic perspective, the spatial structure of the study area is influenced by the sharp population in the city because of urbanization. The relationship of population and its environment have motivated a fast and disordered urban development. The consequences of the uncontrolled urban development in the area are: disorganized and intensive growth of urban inner city, and also with illegality and informality in the occupation of the area.
The results of this study indicate that the morphology of urban area in the lowland environment in the heart of Palembang was not held to the norms of water in general. People were still intensively occupying the area which prone to inundation, non-built spaces are smaller and more fragmented, and patterns of pathway and road network development show that in areas prone to inundation has led to the more densely and fragmented urban environment.
There are many considerations to develop lowland environment for urban development, therefore ignoring some of them can threat the urban sustainability. Urban development in flood prone areas are need to developed and integrated as many more components. The tool for urban growth control is master plans, in connection with urban development, the improvement regulation of land use and zone management is one of the most comprehensive solutions, and the aim is to reduce the risks involved in the present occupation of flood-prone area.
BIBLIOGRAPHY
ADOLPHE, L. (2001). “A simplified model of urban morphology: application to an analysis of the environmental performance of cities.” Environment and Planning B: Planning and Design, 28, 183-200.
EGGEBRATEN, S (2007), Sustainable General Plans, Water-wise planning principles and polices.
ERNAWI, Imam, S. (2005). Morfologi – Transformasi dalam Ruang Perkotaan yang Berkelanjutan.
Firman, T. (2004). Major issues in Indonesia’s urban land development, Land Use Policy 21, 347–355
MOUDON, A. V. (1997): Urban morphology as an emerging interdisciplinary field.
In: Urban morphology, vol 1, pp.3-10.
NASUTION, A. D., (2005),“Prinsip dan konsep perancangan kota pada kawasan rawan bencana tsunami, Kasus: Kota-kota pantai barat daya Aceh,” Jurnal Arsitektur ATRIUM, vol. 02 no. 01, pp. 15-22.
SCHULTZ, B. (2006), “Flood management under rapid urbanisation and industrialisation in flood-prone areas: a need for serious consideration,”