Adolescents’ Homework Performance in Mathematics and Science:
Personal Factors and Teaching Practices
Rubén Fernández-Alonso
Government of the Principality of Asturias, Oviedo, Asturias, Spain, and University of Oviedo
Javier Suárez-Álvarez
University of OviedoJosé Muñiz
University of Oviedo and Biomedical Research Network in Mental Health (CIBERSAM), Madrid, Spain
Classical educational research provides empirical evidence of the positive effect of doing homework on academic results. Nonetheless, when this effect is analyzed in detail there are inconsistent, and in some cases, contradictory results. The central aim of this study was to systematically investigate the effect of homework on performance of students in mathematics and science using multilevel models. The original sample consisted of 7,725 Spanish adolescents with a mean age of 13.78 (⫾0.82) of which 7,451 were
evaluated after purging the sample of the students who did little to no homework. A 2-level hierarchical-linear analysis was performed, student and class, with 4 individual adjustment variables: gender, socioeconomic and cultural level, year repetition, and school grades, which were used to reflect previous student achievement. The individual level examined time spent, effort made, and the way homework was done. The class level considered frequency of assignment and quantity of homework. Prior knowledge, estimated using school grades, is shown to be the most important predictor of achievement in the study. Its effect is greater than the combined effect of all the other variables studied. Once background factors are controlled, the homework variables with most impact on the test are student autonomy and frequency of homework assignment by teachers. Autonomy when doing homework was shown to be the most important individual-level variable in both mathematics and science, and not effort and or time spent doing homework. The optimum duration of homework was found to be 1 hr a day.
Keywords: homework, mathematics, science, academic performance, multilevel models
The characteristics and effects of homework have been widely studied, both from a general perspective (Blazer, 2009), and spe-cific areas such as the relationship between homework and aca-demic performance (Cooper, 1989a; Cooper, Robinson, & Patall, 2006; Cooper & Valentine, 2001; Cooper, Steenbergen-Hu, & Dent, 2012; Goldstein, 1960; Paschal, Weinstein, & Walberg, 1984; Trautwein & Köller, 2003), family involvement (Hoover-Dempsey, Battiato, Walker, Reed, DeJong, & Jones, 2001; Patall,
Cooper, & Robinson, 2008; Pomerantz, Moorman, & Litwack, 2007), the role of teachers (Epstein & van Voorhis, 2001), stu-dents’ perceptions (Warton, 2001), and the way the students man-age and do their homework (Xu, 2013). Research about the rela-tionship between homework and academic performance has evolved from positivist and experimentalist positions (Goldstein, 1960) toward more integrated, comprehensive approaches (Coo-per, 1989a; Cooper et al., 2006; Paschal et al., 1984). The general conclusion of this research is that there is a positive relationship between homework and academic performance but recent work has led to a profound change in this general conclusion. Trautwein and Köller (2003) severely criticized large parts of the previous research on this topic and laid the foundations for a new generation of studies, signaling the need to use more sophisticated statistical models to allow a more rigorous analysis of the variables involved. With this new focus, the most commonly used models have been two-level hierarchical-linear models, generally student and class, although other designs are possible. These multilevel models have been used to predict academic performance (De Jong, Westerhof, & Creemers, 2000; Dettmers, Trautwein, & Lüdtke, 2009; Núñez, Vallejo, Rosario, Tuero, & Valle, 2014; Trautwein, Köller, Schmitz, & Baumert, 2002; Tymms & Fitz-Gibbon, 1992), the time spent on homework (Trautwein, 2007), the effort made (Trau-twein, Niggli, Schnyder, & Lüdtke, 2009; Trau(Trau-twein, Schnyder, Niggli, Neumann, & Lüdtke, 2009), self-regulation (Xu, 2010a), This article was published Online First March 16, 2015.
Rubén Fernández-Alonso, Department of Education, Principality of As-turias Government, Oviedo, AsAs-turias, Spain, and Department of Education Sciences, University of Oviedo; Javier Suárez-Álvarez, Department of Psychology, University of Oviedo; José Muñiz, Department of Psychology, University of Oviedo, and Biomedical Research Network in Mental Health (CIBERSAM), Madrid, Spain.
This research was funded by the Ministerio de Economía y Competi-tividad del Gobierno de España. References: PSI2011-28638, BES2012-053488. We would like to express our utmost gratitude to the Government of the Principality of Asturias (Spain), without whose collaboration this research would not have been possible. Finally, we would like to express our sincerest gratitude to the reviewers; their contributions have helped to improve considerably the final manuscript.
Correspondence concerning this article should be addressed to Javier Suárez-Álvarez, Department of Psychology, University of Oviedo, 33003 Oviedo, Spain. E-mail: suarezajavier@uniovi.es
interest in the assignments (Xu, 2008, 2011), motivation (Dett-mers, Trautwein, Lüdtke, Kunter, & Baumert, 2010; Trautwein, Lüdtke, Schnyder, & Niggli, 2006), reasons for completing home-work (Xu, 2010b), emotions felt (Dettmers, Trautwein, Lüdtke, Goetz, Pekrun, & Frenzel, 2011), behavioral strategies used (Lub-bers, Van Der Werf, Kuyper, & Hendriks, 2010), and the attitude toward subjects (Farrow, Tymms, & Henderson, 1999). Three-level hierarchical models have also been used, although less fre-quently, with fundamental designs such as student, school and system (OECD, 2013), student, class, and school (Murillo & Martínez-Garrido, 2013), and other three-level combinations (Pat-tal, Cooper, & Wynn, 2010; Trautwein & Lüdtke, 2007, 2009).
In the first multilevel study centered on the relationship between homework and academic performance Tymms and Fitz-Gibbon (1992) found differing results depending on the analysis level. In general the data indicate that, at an individual level, time spent has little effect on academic performance (De Jong et al., 2000), and in some cases there was even a negative correlation, so that the more time spent on homework, the worse the academic performance (Trau-twein, 2007; Trau(Trau-twein, Schnyder et al., 2009). Nevertheless, these three studies found a statistically significant, positive relationship at the class level, that is, the students in classes that are assigned more homework tend to have better academic results. De Jong et al. (2000) note the possibility that students with lower levels of previous knowl-edge need more time to complete their assignments, which leads to the negative correlation. Trautwein (2007) and Trautwein and Ludtke (2007) empirically confirmed this hypothesis, and found that the students that were more able, who knew more, and who had higher expectations of success tended to spend less time on their homework. On the other hand, it seems clear that the relationship between time spent doing homework and academic results is not linear (Blazer, 2009; Cooper & Valentine, 2001; Daw, 2012; Gobierno del Princi-pado de Asturias, 2013; Gobierno Vasco, 2012; Ministerio de Edu-cación, Cultura y Deporte, 2003).
Frequency of homework, in the same way as time spent on it, presents two hallmark characteristics of a multilevel situation. The meaning it has depends on the measurement level; at an individual level it indicates the student’s work habits, and taken as a class average it is an estimator of the frequency that the teacher assigns homework (Trautwein & Köller, 2003). In addition, it demonstrates differential effects depending on the level of analysis. With data aggregated by class, Farrow et al. (1999) found that frequency had a small positive effect on performance in mathematics and science, but at the student level the effect was negligible. In any case, the data point to the fact that the teacher regularly assigning homework matters more than the quantity. Trautwein (2007) and Trautwein et al. (2002) not only reported a positive association between the frequency of homework assignments and performance in mathematics, they also indicated that when the frequency is considered, the amount of the homework is no longer significant. However, frequency and time are not the only variables that affect academic performance. Dettmers et al. (2010, 2011) and Trautwein and Lüdtke (2007) indicate that effort is a better predictor of results in mathematics than either frequency or time spent. In fact effort has a central role in the theoretical model proposed by the Max Planck Institute (Trautwein et al., 2006). The relationship between effort and academic results generated a series of work aimed at studying the factors that predict effort. Curiously time does not appear to be among them, and as Trautwein (2007) indicated, the correlation between time spent on homework and effort is low and
negative. It seems that effort is more related to motivation and personality traits (Trautwein et al., 2006), the role of the teacher (Patall et al., 2010; Xu, 2011), and previous performance (Xu, 2008). Another key variable related to homework is the ability to work autonomously, that is, without parental involvement. De Jong et al. (2000) demonstrate that, after controlling adjustment variables, the effect of family help on results in mathematics is no longer statisti-cally significant. In addition, family help does not seem to be asso-ciated with either effort (Trautwein & Lüdtke, 2007) or expectations of success, (Trautwein & Lüdtke, 2009) nor with interest in or enthusiasm for doing homework (Xu, 2008). Xu (2010a) found that students who needed less help, that is, those who were more auton-omous when doing homework, achieved better results, whereas Trau-twein and Lüdtke (2007) observed that students who receive more help also spend more time and, as already noted, get worse results. Taken together, this data seems to indicate that students who need more help and therefore, are less autonomous when doing homework, tend to demonstrate more difficulties with learning, motivation and concentration, and fewer self-regulating strategies. Other studies, not using multilevel approaches, also confirm the relationship between autonomy in homework and academic achievement (Cooper, Lind-say, & Nye, 2000).
The field of the study of homework is a crossroads where psycho-logical research and the study of school effectiveness and educational improvement meet. Thanks to this combination we know that maxi-mizing the homework-result relationship requires a mix of certain individual (personal) characteristics and certain teaching practices. Psychology gives unified models that combine input from neurobiol-ogy with research on cognitive factors and personality involved in learning, highlighting the importance of prior knowledge as the prin-cipal predictive variable of future achievement (Shell, Brooks, Trainin, Wilson, Kauffman, & Herr, 2010). Failure to consider prior knowledge in research into homework could undermine any conclu-sions made (De Jong et al., 2000). At the same time, research into personality factors and student attitudes has underscored the influence of motivation and effort, autonomy and regulation of behavior, and expectations about homework and the role of conscientiousness when it comes to optimizing the homework-result relationship (Lubbers et al., 2010; Trautwein et al., 2006; Trautwein & Ludtke, 2009; Xu, 2008; Zimmerman, 2001; Zimmerman & Kitsantas, 2005). Research on school effectiveness has also been concerned with the effect of teaching practices related to assignment, frequency, and other char-acteristics of homework. Scheerens, Witziers, and Steen (2013) used a concept of curriculum quality that includes three variables: oppor-tunity to learn, effective learning time, and homework. Although in their meta-analysis the estimated mean effect size of homework is moderate (0.073), the value placed on homework in teaching practices is notable. As Dettmers et al. (2010) noted, homework works only so far as the teacher assigns work of sufficient quality.
models will allow a much more precise, rigorous analysis of the complex relationships between homework and academic performance (Vallejo Seco, Ato García, Fernández García, & Livacic Rojas, 2013). This is the first study on homework carried out on a large sample of Spanish adolescents that combines the application of multilevel els and the psychometric advantages of Item Response Theory mod-els. Homework is a significant part of the day to day lives of millions of students, parents, and teachers all over the world. Providing new data on homework in a southern European population gives added confirmatory value, bearing in mind the current debate in psychology and education on the need for accumulative and replicable science (Koole & Lakens, 2012; Nosek & Lakens, 2014). We hope, therefore, that our work can contribute to a crosscultural consolidation of current research into homework.
Method
Participants
The sample was made up of 7,725 students in the second year of obligatory secondary education in the Principality of Asturias, a region in the north of Spain. The mean age was 13.78 with a SD of 0.82. Girls made up 47.2% of the sample; 90.6% were Spanish nationals; and 72.9% were in the standard school year for their age whereas 27.1% were 1 or 2 years behind in relation to their age. The students were from 353 classes belonging to 148 schools. Technically this is the population as the evaluation was carried out on all of the registered students at the level studied in this geographical region in the academic year 2010 –2011.
Procedure
The tests were performed within the official annual Principality of Asturias educational system evaluation program. Test management within each school was provided by the school authorities. The questionnaires and tests were given by active teachers in accordance with the Instructions for the development of diagnostic evaluation, set by the Department of Education of the Principality of Asturias Gov-ernment. Each student completed a mathematics and science test with 24 items for each subject, as well as a questionnaire for homework evaluation.
Instruments
Questionnaire for homework evaluation. The total daily time dedicated to homework was calculated from two multiple choice items on the questionnaire. The first asked about the frequency that homework was done, the options were (a) never, (b) 2 or 3 days per week, (c) almost every day, and (d) every day. The second item asked about the total time spent on homework considering all subjects, the options were (a) less than 30 min, (b) between 30 and 60 min, (c) between 60 and 120 min, and (d) more than 120 min. For the second level analysis, the means of these variables for each class were calculated as estimators of the frequency of homework assignment by teachers and the amount of homework, respectively.
Effort was measured using three items (I make an effort to get good marks, I finish my homework even if they are difficult or they take me a long time, and I am careful to keep my notebooks and work neat and tidy) where 1 ⫽means never or almost never and 4⫽always or
almost always. Analysis of the principal components showed that these items conform to an essentially unidimensional scale (the first factor accounts for almost 64% of the common variance). In addition, the Cronbach’s␣coefficient (␣ ⫽.71) seems appropriate considering
that the scale is only composed of three items.
The way homework was done was evaluated using the question “How do you do your school assignments?” The options were (a) without help, (b) I occasionally need help, (c) I often need help, and (d) I always need help. A binary variable was constructed from this item where 1 signifies doing homework without help or occasional help and 0 signifies those who need frequent or constant help.
Tests of academic performance: Mathematics and science.
Academic performance was measured using a test that evaluated mathematics and science, the detailed description of the content may be found in Gobierno del Principado de Asturias (2012). An item bank was created that was purified through a pilot study and following the protocol established by Fernández-Alonso (2005). Finally, 192 items were selected (96 mathematic and 96 science). There were three item formats used: multiple choice, short open-ended answer, and essay. The item pool was distributed in eight test booklets in accor-dance with the matrix design given in Fernández-Alonso and Muñiz (2011). Each student was presented with a test booklet containing 48 items (24 mathematics and 24 sciences) that they completed in two sessions of 50 min each with a break in between.
Given that the group of items was constructed to measure two competences (mathematics and science), the item pool was adjusted to a two-dimensional item response model. It was assumed that each item saturated in one and only one of the dimensions, for which a two-dimensional model among items was chosen (multidimensional between-item tests). The fitting of the bank was conducted with the ConQuest 2.0 program (Wu, Adams, Wilson, & Haldane, 2007). For the initial calibration of items, 2,000 subjects were selected from the total sample. This ensured that each item was responded to by 500 subjects. Once the adjustment of the items to the model was checked, the parameters of these were estimated. These parameters were used as initial values to calculate the score of the subjects on each compe-tence in function of the response to the items. Finally, the marks were transformed to a scale with a mean of 500 and a SD of 100. The difficulty indexes of the tests comprise the entire possible rank of scores, both easy items and difficult items, although most of them (around 40%) were concentrated on the middle range of the distribu-tion of difficulty. The mean Cronbach’s␣ coefficient of the eight
booklets was 0.85 (with a minimum of 0.82 and a maximum of 0.88).
system): fail (0 points), pass or good (1 point), very good (2 points), and outstanding (3 points).
Data Analyses
First, to study students’ homework behavior, descriptive statistics and Pearson correlations were calculated. Second, a multilevel anal-ysis was performed to study the effect of homework on academic performance. With the aim of improving the representation of stu-dents who actually do the assigned homework, the 2.4% of stustu-dents who never do homework were removed from the analysis (see Figure 1). For this reason, the multilevel analyses looked at 7,451 students rather than the 7,725 originally evaluated. A sequence of five hierarchical-linear models was constructed by subject (mathematics and science). These are models of random two-level coefficients: student and class (Raudenbush & Bryk, 2002). Each new model increases in complexity given that new explanatory variables are added while keeping those in the previous model. The modeling strategy used HLM 6.03 software (Raudenbush, Bryk, Cheong, & Congdon, 2004). HLM does not give standardized regression coeffi-cients, therefore the data presented in this study are presented in two ways: the original scale N(500, 100) and the normalized scale N(0, 1). The former is used in the graphics and shows the predictions of results
at the true scale. The normalized data are presented in the tables and is interpreted as a standardized coefficient of ordinary regression analysis. The range of missing values in the variables varied between 5% and 12%. To impute missing values, two methods were used depending on the type of missing data presented: when a case was incomplete the data point was replaced by the mean of the person, whereas for completely missing data we used a procedure of multiple imputation with auxiliary variables in the SPSS program (IBM Corp, 2011). Fernández-Alonso, Suárez-Álvarez, and Muñiz (2012) found that use of this combination is especially recommended when data loss is greater, and its loss mechanism is more conditioned.
Results
Completion of Homework by the Students
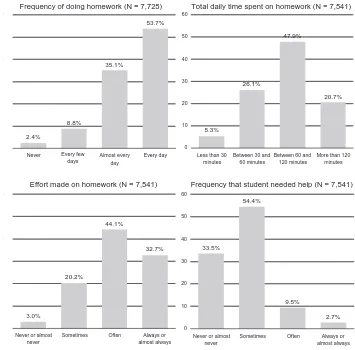
Figure 1 shows the frequency distribution of the items describ-ing the completion of homework by the students. As can be seen, the students spend, on average, between 1 and 2 hr doing home-work from all subjects.
The total amount of homework assigned by teachers is a little over 70 min a day (see Table 1). According to Murillo and
0 10 20 30 40 50 60
Never Every few days
Almost every day
Every day
0 10 20 30 40 50 60
Never or almost never
Sometimes Often Always or almost always 0
10 20 30 40 50 60
Less than 30 minutes
Between 30 and 60 minutes
Between 60 and 120 minutes
More than 120 minutes
0 10 20 30 40 50 60
Never or almost never
Sometimes Often Always or almost always
Frequency of doing homework (N = 7,725)
Frequency that student needed help (N = 7,541) Effort made on homework (N = 7,541)
Total daily time spent on homework (N = 7,541)
2.4%
8.8%
35.1%
53.7%
5.3%
26.1%
47.9%
20.7%
3.0%
20.2%
44.1%
32.7% 33.5%
54.4%
9.5%
2.7%
Martinez-Garrido (2013) in Spanish-speaking countries, including Spain, homework assignments are usually paper and pencil tasks such as complementary lectures (81.5% of teachers assign this kind of homework often or very often), problems to solve (66.3% of teachers assign often or very often), write an essay or research (53.1% often or very often), and small research or experiments (44%). According to this data, the teachers show a certain unifor-mity in the practice of assigning homework meaning that the difference in the time taken to do homework variable is more about the student’s level (i.e., 94.6% of the variance is because of the difference in student commitment and only 6.4% is because of differing homework practices on the part of the teachers). This latter value is slightly lower than the international mean in PISA 2003 (7.6%) and slightly higher than the Spanish estimate (5.4%) in that same study (Dettmers et al., 2009).
Multilevel Models to Predict Academic Performance
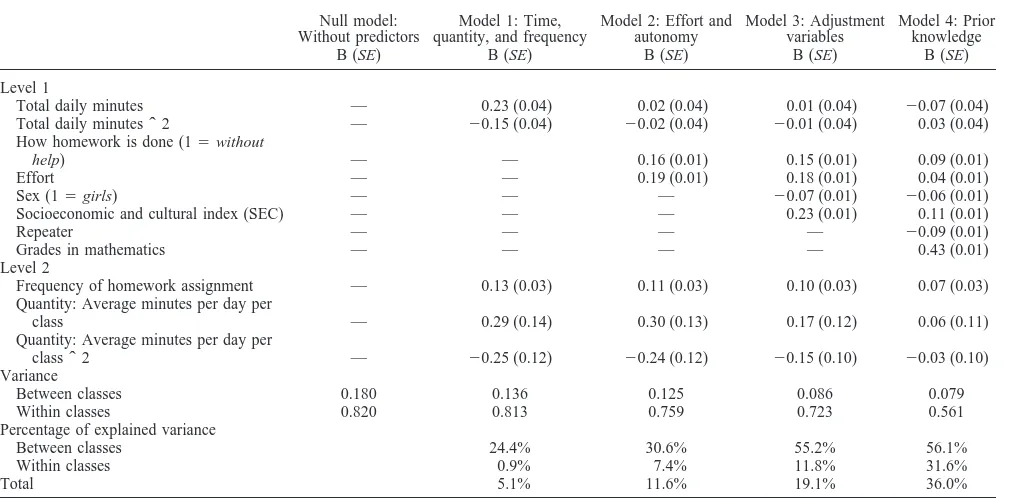
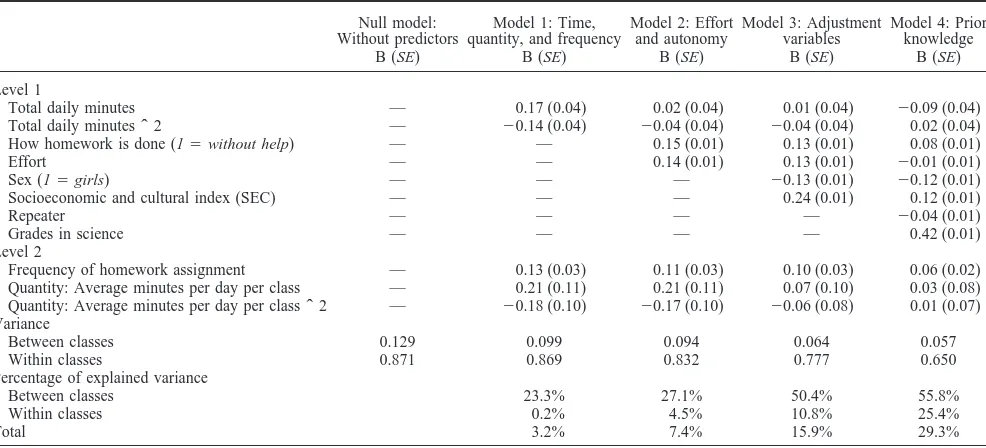
Tables 2 and 3 show the results of the hierarchical-linear models. The null model, without independent variables, indi-cates that 82% of the variance of results in mathematics and 87.1% of results in science are found in Level 1 (students), while the variance between classes is 18% in mathematics and 12.9% in science. Model 1 includes the variables time spent, frequency of assignment, and amount of homework. In the first place, it confirms that both the time-result relationship and the amount-result relationship are curvilinear. In both cases the effect of the quadratic element is statistically significant (95% confidence interval [CI]) albeit negative. In other words, there is an optimal amount of, and time to spend on, homework and once that threshold is passed, the time spent and the amount of Table 1
Descriptive Statistics and Pearson Correlations of the Variables
M SD 1 2 3 4 5 6 7 8 9 10 11
1. Homework time (total daily minutes) 73.24 39.09 —
2. Effort 2.08 0.71 .51 —
3. How homework is done (1⫽without help) 0.88 0.33 ⫺.05 .08 —
4. Sex (1⫽girl) 0.48 0.50 .15 .19 .00 —
5. Socioeconomic and cultural index (SEC) 12.41 3.51 .14 .19 .06 ⫺.02 —
6. Repeater (1⫽yes) 0.26 0.44 ⫺.28 ⫺.36 ⫺.11 ⫺.07 ⫺.34 —
7. Prior knowledge in mathematics 1.36 0.88 .21 .38 .17 .03 .32 ⫺.46 —
8. Prior knowledge in science 1.59 0.92 .28 .46 .17 .06 .38 ⫺.55 .70 —
9. Score in mathematics 501.7 99.9 .13 .26 .18 ⫺.03 .35 ⫺.39 .57 .55 —
10. Score in science 501.3 99.9 .07 .18 .16 ⫺.11 .32 ⫺.32 .47 .50 .66 —
11. Frequency of homework assignment (class) 2.39 0.27 .23 .21 .02 .04 .17 ⫺.19 .15 .20 .20 .17 —
12. Homework time (class) 72.48 13.46 .32 .21 ⫺.02 .05 .18 ⫺.18 .11 .17 .18 .14 .76
Table 2
Hierarchical-Linear Models to Predict Mathematics Performance
Null model: Without predictors
Model 1: Time, quantity, and frequency
Model 2: Effort and autonomy
Model 3: Adjustment variables
Model 4: Prior knowledge
B (SE) B (SE) B (SE) B (SE) B (SE)
Level 1
Total daily minutes — 0.23 (0.04) 0.02 (0.04) 0.01 (0.04) ⫺0.07 (0.04)
Total daily minutes ˆ 2 — ⫺0.15 (0.04) ⫺0.02 (0.04) ⫺0.01 (0.04) 0.03 (0.04)
How homework is done (1⫽without
help) — — 0.16 (0.01) 0.15 (0.01) 0.09 (0.01)
Effort — — 0.19 (0.01) 0.18 (0.01) 0.04 (0.01)
Sex (1⫽girls) — — — ⫺0.07 (0.01) ⫺0.06 (0.01)
Socioeconomic and cultural index (SEC) — — — 0.23 (0.01) 0.11 (0.01)
Repeater — — — — ⫺0.09 (0.01)
Grades in mathematics — — — — 0.43 (0.01)
Level 2
Frequency of homework assignment — 0.13 (0.03) 0.11 (0.03) 0.10 (0.03) 0.07 (0.03)
Quantity: Average minutes per day per
class — 0.29 (0.14) 0.30 (0.13) 0.17 (0.12) 0.06 (0.11)
Quantity: Average minutes per day per
class ˆ 2 — ⫺0.25 (0.12) ⫺0.24 (0.12) ⫺0.15 (0.10) ⫺0.03 (0.10)
Variance
Between classes 0.180 0.136 0.125 0.086 0.079
Within classes 0.820 0.813 0.759 0.723 0.561
Percentage of explained variance
Between classes 24.4% 30.6% 55.2% 56.1%
Within classes 0.9% 7.4% 11.8% 31.6%
homework stop being effective and end up being detrimental (see Figure 2).
The top of the curve is between 90 and 100 min per day of homework for all subjects combined and this may be considered the most effective amount of time, as from this point on results begin to decline. However, the most effective is not always the most efficient. For example, for students in classes where the amount of homework is 50 min, results in the middle of the scale (i.e., 504 points in science) are predicted. The gain expected in science for students in classes where the amount of homework is 70 min is around an eighth of a SD (517 points) but the gains between 70 and 90 min barely reach 3% of a SD. That small gain requires 2 hr more homework per week, which is a large time investment for such small gains. For that reason, assigning more than 70 min homework per day does not seem very efficient, as the expectation of improved results is very low. In the case of math-ematics the curve is more pronounced but the interpretation is
similar: around 1 hr a day of homework seems to be sufficient time to achieve satisfactory results.
As can be seen in Tables 2 and 3, the frequency of assignment gives results consistent with Model 1: more frequent homework assignment, better results. In contrast, the amount of homework gives more erratic results. Although in mathematics the effect of homework volume is significant, in the case of science, the value is at the limit of statistical significance (p⫽.063). In short, Model
1 indicates that, keeping the other variables constant, a difference of near 50 points is predicted between those students in classes where the teachers systematically assign homework and those students in classes where homework is assigned occasionally or sporadically. The predictions of Model 1 seem reasonable, al-though the percentage of variance it explains (especially the vari-ance within the classes) is small. That suggests the existence of other factors related to homework that account for the differences between the classes and the students.
Model 2 explores the role of the two individual variables not related to time: effort and needing help to do homework. This model shows that both effort and autonomy in doing homework have more explanatory power than the variables considered in the previous model. In fact, time spent loses statistical significance whereas the variables related to teaching practice in terms of homework hardly change compared with the previous model. Finally, Model 2 explains twice the total variance that Model 1 does. This explanatory gain is produced in the variance within the centers, which confirms that the effort and the way the homework is done is more important than the time spent, the frequency or the amount of homework. Figure 3 shows the prediction for mathe-matics according to the need for help with homework, supposing constant effort by students and homework assigned daily by the teacher.
Figure 3 allows two interpretations to be made. First, student autonomy is more effective as it predicts 54 points more than for Table 3
Hierarchical-Linear Models to Predict Science Performance
Null model: Without predictors
Model 1: Time, quantity, and frequency
Model 2: Effort and autonomy
Model 3: Adjustment variables
Model 4: Prior knowledge
B (SE) B (SE) B (SE) B (SE) B (SE)
Level 1
Total daily minutes — 0.17 (0.04) 0.02 (0.04) 0.01 (0.04) ⫺0.09 (0.04)
Total daily minutes ˆ 2 — ⫺0.14 (0.04) ⫺0.04 (0.04) ⫺0.04 (0.04) 0.02 (0.04)
How homework is done (1⫽without help) — — 0.15 (0.01) 0.13 (0.01) 0.08 (0.01)
Effort — — 0.14 (0.01) 0.13 (0.01) ⫺0.01 (0.01)
Sex (1⫽girls) — — — ⫺0.13 (0.01) ⫺0.12 (0.01)
Socioeconomic and cultural index (SEC) — — — 0.24 (0.01) 0.12 (0.01)
Repeater — — — — ⫺0.04 (0.01)
Grades in science — — — — 0.42 (0.01)
Level 2
Frequency of homework assignment — 0.13 (0.03) 0.11 (0.03) 0.10 (0.03) 0.06 (0.02)
Quantity: Average minutes per day per class — 0.21 (0.11) 0.21 (0.11) 0.07 (0.10) 0.03 (0.08) Quantity: Average minutes per day per class ˆ 2 — ⫺0.18 (0.10) ⫺0.17 (0.10) ⫺0.06 (0.08) 0.01 (0.07)
Variance
Between classes 0.129 0.099 0.094 0.064 0.057
Within classes 0.871 0.869 0.832 0.777 0.650
Percentage of explained variance
Between classes 23.3% 27.1% 50.4% 55.8%
Within classes 0.2% 4.5% 10.8% 25.4%
Total 3.2% 7.4% 15.9% 29.3%
those students who need frequent or constant help. In addition, dependent students hardly score more than the average despite showing significant commitment. Second, autonomous students are more effective, especially at higher levels of ability. For example, to score 475 points, a dependent student would need, on average, 30 min per day more than an autonomous student. How-ever, to score 500 points the dependent student would have to spend 41 min more than the autonomous student. In other words, a dependent student who spends 70 min a day on homework would expect results in the 50th percentile whereas an autonomous stu-dent who spends the same amount of time would expect to score in the 70th percentile. In science, the curve follows the same pattern as in mathematics, while noting that students who do homework without help are predicted to score 500 points with less than 25 min per day, the difference between student profiles is greater: to score 500 points, a student who needs help with home-work spends 50 min more per day than a student who does homework without help.
Model 3 (see Tables 2 and 3) includes the two sociological adjustment variables. SEC is shown to be the variable with the most explanatory power, as the homework variables at an individ-ual level see little variation. At the classroom level, the amount of homework loses its statistical significance definitively, and only the frequency of assignment retains its positive, significant effect (95% CI) in both subjects. It should also be noted that, with the inclusion of sociological adjustment variables, the total percentage of variance explained increases significantly in both mathematics and science, doubling in the latter case.
Finally, including the variables of previous academic achieve-ment in Model 4, the results vary substantially. Prior knowledge, estimated using school grades, is shown to be the most important predictor of achievement in the test. Its effect is greater than the combined effect of all the other variables in the previous models. Furthermore, on the inclusion of variables of previous achieve-ment, the effect of SEC is halved, which serves as a note of caution about the relationship between SEC and school grades. In terms of the homework variables, it should be noted that first, the relation-ship between results and homework time is, once again, negative, beyond statistical doubt in the case of science, and on the limit of statistical significance in the case of mathematics (p⫽.07). These
results may be interpreted in the following way: once background factors are controlled, those students who spend more time are
possibly those who have bigger gaps in their learning or problems concentrating. Autonomy, that is, doing homework without paren-tal involvement was shown to be the most important individual level variable, it is, after all, the only variable related to student behavior toward homework that is significant, both in mathematics and in science. The homework effort variable gave an unexpected result: in science it lacks statistical significance and in mathemat-ics its effect is significantly reduced on the inclusion of the previous achievement variables. Finally, at a classroom level, the frequency of homework assignment, while having a reduced ef-fect, retains its significance.
As a whole the results may be interpreted as follows: once the adjustment variables are controlled, the homework variables with most impact on the test are doing homework without help and frequency of homework assignment by teachers. Discounting the adjustment factors and all the homework related variables (includ-ing do(includ-ing homework autonomously) the results of the students who attend classes in which homework is assigned daily are predicted to exceed the forecasted mean for students in classes with less frequently assigned homework by 15% of the SD. If the condition of doing homework autonomously is added to that, this difference is increased over a quarter (27%) of the SD.
The previous estimations do not take into account that compared with students who need frequent or constant help, students who do homework without parental involvement make more effort and spend less time on homework (a variable that is negatively asso-ciated with success). Figure 4 looks at all of these circumstances. It is clear that, once the adjustment variables are controlled, the difference in terms of frequency of homework assignment is close to 20 points, whereas the difference between students who need help with homework and those who do not is around 30 points. Therefore, the combined effect of variables related to student behavior toward homework and teaching practices on school grades may cause differences in the region of 50% of the SD in the scale of school results. The results in science are not presented in the chart but the combined effect of these variables is a little more moderate and is about 40% of the SD.
Discussion and Conclusions
The results of the study agree with those found in studies from Germany (Trautwein, 2007; Trautwein et al., 2002), Great Britain (Farrow et al., 1999), The Netherlands (De Jong et al., 2000), Switzerland (Trautwein, Schnyder et al., 2009), and others in Spain (Gobierno de Aragón, 2010; Gobierno Vasco, 2012). The results of the multilevel models have important practical implica-tions. First, Model 1 confirms that the relationship between home-work and academic results is not linear, something already raised by Cooper and Valentine (2001) and Daw (2012). The data suggest that spending 60 min per day doing homework is a reasonable and effective time. Furthermore, the results indicate that both the quantity of homework and the frequency of assignment are related to academic results. In any case, the predominance of frequency over quantity of homework is consistent with the data from Trau-twein (2007) and TrauTrau-twein et al. (2002) and is closer to the standpoint of Farrow et al. (1999), showing that the effect of homework quantity is small. It is worth stressing that the explan-atory power of this model is moderate (little more than 6% of the total variance), in line with that noted by De Jong et al. (2000).
Model 2 looks at the impact of effort and the amount of help needed to do homework. The conclusion is that when it comes to homework how is more important than how much. Once individual effort and autonomous working is considered, the time spent becomes irrelevant. This data is consistent with the central position of effort in predicting academic performance (Dettmers et al., 2010, 2011; Trautwein & Lüdtke, 2007). In addition, autonomy when doing homework may be linked to processes of self-regulation and these have been found to be positively associated with performance (Xu, 2010a). Our multilevel analysis confirms correlations that have been published by some Spanish educational authorities, which indicate that students who need frequent or constant help with homework have worse academic results (Go-bierno de Aragón, 2010; Go(Go-bierno Vasco, 2012).
This reading, together with Models 3 and 4 confirms that to study the relationship between homework and academic perfor-mance, it is necessary to include adjustment variables as they give the models the added value of school effectiveness (Schereens, 1992). The inclusion of adjustment variables in studies of home-work is essential for at least two reasons. First, because of their explanatory power, something that is clear when comparing the variance explained by the latter model compared with the previous ones. Second, because our data agree with that of De Jong et al. (2000) and Dettmers et al. (2009), which showed that not consid-ering adjustment variables may undermine the results of the study. Regardless, separating the adjustment variables into two different models (on the one hand, sociological factors, and on the other, previous achievement) allows two interpretations of the data that would have been difficult to see if all of the background variables had been together in one model. First, it can be seen that the inclusion of sociological variables in Model 3 has hardly any impact on the homework variables (with the exception being the definite loss of significance of the amount of homework). How-ever, when previous achievement is included in Model 4 the results
vary significantly, suggesting that behavior toward homework is more closely related to school experience than sociological vari-ables. Second, it should be pointed out that the inclusion of previous achievement reduces the effect of SEC to half its previous value. The data seems to indicate that, within the adjustment variables, a student’s school history has a larger effect on behavior toward homework than social origin, and this data is consistent with that found in Suárez-Álvarez, Fernández-Alonso, and Muñiz (2014).
Some conclusions may be drawn in relation to the results from Model 4. From the Level 2 factors, the principal conclusion is that the frequency of homework assignment (but not the amount of homework) has statistical significance both in mathematics and in science. This result is consistent with that described by Farrow et al. (1999) and with the findings of Trautwein (2007) and Trau-twein et al. (2002), which showed that when frequency is consid-ered, the effect of the amount of homework loses statistical sig-nificance. This data is also compatible with evidence on the potentially positive effects of teachers’ homework policies (Buijs & Admiraal, 2013; Dettmers et al., 2010; Epstein & van Voorhis, 2001; Patall et al., 2010).
In terms of Level 1 variables, three conclusions stand out. First, when background factors are considered, the time spent on home-work becomes negative, which is in line with the results from Trautwein (2007), Trautwein and Ludtke (2007), and Trautwein, Schnyder et al. (2009). In addition, autonomy, that is, doing homework without parental involvement, is the homework behavior-related variable with the best connection to results. This data compares with conclusions by Xu (2010a), and is consistent with theories that emphasize the role of self-control in the learning process (Zimmerman & Kitsantas, 2005). Finally, it should be noted that once prior knowledge is discounted, the homework effort variable presents a small effect in mathematics and no effect in science. This data contradicts the central position of effort in the 478
486
496 506
515
525
470 500 530
Sometimes Often Always
Dependent
Autonomous
S
c
o
re
on
m
at
hem
a
ti
c
s
tes
t
Frequency of homework assignments Effect of teaching practice: groups that do
daily homework almost 20 more points are predicted
Effect of student behavior: Students who do not need help get almost 30 points higher than students who need help (considering that students who do not need help make more effort and spend less time)
Need help
Without help
model of Trautwein et al. (2006), and the conclusions drawn by Dettmers et al. (2010, 2011). Looking at the correlation matrix (see Table 1) it is worth noting that our effort measure is high and positively correlated with homework time (r ⫽ .51), whereas
Trautwein (2007) indicated that these variables are independent. In addition, effort shows a better correlation with the teachers’ scores than with the results in the test. This is more pronounced in science. Although colinearity between homework effort and teach-ers’ scores has been ruled out, there is covariation between these two variables. The teachers very probably consider the students’ efforts in their scores that would explain why this effect loses significance when school grades are controlled for. This result indicates that school grades may produce some bias when used as estimators of previous knowledge. According to data from the Gobierno del Principado de Asturias (2010) only a small propor-tion of teachers assign school grades based exclusively or mainly on results of standardized achievement tests. The majority also consider other aspects, such as behavior, interest, participation, and effort. For 40% of teachers these aspects together are given as much or more weight than standardized achievement tests when assigning school grades. Furthermore, as indicated by Trautwein, Schnyder et al. (2009), school grades are not strictly comparable between classrooms, as teachers assign them with reference to the class group level and not the total student population. Although school grades have the advantage of being easy to obtain, objective measures of previous achievement based on ad hoc tests seem more appropriate (Murillo & Martínez-Garrido, 2013; Trautwein, 2007).
Finally, to appropriately interpret the results, some consider-ation must be made of the study’s limitconsider-ations. As Trautwein and Lüdtke (2009) noted, the word “effect” must be understood as “predictive effect.” In other words, it is possible to say that effort doing homework is connected to performance; however, it is not possible to say in which direction the association runs. In fact the data presented are correlations and as such one can only speak of an association between variables and not of directionality in the analysis. In addition, the sample was restricted to students around 13-years old and as noted by Cooper (1989a, 1989b), the strength of the homework-results relationship depends in large part on the student’s age.
One of the limitations of the study is that the items referring to homework are generic, they do not distinguish between the two subjects being evaluated, mathematics and science. There is evi-dence that indicates that behavior, motivation and emotions about homework can vary between subjects (Goetz, Nett, Martiny, Hall, Pekrun, Dettmers, & Trautwein, 2012; Trautwein & Lüdtke, 2007; Trautwein et al., 2006). Therefore, for example, motivation has a pattern associated with gender; boys demonstrate more expectancy and task value in physics-mathematics subjects, and girls demon-strate more effort in communicative-linguistic subjects (Trautwein & Lüdtke, 2009).
Nonetheless, when the dependent variables are school results the differences between subjects are not so clear. Lubbers et al. (2010) separated homework time in language and mathematics and found that the effects of both variables were equal for predicting achieve-ment in the two subjects. Chang, Wall, Tare, Golonka, and Vatz (2014) have highlighted the same pattern in relation to homework time-achievement in a variety of foreign languages, and Goetz et al. (2012) reported similar correlations between academic results,
emotions, and self-concept in four different subjects. Bearing in mind that our target variables are achievement in subjects that are somewhat associated with each other, mathematics and science, it is not unreasonable to consider that the results would not have varied much even if the homework related variables had been separated by subject. Nevertheless, in future studies it will be worth distinguishing between subjects for homework related vari-ables.
Furthermore, it should be mentioned that the analysis models presented were focused on the study of students’ behavior when doing homework and in the teachers’ homework assignment prac-tices and it might be worth exploring a study based on a compre-hensive theoretical framework as proposed by Cooper (1989a); Trautwein et al. (2006) and Xu (2008), which would allow the inclusion of all the relevant variables to academic performance, such as motivation and interest in the homework (Dettmers el al., 2010; Xu, 2008, 2011), self-sufficiency (Zimmerman & Kitsantas, 2005), and self-regulation (Rosário, Lourenço, Paiva, Rodrigues, Valle, & Tuero-Herrero, 2012; Xu, 2010a). The inclusion of these variables will certainly improve the explanatory power of the model.
References
Blazer, C. (2009). Literature review: Homework. Miami, FL: Miami Dade County Public Schools. Retrieved from http://drs.dadeschools.net/ LiteratureReviews/Homework.pdf
Buijs, M., & Admiraal, W. (2013). Homework assignments to enhance student engagement in secondary education. European Journal of
Psy-chology of Education, 28, 767–779.
http://dx.doi.org/10.1007/s10212-012-0139-0
Chang, C. B., Wall, D., Tare, M., Golonka, E., & Vatz, K. (2014). Relations of attitudes toward homework and time spent on homework to course outcomes: The case of foreign language learning. Journal of
Educational Psychology, 106, 1049 –1065. http://dx.doi.org/10.1037/
a0036497
Cooper, H. (1989a). Homework. White Plains, NY: Longman. http://dx.doi .org/10.1037/11578-000
Cooper, H. (1989b). Synthesis of research on homework. Educational
Leadership, 47, 85–91.
Cooper, H., Lindsay, J. J., & Nye, B. (2000). Homework in the home: How student, family, and parenting-style differences relate to the homework process. Contemporary Educational Psychology, 25, 464 – 487. http://dx .doi.org/10.1006/ceps.1999.1036
Cooper, H., Robinson, J. C., & Patall, E. A. (2006). Does homework improve academic achievement? A synthesis of research, 1987–2003.
Review of Educational Research, 76, 1– 62. http://dx.doi.org/10.3102/
00346543076001001
Cooper, H., Steenbergen-Hu, S., & Dent, A. L. (2012). Homework. In K. R. Harris, S. Graham, & T. Urdan (Eds.), APA educational
psychol-ogy handbook, Volume 3: Application to learning and teaching. (pp.
475– 495). Washington, DC: American Psychological Association. Cooper, H., & Valentine, J. C. (2001). Using research to answer practical
questions about homework. Educational Psychologist, 36, 143–153. http://dx.doi.org/10.1207/S15326985EP3603_1
Daw, J. (2012). Parental income and the fruits of labor: Variability in homework efficacy in secondary school. Research in Social
Stratifica-tion and Mobility, 30, 246 –264. http://dx.doi.org/10.1016/j.rssm.2012
.01.004
De Jong, R., Westerhof, K. J., & Creemers, B. P. M. (2000). Homework and student math achievement in junior high schools. Educational
Re-search and Evaluation, 6, 130 –157.
http://dx.doi.org/10.1076/1380-3611(200006)6:2;1-E;F130
Dettmers, S., Trautwein, U., Lüdtke, M., Kunter, M., & Baumert, J. (2010). Homework works if homework quality is high: Using multilevel mod-eling to predict the development of achievement in mathematics. Journal
of Educational Psychology, 102, 467– 482. http://dx.doi.org/10.1037/
a0018453
Dettmers, S., Trautwein, U., & Lüdtke, O. (2009). The relationship between homework time and achievement is not universal: Evidence from multilevel analyses in 40 countries. School Effectiveness and
School Improvement, 20, 375– 405. http://dx.doi.org/10.1080/
09243450902904601
Dettmers, S., Trautwein, U., Lüdtke, O., Goetz, T., Frenzel, A., & Pekrun, R. (2011). Students’ emotions during homework in mathematics: Test-ing a theoretical model of antecedents and achievement outcomes.
Contemporary Educational Psychology, 36, 25–35. http://dx.doi.org/
10.1016/j.cedpsych.2010.10.001
Epstein, J. L., & van Voorhis, F. L. (2001). More than minutes: Teachers’ roles in designing homework. Educational Psychologist, 36, 181–193. http://dx.doi.org/10.1207/S15326985EP3603_4
Farrow, S., Tymms, P., & Henderson, B. (1999). Homework and attain-ment in primary schools. British Educational Research Journal, 25, 323–341. http://dx.doi.org/10.1080/0141192990250304
Fernández-Alonso, R. (2005). Assessment of mathematical performance (Unpublished doctoral dissertation). University of Oviedo, Spain.
Fernández-Alonso, R., & Muñiz, J. (2011). Diseño de cuadernillos para la evaluación de las competencias básicas [Booklet designs for the evalu-ation of basic skills]. Aula Abierta, 39, 3–34.
Fernández-Alonso, R., Suárez-Álvarez, J., & Muñiz, J. (2012). Imputación de datos perdidos en las evaluaciones diagnósticas educativas [Imputa-tion methods for missing data in educa[Imputa-tional diagnostic evalua[Imputa-tion].
Psicothema, 24, 167–175.
Gobierno de Aragón. (2010). Evaluación de diagnóstico en Aragón 2010 [Diagnostic evaluation in Aragon 2010]. Zaragoza: Departamento de Educación, Cultura y Deporte.
Gobierno del Principado de Asturias. (2010). Evaluación de Diagnóstico
Asturias 2009 [Diagnostic evaluation in Asturias 2009]. Oviedo:
Con-sejería de Educación y Ciencia. Retrieved from http://www.educastur .es/media/institucional/calidad/diagnostico_ast09/ED_2009.pdf Gobierno del Principado de Asturias. (2012). Evaluación de Diagnóstico
Asturias 2011 [Diagnostic evaluation in Asturias 2011]. Oviedo:
Con-sejería de Educación, Cultura y Deporte.
Gobierno del Principado de Asturias. (2013). Evaluación de Diagnóstico
Asturias 2012 [Diagnostic evaluation in Asturias 2012]. Oviedo:
Con-sejería de Educación, Cultura y Deporte.
Gobierno Vasco. (2012). Evaluación diagnóstica. Informe de resultados y
análisis de variables 2° educación secundaria obligatoria [Diagnostic
evaluation. Report results and analysis of variables 2nd compulsory secondary education]. Bilbao: Instituto Vasco de Evaluación e Investi-gación Educativa.
Goetz, T., Nett, U. E., Martiny, S. E., Hall, N. C., Pekrun, R., Dettmers, S., & Trautwein, U. (2012). Students’ emotions during homework: Struc-tures, self-concept antecedents, and achievement outcomes. Learning
and Individual Differences, 22, 225–234. http://dx.doi.org/10.1016/j
.lindif.2011.04.006
Goldstein, A. (1960). Does homework help? A review of research. The
Elementary School Journal, 60, 212–224. http://dx.doi.org/10.1086/
459804
Hoover-Dempsey, K. V., Battiato, A. C., Walker, J. M. T., Reed, R. P., DeJong, J. M., & Jones, K. P. (2001). Parental involvement in home-work. Educational Psychologist, 36, 195–209. http://dx.doi.org/10.1207/ S15326985EP3603_5
IBM Corp. (2013). IBM SPSS missing values 20 [Software manual]. Retrieved from ftp://service.boulder.ibm.com/software/analytics/spss/ documentation/statistics/22.0/en/client/Manuals/IBM_SPSS_Missing_ Values.pdf
Kitsantas, A., & Zimmerman, B. J. (2009). College students’ homework and academic achievement: The mediating role of self-regulatory be-liefs. Metacognition and Learning, 4, 97–110. http://dx.doi.org/10.1007/ s11409-008-9028-y
Koole, S. L., & Lakens, D. (2012). Rewarding replications: A sure and simple way to improve psychological science. Perspectives on
Psy-chological Science, 7, 608 – 614. http://dx.doi.org/10.1177/
1745691612462586
Lubbers, M. J., Van Der Werf, M. P. C., Kuyper, H., & Hendriks, A. A. J. (2010). Does homework behavior mediate the relation between person-ality and academic performance? Learning and Individual Differences,
20, 203–208. http://dx.doi.org/10.1016/j.lindif.2010.01.005
Ministerio de Educación. Cultura y Deporte. (2003). Evaluación de la
Educación Secundaria Obligatoria 2000: Informe final [Evaluation of
Secondary Education 2000: Final report]. Madrid: Instituto Nacional de Evaluación y Calidad del Sistema Educativo.
Murillo, F. J., & Martínez-Garrido, C. (2013). Homework influence on academic performance. A study of iberoamerican students of primary education. Revista de Psicodidáctica, 18, 157–171. http://dx.doi.org/ 10.1387/RevPsicodidact.6156
Núñez, J. C., Vallejo, G., Rosário, P., Tuero, E., & Valle, A. (2014). Student, teacher, and school context variables predicting academic achievement in Biology: Analysis from a multilevel perspective. Revista
de Psicodidáctica, 19, 145–172. http://dx.doi.org/10.1387/RevPsicodidact
.7127
OECD. (2013). PISA 2012 results: What makes schools successful?
Re-sources, policies and practices (Vol. IV). Paris: OECD Publishing.
Paschal, R. A., Weinstein, T., & Walberg, H. J. (1984). The effects of homework on learning: A quantitative synthesis. The Journal of
Edu-cational Research, 78, 97–104. http://dx.doi.org/10.1080/00220671
.1984.10885581
Patall, E. A., Cooper, H., & Robinson, J. C. (2008). Parent involvement in homework: A research synthesis. Review of Educational Research, 78, 1039 –1101. http://dx.doi.org/10.3102/0034654308325185
Patall, E. A., Cooper, H., & Wynn, S. R. (2010). The effectiveness and relative importance of providing choice in the classroom. Journal of
Educational Psychology, 102, 896 –915. http://dx.doi.org/10.1037/
a0019545
Peña-Suárez, E., Fernández-Alonso, R., & Muñiz, J. (2009). Estimating value added of schools. Aula Abierta, 37, 3–18.
Pomerantz, E. M., Moorman, E. A., & Litwack, S. D. (2007). The how, whom, and why of parents’ involvement in children’s academic lives: More is not always better. Review of Educational Research, 77, 373– 410. http://dx.doi.org/10.3102/003465430305567
Raudenbush, S. W., & Bryk, A. S. (2002). Hierarchical linear models:
Applications and data analysis methods (2nd ed.). Newbury Park, CA:
Sage.
Raudenbush, S. W., Bryk, A. S., Cheong, Y. F., & Congdon, R. T. (2004).
HLM6: Hierarchical linear and nonlinear modeling. Chicago, IL:
Sci-entific Software International.
Rosário, P., Lourenço, A., Paiva, O., Rodrigues, A., Valle, A., & Tuero-Herrero, E. (2012). Predicción del rendimiento en matemáticas: Efecto de variables personales, socioeducativas y del contexto escolar [Predic-tion of mathematics achievement: Effect of personal, socioeduca[Predic-tional and contextual variables]. Psicothema, 24, 289 –295.
Scheerens, J., Witziers, B., & Steen, R. (2013). A meta-analysis of school effectiveness studies. Revista de Educación, 361, 619 – 645.
Schereens, J. (1992). Effective schooling, research theory and practice. London: Cassell.
Shell, D. F., Brooks, D. W., Trainin, G., Wilson, K. M., Kauffman, D. F., & Herr, L. M. (2010). The unified learning model. Dordrecht: Springer, Netherlands. http://dx.doi.org/10.1007/978-90-481-3215-7
Stoeger, H., & Ziegler, A. (2008). Evaluation of a classroom based training to improve self-regulation in time management tasks during homework activities with fourth graders. Metacognition and Learning, 3, 207–230. http://dx.doi.org/10.1007/s11409-008-9027-z
Suárez-Álvarez, J., Fernández-Alonso, R., & Muñiz, J. (2014). Self-concept, motivation, expectations and socioeconomic level as predictors of academic performance in mathematics. Learning and Individual
Dif-ferences, 30, 118 –123. http://dx.doi.org/10.1016/j.lindif.2013.10.019
Trautwein, U. (2007). The homework–achievement relation reconsidered: Differentiating homework time, homework frequency, and homework effort. Learning and Instruction, 17, 372–388. http://dx.doi.org/10.1016/ j.learninstruc.2007.02.009
Trautwein, U., & Köller, O. (2003). The relationship between homework and achievement: Still much of a mystery. Educational Psychology
Review, 15, 115–145. http://dx.doi.org/10.1023/A:1023460414243
Trautwein, U., Köller, O., Schmitz, B., & Baumert, J. (2002). Do home-work assignments enhance achievement? A multilevel analysis in 7th grade mathematics. Contemporary Educational Psychology, 27, 26 –50. http://dx.doi.org/10.1006/ceps.2001.1084
Trautwein, U., & Lüdtke, O. (2007). Students’ self-reported effort and time on homework in six school subjects: Between-student differences and within-student variation. Journal of Educational Psychology, 99, 432– 444. http://dx.doi.org/10.1037/0022-0663.99.2.432
Trautwein, U., & Lüdtke, O. (2009). Predicting homework motivation and homework effort in six school subjects: The role of person and family characteristics, classroom factors, and school track. Learning and
In-struction, 19, 243–258. http://dx.doi.org/10.1016/j.learninstruc.2008.05
.001
Trautwein, U., Lüdtke, O., Schnyder, I., & Niggli, A. (2006). Predicting homework effort: Support for a domain-specific, multilevel homework model. Journal of Educational Psychology, 98, 438 – 456. http://dx.doi .org/10.1037/0022-0663.98.2.438
Trautwein, U., Niggli, A., Schnyder, I., & Lüdtke, O. (2009). Between-teacher differences in homework assignments and the development of students’ homework effort, homework emotions, and achievement.
Jour-nal of EducatioJour-nal Psychology, 101, 176 –189. http://dx.doi.org/
10.1037/0022-0663.101.1.176
Trautwein, U., Schnyder, I., Niggli, A., Neumann, M., & Lüdtke, O. (2009). Chameleon effects in homework research: The homework– achievement association depends on the measures used and the level of analysis chosen. Contemporary Educational Psychology, 34, 77– 88. http://dx.doi.org/10.1016/j.cedpsych.2008.09.001
Tymms, P. B., & Fitz-Gibbon, C. T. (1992). The relationship of homework to A-level results. Educational Research, 34, 3–10. http://dx.doi.org/ 10.1080/0013188920340101
Vallejo Seco, G., Ato García, M., Fernández García, M. P., & Livacic Rojas, P. E. (2013). Multilevel bootstrap analysis with assumptions violated. Psicothema, 25, 520 –528.
Warton, P. M. (2001). The forgotten voices in homework: Views of students. Educational Psychologist, 36, 155–165. http://dx.doi.org/ 10.1207/S15326985EP3603_2
Wu, M. L., Adams, R. J., Wilson, M. R., & Haldane, S. A. (2007). ACER
ConQuest 2.0: Generalised item response modelling software.
Camber-well, Victoria: Australian Council for Educational Research.
Xu, J. (2008). Models of secondary school students’ interest in homework: A multilevel analysis. American Educational Research Journal, 45, 1180 –1205. http://dx.doi.org/10.3102/0002831208323276
Xu, J. (2010a). Predicting homework time management at the secondary school level: A multilevel analysis. Learning and Individual Differences,
20, 34 –39. http://dx.doi.org/10.1016/j.lindif.2009.11.001
Xu, J. (2010b). Homework purposes reported by secondary school stu-dents: A multilevel analysis. The Journal of Educational Research, 103, 171–182. http://dx.doi.org/10.1080/00220670903382939
Xu, J. (2011). Homework completion at the secondary school level: A multilevel analysis. The Journal of Educational Research, 104, 171– 182. http://dx.doi.org/10.1080/00220671003636752
Xu, J. (2013). Why do students have difficulties completing homework? The need for homework management. Journal of Education and
Train-ing Studies, 1, 98 –105.
Zimmerman, B. J. (2001). Theories of self-regulated learning and academic achievement: An overview and analysis. In B. J. Zimmerman & D. H. Schunk (Eds.), Self-regulated learning and academic achievement:
The-oretical perspectives (2nd ed., pp. 1–38). Mahwah, NJ: Erlbaum, Inc.
Zimmerman, B. J., & Kitsantas, A. (2005). Homework practices and academic achievement: The mediating role of self-efficacy and per-ceived responsibility beliefs. Contemporary Educational Psychology,
30, 397– 417. http://dx.doi.org/10.1016/j.cedpsych.2005.05.003
Received July 9, 2014 Revision received January 22, 2015