The Keynesian Model
The multiplier is one of the main tools for establishing a relationship between income, investment, consumption, and employment as developed by Keynes in his The General Theory.
Multiplier model is a macroeconomics theory used to explain how output is determined in the short run. “The multiplier” comes from the finding that each dollar change in exogenous expenditures leads to more than a dollar change in GDP. Economists try to understand the mechanism by which changes in spending get translated into changes in output and employment. The simplest approach to understanding business cycles is known as the Keynesian multiplier model.
The Keynesian Expenditure Model
The multiplier model analyzes how investment and consumption spending interact with incomes to determine national output. This called the total expenditure approach to determining national output. We have drawn a graph, where the consumption function is C = a+by. This shows the level of consumption expenditures corresponding to every level of income. We have omitted taxes, transfers, and other items, so that personal income equals national income, and national income equals GDP.
Figure1: national income determines the level of consumption.
Let's denote aggregate demand by AD. Thus we have, AD = C + I + G + X where X stands for net exports. In the Keynesian model, aggregate supply, denoted AS, is just equal to the actual value of GDP that we observe.
AS = GDP
Thus: Setting aggregate supply equal to aggregate demand, we have,
GDP = C + I + G + X
This equation should look familiar; it is the accounting identity for GDP. But in the context of the Keynesian model, it is also a statement about how GDP is determined. It says that GDP is determined by the sum of demand from the four sectors of the economy. Economists sometimes characterize the Keynesian model by saying that in it GDP is "demand determined." The consumption function that we discussed in the previous section says that the consumption component of aggregate demand can in turn, be expressed as a function of disposable income that we called Y. Let's write disposable income as,
Y = GDP – T
Where we can think of T as taxes net of transfer payments. In the simplest version of the Keynesian model presented here, we treat T as a lump sum amount, not as a function of GDP. A more sophisticated model would allow T to be a function of GDP, so that we could study the effect of a change in the tax rate. The consumption function is then,
C = a + b Y = a + b • (GDP - T)
Substituting for C in the expression for GDP, we get
GDP = a + b (GDP - T) + I + G + X
This equation tells us how the level of GDP will change in response to a change in any of the autonomous components of spending, those that do not depend on GDP, at least according to the assumptions of this model. We can see that a one dollar change in either a, I, G, or X will result in a change of 1/(1-b) dollars in GDP. Of course, this is just the spending multiplier again, but we see that it applies not just to government spending but also to any increase in spending by any sector. The tax cut multiplier is still b/(1-b), keeping in mind that a tax cut is a negative increase in T. Now we developing in figure2 an important new graph showing the total expenditure output relationship. This graph is some time called the “Keynesian cross,” because it shows how output equals expenditure when the expenditure curve crosses the 45o line. We begin by drawing the
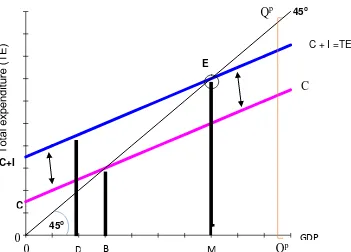
Figure 2: the equilibrium level of National Output Is Determined when Total Expenditure (TE) equals output.
Note that the C+I curve is higher than the C curve by exactly the constant amount of I. this parallel feature indicates that investment is constant.
This, C+I curve represents total expenditures (TE), which equals desired investment (I) plus consumption. This is drawn in figure 2 as the green C+I or TE curve.
The total expenditure curve (TE) shows the level of expenditure desired or planned by consumers and businesses corresponding to each level of output.
The economy is in equilibrium at the point where the TE=C+I curve crosses the 45o line at point E in figure 2. Point E is the macroeconomic equilibrium because at the point, the level of desired expenditure on consumption and investment exactly equals the level of output.
Investment has a multiplied effect on output. When investment changes, output will initially rise by an equal amount. But that output increase is also an income increase for consumers. As consumers spend a part of their income this sets in motion whole chain of additional consumption spending and employment.
Fiscal policy multipliers
The multiplier analysis shows that government fiscal policy is high powered
spending much like investment. The government expenditure multiplier is the
increase in GDP resulting from an increase of $1 in government purchases of goods
and services. An initial government purchase of a good or service will set in motion
a chain of spending if the government builds a road, the road builders will spend
some of their incomes on consumption goods, which in turn will generate additional
incomes, some of which will be spent. In the simple model examined here, the
ultimate effect on GDP of an extra dollar of I the multipliers are both equal to 1
/(1-MPC).
Figure 3 shows how a change in G will result in higher level of GDP, with the
increase being a multiple of the increase in government purchases.
To show the effects of an extra $100 billion of G, the C+I+G curve in figure 3 has
been shifted up by $100 billion. The ultimate increase in GDP is equal to the $100
billion of primary spending times the expenditure multiplier.
In this case, because the MPC is 2/3, the multiplier is 3, so the equilibrium level of
GDP rises by $300.
Suppose that the government raises defense purchases by $100 billion in response to a threat to Mideast oil fields. This shifts upward the C+I+G line by $100 billion to C+I+G’.
Slope
º
45
Algebraically
Y
A
’
100
Does Keynesian Multiplier Work in the Under Developing Countries? – Answered!
In the early fifties, an eminent Indian economist Dr. V.K. R.V. Rao and some others explained that in developing countries like India Keynesian multiplier did not work in real terms, that is, does not operate to increase income and employment by a multiple of the initial increase in investment.
He claimed that the concept of investment multiplier was valid in the context of the situation of depression in the industrialized developed economics of the UK and the USA where there existed a lot of access productive capacity and a larger number of open involuntary unemployment.
He argued that in such a situation of a depressed economy there was a high elasticity of supply of output to changes in demand for them. Therefore, in the developed capitalist economies ridden with depression increase in investment leading to successive rounds of consumption expenditure raises aggregate demand.
Due to the existence of large excess capacity and involuntary unemployment under conditions of depression aggregate supply of output is highly elastic, increase in aggregate demand brings about increase in real income, output, and employment, which is a multiple of original increase in investment.
On the other hand, they claimed that in underdeveloped countries, there was little excess capacity in consumer goods industries and therefore supply of output was inelastic. Therefore, when there is injection of investment, and as a result through successive rounds of the operation of multiplier, aggregate demand for consumer goods increases, it results mainly in rise in money income brought about through rise in prices and not an increase in real national income.
The second condition, according to Dr. Rao and his followers for the working of multiplier in raising national income and employment was that the supply of raw materials, financial capital must be sufficiently elastic so that when aggregate demand increases as a result of multiplier effect of increase in investment the supply of output could be increased adequately to meet this higher demand for goods and services.
They argued that in underdeveloped countries like India and Bangladesh due to under-developed nature of their economies, there was acute scarcity of raw materials, other intermediate goods such as steel, cement and financial capital which put great obstacles for the working of multiplier in real terms.
The third condition, required for the working of multiplier in real terms was that there should be involuntary open unemployment so that when aggregate demand for goods increases because of new investment, the adequate supply of workers must be forthcoming to be employed in the production processes of various industries.
Lastly, it was pointed out that the under-developed countries like India had predominantly agricultural economies and income elasticity of demand for food-grains was very high in these economies. In view of this when increase in investment leads to the rise in money incomes of the people, a large part is spent on food-grains.
But the supply of agricultural products is inelastic because their production is subject to uncertain natural factors like Monsoon and climate and further there was lack of irrigation facilities, improved seeds, fertilizers etc. Hence it was difficult to increase agricultural production in response to the increase in demand through the multiplier effect of increase in investment.
It follows from above that the Keynesian assumptions for the working of multiplier in real terms, namely:
(a) The supply of output of goods is elastic due to the existence of large excess capacity,
(b) The supply of raw materials and others intermediate goods can be adequately increased,
(c) There exists involuntarily unemployed workers searching for work and,
(d) Sufficiently elastic agricultural output.