Ethnic Favoritism: Micro Evidence from Guinea
∗
Masayuki Kudamatsu
†IIES, Stockholm University
July 28, 2009
Abstract
In an ethnically diverse country, does it matter to the welfare of ordinary citizens
which ethnic group is in power? This paper exploits a plausibly exogenous change
in the ethnicity of the president of Guinea in 1984 to identify the effect of having a
co-ethnic in power on welfare, measured by infant mortality. By using the
retrospec-tive fertility survey of women in a nationally representaretrospec-tive sample of households in
1992-93, mother fixed effects estimation results show that, after 1984, infants born to
mothers of the new president’s ethnicity are not substantially less likely to die within
the first year of life than those born to mothers of other ethnicity. Since the
govern-ment had the capability to reduce infant mortality during the period of study (the
yearly average infant mortality rate declined rapidly under the new president’s rule),
the finding suggests that the new president did not favor his own ethnic group to a
large extent as far as ordinary citizens were concerned. (JEL codes: O55, P16, Z13.
Keywords: ethnic conflict; Africa; infant mortality; mother fixed effects estimation.)
∗I thank Martina Bjorkman, Robin Burgess, Esther Duflo, Maitreesh Ghatak, Karl Moene, Rohini
Pande, Andrea Prat, and seminar participants at EOPP (LSE), IIES, Bocconi, NEUDC 2007, and ESOP (Oslo) for various comments.
†Postal address: IIES, Stockholm University, SE-106 91 Stockholm, Sweden. Telephone: +46 8 16 3070.
1
Introduction
Ethnic diversity is empirically associated with low economic growth (Easterly and Levine
1997; Alesina et al. 2003), poor quality of government (La Porta et al. 1999), and civil
wars (Montalvo and Reynal-Querol 2005).1 One possible mechanism for this association
is ethnic favoritism by the government.2 A conventional wisdom has it that policy-makers
favor their own ethnic groups in the allocation of public funds. As a result, citizens support
politicians from their own ethnic group even if these politicians may be less honest or less
able than those from other ethnic groups (Banerjee and Pande 2007). As which ethnic
group is in power is salient, citizens even resort to violence to have their co-ethnics in
power.3 However, there is a lack of systematic evidence that the ethnic group in power is
indeed better off. This paper aims to test this conventional wisdom in a systematic and
convincing way.
Evidence on ethnic favoritism by the government in the literature is largely anecdotal.4
When statistics is provided, it is often the government expenditure by ethno-region (e.g.
Barkan and Chege 1989). Given that government expenditures often do not reach the
end-users of public goods in poor countries (Reinikka and Svensson 2004), it is not clear whether
ethnic groups in power really benefit from more budget allocations to their regions. This
paper looks at infant mortality as a measure of welfare each ethnic group actually enjoys.
Comparing each ethnic group’s welfare cross-sectionally does not allow us to disentangle
the effect of government favoritism from heterogeneity in unobservable characteristics across
ethnic groups. To empirically show whether it matters which ethnic group is in power, we
need to exploit a change in the ethnicity of political leaders and compare changes in welfare
across ethnic groups. However, the ethnicity of leaders may be endogenous to changes in
each ethnic group’s welfare. A certain ethnic group may accumulate economic power, which
then allows it to seize political power as well. In this case, we would wrongly attribute
1
See Alesina and LaFerrara (2005) for a survey. 2
Another possible mechanism is that ethnic diversity exacerbates the problem of collective actions. While this mechanism receives much attention in the economics literature (e.g. Miguel and Gugerty 2005), ethnic favoritism has so far been rather ignored by economists.
3
Tishken (1994), in his review of a book on ethnic conflict, lists ethnic favoritism in state resource allocations as one reason for why many conflicts take on an ethnic dimension.
4
improvements in welfare for the ethnic group that gains power to the effect of having a
co-ethnic in power. Alternatively, ethnicity in power may change because an ethnic group
discriminated by the government seizes power out of grievance. As a result, the ethnic
group newly in power becomes better off after the leadership change though this change in
welfare has nothing to do with ethnic favoritism per se.
In order to ensure the exogeneity of ethnicity in power, we need to look at a case where
ethnicity in power is determined independently of relative welfare changes across ethnic
groups. For this purpose, this paper focuses on Guinea, a country in West Africa with
high ethnic diversity. The president who had ruled this country since independence in
1957 unexpectedly died in office in 1984. Only eight days later, a group of military officers
who had been excluded from political power until then seized power with the officer most
senior in rank becoming a new president. He is from a different ethnic group than his
predecessor’s. As discussed in detail in section 3.1 below, the new president’s assumption
of power is unlikely to have been made possible by changes in the welfare of his own
ethnic group relative to others. Therefore, observed changes in welfare, measured by infant
mortality, after the leadership change for the new president’s ethnic group relative to other
groups give an unbiased estimate of the effect of having a co-ethnic in power.
Using the sample of infants created from the retrospective fertility survey of women in
a nationally representative sample of households, conducted in Guinea from 1992 to 1993,
I estimate the effect of having a co-ethnic as president on the survival of infants born to
mothers of the new president’s ethnicity. I control for mother fixed effects in the estimation
so that possible compositional changes of women giving birth in response to the leadership
change in 1984 will not contaminate estimation results.
Empirical results obtained in this paper do not provide evidence that the ethnic group
in power is substantially better off than other groups in Guinea. As the sample mean
infant mortality rates were on the sharp decline after the leadership change, these findings
suggest that improvements in infant survival were more or less equally shared by all ethnic
groups in Guinea in this period. Although we cannot rule out the possibility that the elite
members of the ruling ethnic group benefit from their power or that the effect of favoritism
estimating the impact on it requires a large number of observations), this paper’s findings
suggest that the ethnicity of the president did not matter substantially to the welfare of
the average citizens in Guinea, where violence between different ethnic groups had been
the key feature of its history.
The only systematic evidence on ethnic favoritism in the literature that I am aware of
is Kasara (2007), who shows that African leaders tax their co-ethnics more heavily than
other ethnic groups, by exploiting time-series variation within each subnational
ethno-region across 30 African countries.5 Although her study has more external validity than
this paper in terms of countries covered in the study, the endogeneity of changes in the
ethnicity of leaders is not explicitly dealt with. In addition, unlike this paper, she does not
directly look at welfare as an outcome.
The paper is organized as follows. The next section provides the background to this
study. Section 3 describes identification strategy and data. Section 4 reports empirical
results and conducts robustness checks, followed by the concluding section.
2
Background
This section provides background information on Guinea and its ethnic groups. After a
brief discussion on the representativeness of Guinea for sub-Saharan Africa as a whole, I
show how Guinean ethnic groups differ from each other and that the conflict among them is
a persistent feature of the Guinean history to date. These pieces of information confirm that
Guinea is an appropriate country to study on ethnic favoritism. Finally, I explain why we
would expect ethnic favoritism to affect infant mortality, the outcome under investigation
in this paper, in Guinea after 1984.
2.1
Ethnic Groups in Guinea
Guinea is a country in West Africa with the population of over 7 million. Its GDP per
capita in purchasing power parity terms is close to the average of 48 sub-Saharan African
5
countries in 2000 though economic growth between 1960 and 2000 is among the worst in the
region.6 Infant mortality per 1,000 live births has always been above the African average.7
Ethnic diversity is also higher than the African average.8 These statistics suggest that what
we see in Guinea is likely to represent the basket case even by African standards.9
Guinea has six major ethnic groups: Sousou, Peulh, Malinke, Kissi, Toma, and Guerze,
with the last three groups often grouped together as “Foresters”.10 According to O’Toole
and Baker (2005, p. 163), the estimated ethnic composition in 2000 was 40 percent Peulh,
30 percent Malinke, 20 percent Sousou, and 10 percent other groups.
Members of each group speak different languages with the Sousou, Malinke, Toma, and
Guerze languages more similar to each other (belonging to the Mande language group)
than to the rest. Although French is the official language of Guinea, only about 20 percent
of the population understand French (O’Toole and Baker 2005, p. 93). One can identify
each other’s ethnicity from their surname to some extent.11
Sousou, Peulh, Malinke, and “Foresters” each predominate in one of the four
topograph-ical regions: Lower Guinea (or Guinee Maritime), Middle Guinea (or Futa Jalon), Upper
Guinea (or Haute Guinee), and Forest Guinea (or Guinee Forestiere), respectively. Each
region has a slightly different climate pattern and thus people cultivate different crops,
implying that a simple cross-sectional comparison of ethnic groups in terms of welfare can
be misleading.
6
Guinea’s real GDP per capita is 2,546 US dollars in purchasing power parity terms in 2000 while the African average is 2,633 dollars. The Guinean economic growth rate between 1960 and 2000 is -0.47 percent, which is the fourth lowest among 33 African countries with data available. All the figures are based on Penn World Table 6.2 (Heston et al. 2006).
7
Infant mortality per 1,000 live births for Guinea and for the African average is 215 versus 160 in 1960, 162 versus 105 in 1985, and 112 versus 95 in 2000 (World Development Indicators, September 2006).
8
The ethnic fractionalization index (Alesina et al. 2003) is 0.74 for Guinea and 0.66 on average for 47 sub-Saharan African countries. Guinea’s ethnic polarization index (Montalvo and Reynal-Querol 2005) is the highest in sub-Saharan Africa (0.84).
9
Indeed, the 2007 Failed State Index, compiled by the Fund for Peace and Foreign Policy magazine, ranks Guinea as the 9th most fragile state in the world (see “The Failed State Index 2007,”Foreign Policy, July/August 2007, pp. 54-63).
10
There are various spellings for the names of ethnic groups in Guinea (Susu or Sosso for Sousou; Fulbe, Fula, Fulani, or Peul for Peulh; Maninka, Mandinka, or Manding for Malinke; Loma for Toma; Kpelle for Guerze). I follow the spelling in the codebook of the Demographic and Health Survey conducted in Guinea in 1992-93 (the dataset used in this paper).
11
The six ethnic groups in Guinea are socially and culturally distinctive.12 Peulh is
particularly different from the rest. Its subsistence economy depends on animal husbandry a
lot more than the other groups in Guinea. Core membership of Peulh kin groups is confined
to a single community while lineages for the other groups comprise residents of more than
one community. Settlement patterns differ, too. For Peulh, a community comprises a
nucleated village or town with outlying homesteads or satellite hamlets. For other groups,
a community is just a nucleated village or town only. Finally, Peulh traditional society is
more politically complex: there is a jurisdictional level above local communities. For other
ethnic groups, each community is traditionally independent.
Non-Peulh ethnic groups also exhibit differences. In terms of family organization,
Sousou, Malinke, and Kissi have large extended families while Toma and Guerze
fami-lies are independent. Polygyny is general for all groups, but co-wives live together for
Sousou and Guerze, but occupy separate quarters for the rest. For rules for inheritance
of real property, all groups are patrilineal. But a man’s property is inherited by his sons
in Kissi and Guerze societies while the other groups designate other patrilineal heirs than
sons. In Kissi society, the inheritance is equally distributed among all sons. In Guerze, on
the other hand, the senior son inherits real property. For inheritance of movable property,
all but Sousou follow the same rule as for real property. Sousou society now allows a man’s
sons to equally inherit.
Do these ethnic groups in Guinea differ in socio-economic characteristics? Table 1 shows
the shares of women aged 15-49 (in the sample of the Demographic and Health Surveys
conducted from 1992 to 1993) who have attended primary school (Panel A), have access
to electricity (Panel B), or own a television set (Panel C), by ethnicity (Kissi, Toma, and
Guerze are grouped together as Foresters) and by natural region plus Conakry, the capital
city. Column (1) looks at the whole country. For education, Foresters (and Sousou to a
lesser extent) are significantly more educated while Peulh are significantly less educated.
In terms of access to electricity and television ownership, Sousou are significantly better
off while Foresters (and Peulh to a lesser extent) are significantly worse off. This partly
12
reflects the differences across regions, because each ethnic group predominates in one region
(see Panel D). Even within each region and the capital city of Conakry, however, there are
statistically significant differences across ethnic groups in most of the cases (although ethnic
groups that are minority in each region tend to be better off, perhaps due to the tendency
of migrating Guineans to be richer).
To sum up, ethnic groups in Guinea are distinctive to each other in terms of culture
and socio-economic status, suggesting that ethnic divisions could result in conflicts in this
country.
2.2
History of Ethnic Rivalries
Ethnic groups in Guinea have a long history of rivalry. During pre-colonial days, Peulh
rulers oppressed Sousou people while Foresters fought against the invasion by Malinke
people.13 Under the French colonial rule starting at the end of the 19th century, the
four ethnic groups could not agree on the location of a new secondary school financed by
the colonial authority in 1947.14 Most political parties formed after 1945 were
ethnically-based.15 Prior to independence, there were riots against Peulh people, especially by Sousou
people.16
Guinea became independent from France in 1958 after Guineans voted for independence
in a referendum. Ahmed Sekou Toure, a Malinke, became president and established
one-party rule immediately after independence. He was accused of ignoring Middle Guinea
(and thus Peulh people living there) in the first development plan for 1960 to 1962.17 His
ethnic group, Malinke, was allegedly overrepresented in the army and in top leadership.18
In 1976, Peulh leaders were alledged to attempt a coup against President Toure.19
13
See O’Toole and Baker (2005), pp. xxxvii, xxxvix, 81-2. 14
See Adamolekun (1976), p. 125. 15
See O’Toole and Baker (2005), p. 160. 16
Seeibid., pp. xl-xli, and Adamolekun (1976), p. 125. 17
See Adamolekun (1976), p. 132. 18
See ibid., pp. 131-2, 172-3. See also Everett (1985), p. 23. Yansane (1990, footnote 48) provides a different view by noting that “Toure certainly did not favor any ethnic group except for his family.” As his family members are, by definition, all Malinke, this “family” favoritism may have been seen as ethnic favoritism.
19
Sekou Toure died in office unexpectedly on March 26, 1984, at the age of 62.20 Upon
Sekou Toure’s sudden death, Lansana Beavogui, a Toma who had been prime minister under
Toure’s rule since 1972, became interim president. Only eight days later, Colonel Lansana
Conte, a Sousou, staged a coup against the interim government and became president. (It
is this leadership change that I exploit in the empirical analysis below.) His presidential
guards were said to be mostly Sousou.21 When Diara Traore, a Malinke military officer
who was number two in Conte’s military government, attempted a coup in 1985, there was
looting against Malinke people in the capital city of Conakry.22
In 1990, when the first local elections were held, violent clashes between ethnic factions
errupted in some areas.23 When opposition parties were legalized in 1992, most newly
formed political parties were ethnically based.24 In 1993, the first multiparty presidential
election since independence was held in which Lansana Conte won with 52 percent of valid
votes (Brune 1999, p. 457). Conte was re-elected in 1998 and 2003, and died in office
in December of 2008. During the last years of Conte’s rule, there was fear of civil wars
between ethnic groups after his death. Peulh people are reported to demand presidency
after almost five decades of rules by other ethnic groups.25
The above description of Guinean history shows that ethnicity has been salient in this
country for a long time. Whether or not the ethnicity of the president matters for each
ethnic group’s welfare, however, is an empirical question which this paper aims to answer.
2.3
Possible Means of Favoritism in Guinea after 1984
To estimate the impact of the leadership ethnicity change, I look at infant mortality as an
outcome. An obvious question is why we expect infant mortality to change as a result of
20
Adamolekun (1976) and Riviere (1977) argue that Sekou Toure was successful in integrating ethnic groups in Guinea. Gardinier (1988), however, points out that it is not clear how Toure managed to integrate Guineans while his education policy led to a situation where “primary and secondary school classes were taught only in local dialects” (Everett 1985, p. 23).
21
See Schissel (1986), p. 23. 22
See O’Toole and Baker (2005), p. 203. Presumably, non-Malinke citizens in Conakry saw this coup as Malinke’s attempt to seize power back. As will be discussed in Section 3.1 below, though, a closer look reveals that this attempted coup does not appear to be ethnically motivated.
ethnic favoritism. Possible mechanisms in the context of Guinea in the mid-1980s are the
selective dismissal of civil servants and the selective revamp of primary health care systems
in a way to favor Sousou people.
Under Sekou Toure’s rule, Guineans were impoverished while the bureaucracy was
hugely bloated. The number of public sector employees in November 1985 was 140,000,
above 2 percent of the entire population.26 Civil servants engaged in ‘moonlighting’ by
sell-ing goods from state warehouses to the black market (Graybeal and Picard 1991, p. 288).
By the time Sekou Toure died, Guinean national debt was accumulated to the level of 62
percent of its GNP (Ibid., p. 282). Lansana Conte needed to accept IMF conditionalities,
including the streamlining of the public sector, to obtain loans. It could be conceivable that
Conte may have chosen whom to be fired based on ethnicity. To the extent that Sousou
civil servants have an informal risk-sharing network with their co-ethnics, then we would
see the survival of babies more likely for Sousou than for the other ethnic groups, because
only Sousou people could thus afford sufficient nutritional intakes and access to health care.
By the end of Sekou Toure’s rule, health systems in Guinea collapsed severely. Kaba
(1977, p. 40) reports that despite a rapid population growth of Conakry, no new hospital
was constructed in the city. Inexperienced individuals were appointed to hospital
admin-istration. Medicine shortage was endemic. Toure even denied a cholera epidemic in 1973.
Knippenberg et al. (1997, pp. S30-S31) describes the state of the Guinean health system
right after the death of Toure in 1984. Storage and distribution of vaccine and drugs was
inadequate due to scarcity of spare parts for refrigerators and of fuel for vehicles. The lack
of financial resources due to Toure’s economic mismanagement exacerbated the
unavail-ability of drugs. Access to health services was limited due to a long distance to clinics.
Health staff could not travel to villages for outreach activities because of lack of transport
or fuel. The quality of health service, if provided, was perceived as poor by Guineans.
After seizing power, Lansana Conte initiated the revitalization of health systems in 1986
by formulating a new health policy (World Bank 2005, p. 1) and by developing primary
health care centers throughout the country with an emphasis on child and maternal care
26
(Glik et al. 1989, p. 423). As we will see below, infant mortality started dropping sharply
after 1986. Conte could have deliberately allocated public funds and human resources for
revamping health care provision to communities where his co-ethnics predominate. Given
the extremely poor conditions of the health care system after the death of Sekou Toure as
described above, such selective attempts to improve the system in favor of Sousou people
could have resulted in an immediate change in infant mortality.
3
Identification Strategy and Data
3.1
Exogenous Change in President’s Ethnicity?
As indicated above, the ethnicity of the Guinean president changed from Malinke to Sousou
in 1984. I exploit this change to estimate the effect of having a co-ethnic as president on
individual welfare measured by infant mortality. An obvious issue on this identification
strategy is whether the seizure of power by Conte, a Sousou military officer, is exogenous
to changes in determinants of the welfare of Sousou people over time.
The welfare of Sousou people is unlikely to be correlated with the fact that Conte
seized power and stayed in office for four reasons. First, Conte had not been politically
powerful before the coup. Momoh (1984, p. 756) describes him as belonging to “the less
privileged sector of Guinean armed forces”. As a result, it is unlikely that his position in
the government before 1984 both brought about improvements in Sousou people’s welfare
and allowed him to seize power.
Second, the military coup does not seem to have been ethnically motivated, suggesting
that Sousou’s economic power was unlikely to be crucial for Conte to seize power. Several
non-Sousou military officers participated in the military coup. As mentioned above, the
number two figure in Conte’s government, Diara Traore, is a Malinke.27 Among the other
16 original members of the military junta (Comite Militaire de Redressment National), one
major, two captains, and one lieutenant are Peulh, and four majors are Malinke, judging
from their surnames.28 Another member of the military junta, Captain Jean Traore, is
27
According to Kaba (1985, p. 178), Traore was the “main force” behind the coup. 28
from Forest Guinea, where ‘Foresters’ (Kissi, Toma, Guerze) reside, and he is thought to
be one of the closest to Conte.29 On the other hand, the only Sousou politician among top
political leaders under Toure’s rule, N’Famara Keita (see Adamolekun 1976, pp. 173-4),
was arrested after the coup and died in prison a year after.30
Third, the 1985 attempted coup by Traore does not appear to have been a clash between
Sousou and Malinke ethnic groups, suggesting that Sousou’s economic power was unlikely
to be decisive for Conte to stay in power. Ousmane Sow, whose surname indicates that
he is a Peulh (O’Toole and Baker 2005, p. 96), led a battalion to first counter-attack
Diara Traore’s soldiers during the 1985 coup attempt. In addition, not all Malinke officers
supported Traore.31
Finally, Conte became president because he was the most senior in rank among the
coup plotters (Hodonou 2004), and the reason for his senior position does not appear to
have been his ethnic background but his military talent. He was a sergeant at the time
of independence. In 1970, when Portugal invaded Conakry, the capital city, to attack the
headquarters of the independence movement for Guinea-Bissau and Cape Verde (which
were Portuguese colonies at that time), Conte was in charge of the defense of Conakry
and successfully repelled the Portuguese invasion. Afterwards, he was named captain for
the exceptional service to his country.32 This military background appears to have allowed
Conte to lead the military junta.
I cannot entirely exclude the possibility that Conte seized power because the
Sousou-dominated region was becoming relatively better-off than others, however. Lower Guinea,
where the Sousou predominates and his home village is located, has major bauxite mines
in operation during the 1970s and the 1980s (see Campbell 1991, pp. 34-39). It is not clear
to what extent local people benefited from bauxite mines as local processing of bauxite was
limited (Campbell 1991). Still, given that Guinea possesses about one-third of the world’s
highest-grade bauxite deposits and has been the world’s leading exporter, bauxite mining
could have been a huge source of economic power. In addition, Conte was a commander of
the Boke military region in Lower Guinea (Hodonou 2004), where there was one bauxite
29
Africa Contemporary Record, 1984-1985, p. B470; O’Toole and Baker (2005), p. 203. 30
SeeKeesing’s Record of World Events, p. 33710 (July 1985) and O’Toole and Baker (2005, p. 124). 31
See “Guinea: Diarra Traore’s Attempted Comeback,”West Africa, 15 July 1985, pp. 1412-3. 32
mine in operation since 1973. He might have accumulated personal wealth from bauxite
export, which could have allowed him to buy support for his presidency. In fact, the
military’s support for Conte, which is likely to be crucial for political survival in
non-democratic politics, appears to have been based on improvements in living conditions among
officers and soldiers in the army.33 This might not have been possible if Conte’s regional
base was a poor area.
To partly deal with this concern, I will in some specifications control for any arbitrary
region-specific trends by allowing year fixed effects to differ across regions. By doing so, I
compare welfare changes across those Guineans living in the same region.
3.2
Data
The data source used in this paper is the Demographic and Health Survey (DHS)
con-ducted in Guinea from February 1992 to March 1993. In the survey, 450 communities
(villages and town districts) were first sampled with selection probability proportional to
the population. In each community, 16 households were randomly sampled. The head of
a sampled household reported every household member’s ethnicity. In section 4.2 below,
I use this data to identify communities where the Sousou ethnic group accounts for more
than a half of the population.
The survey then samples one woman aged between 15 and 49 from each household34and
interviews her on, among others, their ethnicity, educational attainment, migration date,
their children’s birth date and, if applicable, age at death in months. From these interviews
of 6,065 women in total, I construct an unbalanced panel dataset of mothers with the time
dimension being the birth year of their children. In the original sample, there are 20,897
babies born to 4,980 mothers at least one year before the survey (we do not observe whether
babies born within a year before the survey will actually survive beyond their first birth
day). From this sample, I drop babies whose birth year is not reported or whose mother’s
33
According to Momoh (1984, p. 757), under Sekou Toure’s rule, “[w]ages for the armed forces had been poor while housing was short and mostly in deplorable conditions.” On the other hand, Conte ensured that the army would be shielded from the public sector payroll cut under the structural adjustment (Africa Contemporary Record, 1984-85, p. B473).
34
ethnicity is not reported. The resulting sample contains 18,932 babies born to 4,706 women
from 1954 to 1992.35
From information on the age at death, I create a dummy variable for infant death
(death within the first year of life) as the dependent variable in the following analysis. For
exogenous controls, I also create dummy variables for birth orders, baby girls and babies
born in multiple birth (twins, triplets, and quadruplets). In the sample, babies of lower
birth order are more likely to die, so are baby boys and babies born in multiple birth.
These variables are included as regressors to increase the precision of coefficient estimates.
There is one data issue that may bias the estimated effect of favoritism towards zero:
mortality selection of mothers. Babies born to women who are dead at the survey date
are missing from the sample. Section 4.3 below discusses whether this sample selection is
serious enough to bias estimation results.
3.3
Summary Statistics
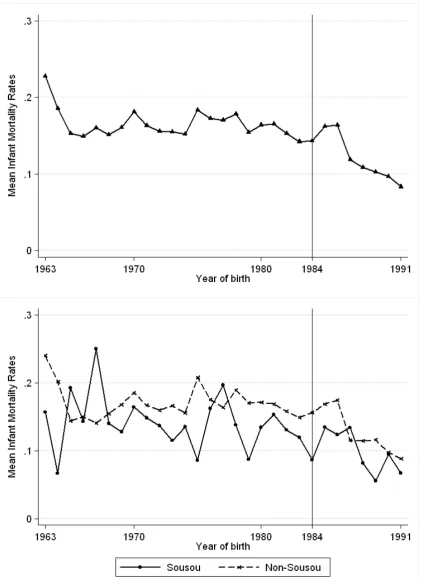
Overall, 14.5 percent of live births lead to death within the first year of life in the sample.
Figure 1 plots yearly average infant mortality rates over time. The top graph shows that
the mortality rates had been stable in the range between 15 and 20 percent until 1986, after
which there was a remarkable decline to below 10 percent. This trend break is consistent
with the health care system reform initiated by President Conte in 1986 as described above,
implying that Conte’s health care reform worked. One would argue that we will not be
able to detect evidence for ethnic favoritism even if President Conte did have an intention
to favor his own ethnic group, if the government did not have the capability to affect the
welfare of any ethnic group. The fact that the health care reform did seem to have an
impact on the reduction in infant mortality, however, makes this argument less likely to be
plausible.
35
The bottom graph in Figure 1 compares the trend in infant mortality between Sousou
(the solid line) and non-Sousou (the dashed line). Sousou babies are in general more likely
to survive throughout the sample period. While the trend break for non-Sousou babies
appears to be 1986 as well, that for Sousou seems to be 1987, suggesting that Sousou
people benefited from the health care system reform later than the other ethnic groups.
4
Estimation and Results
4.1
Individual-level Favoritism?
To investigate the possibility of individual-level favoritism, I estimate the following
equa-tion:
yimt=αm+βt+γSm∗1(t >1984) +x′imtθ+ǫimt, (1)
The dependent variable, yimt, is a dummy indicating whether baby i born to motherm in
year t dies within the first year of life. We control for the mother fixed effect,αm, so that
the compositional change of child-bearing women for each ethnic group does not affect our
estimate of the favoritism effect. If the Conte administration treats Sousou people better
than other groups, less healthy women (whose infants are thus more likely to die) from
the Sousou group may give birth more often than those from other groups, biasing the
estimated favoritism effect towards zero. Controlling for mother fixed effects avoids this
bias. We also control for the birth-year fixed effect, βt, so that the country-wide trend in
infant mortality seen in Figure 1 is non-parametrically controlled for. Since the
country-wide infant mortality was on the decline after 1986, we therefore identify favoritism from
the difference in the speed of a decline in infant mortality between Sousou and other groups.
The coefficient γ on the interaction term of a dummy for Sousou mothers, Sm, and
the indicator for years after 1984 is our measure of the degree of ethnic favoritism. It is
interpreted as changes in infant mortality for babies of a Sousou mother, relative to babies
of a mother of other ethnicity, after Conte seized power.
A vector of exogenous controls, ximt, includes dummies for whether baby i is a girl,
these variables is expected to increase the precision of estimates.
Standard errors are clustered at the ethnicity-by-period level where by “period” we
mean years until 1984 and years after.36
Panel A of Table 2 reports the estimated γ in equation (1). Column (1) uses the
full sample and shows that babies born to Sousou mothers are more likely to die after
1984 by 1.6 percentage points. Since the estimate is not significantly different from zero,
we cannot reject the possibility that there is no difference between Sousou and the other
ethnic groups. However, the positive coefficient implies that Sousou people’s welfare in
terms of child survival did not improve more than that of the other ethnic groups due to
the change in ethnicity of the president.
This finding may, however, reflect the migration of non-Sousou people to Sousou
com-munities with health care services improved by favoritism after 1984, which biases the
estimated effect of favoritism towards zero. To investigate this possibility, I restrict the
sample to those babies conceived after their mother migrated to the surveyed community.
Column (2) estimates equation (1) with this restricted sample, showing that the result is
more or less similar to the one with the full sample. Therefore, migration does not seem to
bias the estimated γ in column (1).37
Another concern on the results in column (1) is that those areas where most Sousou
women live, namely Conakry and Lower Guinea, may have had worsening disease
environ-ments while other areas did not, biasing the estimated γ in equation (1) upwards. Also,
as discussed in section 3.1, Conte’s assumption of power may have reflected the export of
bauxite mined in his region of birth, Lower Guinea. Column (3), using the same restricted
sample as in column (2), replaces year fixed effects in equation (1), βt, with region-by-year
fixed effects so that we compare Sousou and non-Sousou mothers giving birth in the same
region. Now the estimated γ in equation (1) is negative although it is not significantly
36
Forest people (Kissi, Guerze, Toma) are grouped together as one ethnic group, and minority groups and foreigners are also grouped together as the fifth ethnic group. To avoid the bias due to a small number of clusters, I cluster standard errors at the ethnicity-by-period level instead of at the ethnicity level.
37
different from zero. Columns (4) and (5) further restrict the sample to urban and rural
areas, respectively, to see if favoritism may have a different impact on Sousou women living
in urban areas from those in rural areas (because, for example, the support from urban
residents is more important for a non-democratic ruler). The results show that the negative
coefficient in column (3) reflects a decline in infant mortality for Sousou mothers after 1984
in urban areas.
Although the coefficient estimates in columns (3) and (4) are not significantly different
from zero, it could just be due to the insufficient number of observations given that the
size of the coefficient is large relative to the sample mean infant mortality, which is 14.5
percent. The negative point estimate, on the other hand, could also reflect an accidental
surge in infant mortality among Sousou mothers just before Conte seized power in 1984.
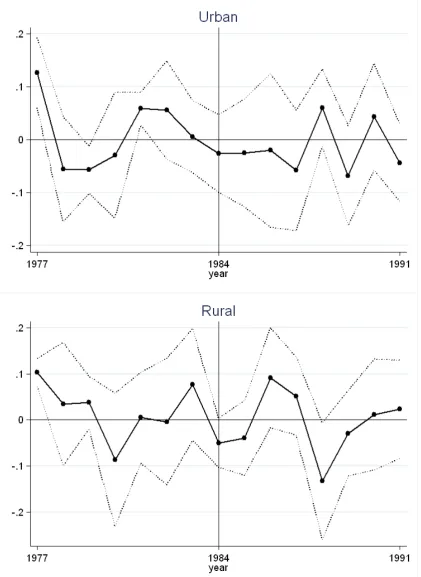
To check the latter possibility, I estimate the following equation for the urban sample
(the one used in column (4) of Table 2):
yimrt = αm+βrt+
1991 X
j=1977
γjSm∗1(t =j) +x′imrtθ+εimrt (2)
where subscript r refers to the region where baby i was born. γj measures the change in
infant mortality in year j compared to the period before 1977.38 If President Conte favors
his own ethnic group, we should see γj = 0 for j ≤1984 and γj <0 forj >1984.
Figure 2 plots the estimated γj’s in equation (2). It reveals that the negative point
estimate in column (4) of Table 2 reflects a surge in infant mortality among Sousou mothers
in 1982. It is therefore difficult to interpret the negative coefficient in column (4) of Table
2 as evidence for favoritism.39
The above results, however, may mask the heterogeneity among Guineans. Ethnic
favoritism may matter only to the better-off segment of the population because they may
be politically more powerful in a non-democratic country. Alternatively, ethnic favoritism
38
Since there are very few babies born in 1992 in the sample, they are treated as being born in 1991 in this estimation.
39
may matter more to the poorer who need government assistance. Panels B and C of Table 2
estimate equation (1) for the subsample of educated and uneducated mothers, respectively,
where having attended primary school is defined as educated.
For babies born to educated mothers (Panel B), the results are similar to Panel A.
Over-all, Sousou mothers, if anything, suffer more from the leadership change in 1984 (columns
(1) and (2)). Once region-by-year fixed effects are controlled for, those in urban areas
appear to benefit though the estimate is imprecise (column (4)). However, estimating
equation (2) for this subsample of babies reveals that the infant mortality for educated
mothers in urban areas has been more or less flat before and after 1984 with an exception
of a hike in 1983 (see Figure 3).
For babies born to uneducated mothers (Panel C), once we compare Sousou babies to
non-Sousou babies born in the same region, the former appear to be less likely to die after
1984 (columns (3) to (5)). Estimating equation (2) for the subsamples in columns (4)
and (5) indicates that these negative point estimates do not reflect the decline in infant
mortality only after 1984, however (see Figure 4).
4.2
Community-level favoritism?
The failure of detecting ethnic favoritism in the previous subsection may be driven by the
fact that ethnic favoritism in Guinea operated not at the individual level but at the
com-munity level. As Bates (1983) argues, ethnicity may matter because of its correlation with
space, and Sousou communities, rather than Sousou individuals, may have been targeted
in the provision of public health services under Conte’s rule. As it is difficult to imagine
that non-Sousou people in the Sousou community are denied access to a community health
clinic, they would have benefited from spatial ethnic favoritism, which biases the estimated
impact of being born to Sousou mothers towards zero in the previous subsection.
In this subsection, I estimate the impact of being born in Sousou communities after 1984.
For this purpose, we need to identify Sousou communities in Guinea. Using the ethnicity
of all the members of the (randomly) sampled households, I obtain the percentage of
Sousou residents in the (sample) population for each surveyed community. I define Sousou
50 percent as the cutoff to be a Sousou community is certainly arbitrary, but using different
threshold values turns out to yield qualitatively similar results.
Table 3 shows the distribution of Sousou communities by region. Overall, Sousou
ac-counts for more than half the population in 17.8 percent of the communities in the sample.
But they are concentrated in Lower Guinea and Conakry. There is no Sousou community
in Middle and Forest Guinea. This table gives an idea about how controlling for
region-by-year fixed effects instead of year fixed effects changes the source of identification for the
effect of being born in Sousou communities.
The following equation is estimated:
yimct =αm+βt+δSc ∗1(t >1984) +x′imctθ+ǫimct (3)
where subscriptcrefers to a community in which baby iwas born,Sc is a dummy variable
equal to one if the population share of Sousou people in community c exceeds 50 percent.
Coefficient δ measures changes in infant mortality for babies born to a mother living in
Sousou communities after 1984 relative to those born in the other communities. To avoid
the measurement error in Sc, the sample is restricted to those babies born in the surveyed
community (the sample used in columns (2) and (3) of Table 2).40 Standard errors are
clustered at the community level.
Column (1) of Table 4 reports the estimated δ in equation (3). It is positive but not
significantly different from zero, suggesting that infant mortality in Sousou communities
did not decline faster after 1984 than in the other communities. Column (2) replaces year
fixed effects with region-by-year fixed effects. Although its size becomes smaller, the point
estimate ofδis still positive and insignificant. Columns (3) and (4) estimate the
region-by-year fixed effect version of equation (3) for the urban and rural subsamples, respectively.
In urban areas only, infant mortality in Sousou communities appears to have dropped more
after 1984 than in the other communities. These results (insignificantly positive estimates
in columns (1), (2), and (4) and an insignificantly negative estimate in column (3)) are
40
As the survey was conducted in 1992 and 1993, Sc is still measured with error if migration had
robust to using 30, 40, 60, 70, 80, or 90 percent as the cutoff percentage for defining Sousou
communities.
As in the previous subsection, we take a closer look at this urban subsample result by
estimating the following equation:
yimcrt =αm+βrt+
1991 X
j=1977
δjSc∗1(t=j) +x′imcrtθ+εimcrt (4)
whereδj measures changes in infant mortality in Sousou communities in yearj compared to
the period up to year 1976. If the negative point estimate in column (3) of Table 4 reflects
community-level ethnic favoritism in urban areas, we should observe δj < 0 for j > 1984
while δj = 0 for j ≤1984.
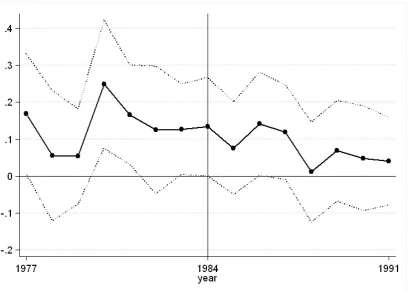
Figure 5 plots the estimated δj in equation (4) for the sample of babies born in urban
communities. It shows that infant mortality in Sousou communities went up in 1980 to the
level significantly higher than the one before 1977, after which the mortality rate had been
on the decline. The negative point estimate in column (3) of Table 4 reflects this pattern of
infant mortality over time, rather than a reduction only after 1984. Using different cut-off
percentages for defining Sousou communities yields similar graphs.
4.3
Sample Selection Bias
The failure of finding evidence for ethnic favoritism could be due to two sources of sample
selection bias: mortality selection and the underrepresentation of women in large
house-holds. Below I show that these two issues appear to be minimal concerns.
Mortality selection Due the nature of the retrospective fertility survey, babies born to
those women dead at the survey time are excluded from the sample. Ethnic favoritism
under President Conte’s rule may have reduced mortality rates of adult women of Sousou
ethnicity but not of the other ethnic groups. Since those women saved by favoritism are
likely to be the least healthy, the survival prospect of their babies may be the most difficult
to improve by government intervention. As a result, babies born to such Sousou mothers
born to Sousou mothers towards zero.
To see if there is a difference in the mortality rates of adult women between Sousou and
the other ethnic groups, I use the data from the maternal mortality module of Guinea’s
1992 DHS survey. In this module, those surveyed women report the number of their
married sisters and the number of those dead among them. Summing these two numbers
by ethnicity of the surveyed women, I can compare the mortality rates of married sisters
of surveyed women between different ethnic groups. This comparison gives us an idea of
the extent to which the mortality selection of women is a serious concern.
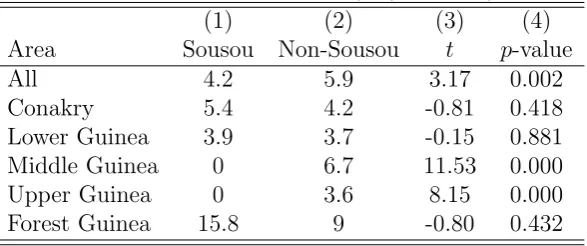
Table 5 reports this statistics by ethnicity and by region. The first row shows that the
country-wide mortality of surveyed women’s married sisters is significantly higher for
non-Sousou ethnic groups; about 4 percent for non-Sousou and nearly 6 percent for the other ethnic
groups. A breakdown by region, however, reveals that the mortality rates are comparable
between Sousou and non-Sousou except for Middle and Upper Guinea, where Sousou women
have significantly lower mortality rates. Since there are very few Sousou women living in
Middle and Upper Guinea (the sample share is below 2 percent; see Panel D of Table 1),
correcting mortality selection bias would change the estimation results little once we control
for region-by-year fixed effects. Table 5, however, suggests that estimation results with year
fixed effects controlled for must be interpreted with caution because the health-related type
distribution of Sousou women is likely to differ from that of non-Sousou women.
Region-by-year fixed effects estimation such as columns (3) to (5) in Table 2 is likely to be more
reliable.
Underrepresentation of women in large households As mentioned in section 3.2
(footnote 34), the sampling method of Guinea’s 1992 DHS survey makes women in a large
household underrepresented in the sample. If the size of a household differs between Sousou
and the other ethnic groups, and if changes in infant mortality since 1984 differ across
households of different size, the estimated γ in equation (1) will be biased.
Indeed, Sousou women in the sample are more likely to come from a household with
more than one eligible woman (ie. aged between 15 and 49). In the sample of 4706 mothers,
for Sousou and 49 percent for the other ethnic groups, with the difference statistically
significant at 1 percent level. Therefore, if those Sousou mothers in larger households are
the chief beneficiaries of ethnic favoritism by President Conte, the underrepresentation of
such mothers in the sample biases the estimated γ in equation (1) towards zero.
To deal with this concern, I estimate the modified version of equation (1) where γ and
year fixed effects are allowed to differ by the number of eligible women in the mother’s
household (the latter henceforth called year-by-eligibility fixed effects). This way, I
com-pare Sousou and non-Sousou mothers with the same number of eligible women in their
household. Since women are randomly sampled from all the eligible women in a household,
the estimatedγ for each number of eligible women should be an unbiased estimator for the
impact of being born to Sousou mothers after 1984. If γ’s for women from a household
with more than one eligible woman are non-negative, it is unlikely that ethnic favoritism
mainly benefits those Sousou mothers in larger households.41
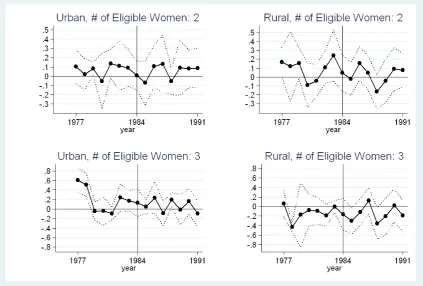
Table 6 shows the estimation results in a parallel fashion to Panel A of Table 2. Once
we allow year-by-eligibility fixed effects to differ by region (columns (3) to (5)), Sousou
mothers from a household with 2 or 3 eligible women appear to see a decline in their
infant’s mortality after 1984. Estimating year-wise changes in infant mortality around the
year of 1984 (by running a modified version of equation (2)), however, yields the same
results as before: there is no clear indication that these negative point estimates reflect the
decline of infant mortality only after 1984 (Figure 6).
Therefore, we can conclude that the underrepresentation of women from a large
house-hold does not appear to bias our estimation results in section 4.1.
5
Conclusion
This paper exploits an exogenous change in the president’s ethnicity in Guinea in 1984
to empirically test a conventional wisdom that the ethnic group in power is better off
than others. Estimation results do not support this claim. After the president’s ethnicity
41
changes, welfare measured by infant mortality does not substantially improve for the new
president’s ethnic group relative to other Guineans.
We cannot exclude the possibility that the impact of favoritism is non-zero but small.
There is also a possibility that the elite members of the new president’s ethnic group may
benefit from power. However, it is unlikely that the new president did have an intention to
favor his own group but the government did not have a capability to achieve his intention
(because the country-wide infant mortality rate was on the decline under the new president’s
rule). Sample selection bias due to the design of the survey used in this paper appears to
be a minimal concern. Consequently, we may conclude that the ethnicity in power did not
matter substantially to the welfare of ordinary Guineans. These results imply that caution
needs to be taken against assuming, without solid evidence, that the ethnicity of political
leaders makes a difference to each ethnic group’s welfare.
Future research needs to investigate whether this paper’s finding is specific to Guinea or
also applicable to other ethnically diverse countries. One factor that characterises Guinea
during the period of investigation is that the president assumed power non-democratically.
Bates (1983) argues that politicians rely on ethnic appeal to seek political support because,
due to the correlation between ethnicity and space, one ethnic group predominates in each
constituency. In democracy, obtaining the support from a majority of people in each
constituency is crucial to stay in power. In non-democracy, however, what needs to stay
in power may be just the support from people in the capital city or in the military, where
in the case of Guinea, no single ethnic group predominates. How political regimes affect
ethnic favoritism needs to be understood in future research.42
References
[1] Adamolekun, ’Ladipo. 1976.Sekou Toure’s Guinea. London: Methuen & Co.
[2] Alesina, Alberto, Arnaud Devleeschauwer, William Easterly, Sergio Kurlat, and
Ro-main Wacziarg. 2003. “Fractionalization.”Journal of Economic Growth, 8, pp. 155-94.
42
[3] Alesina, Alberto and Eliana La Ferrara. 2005. “Ethnic Diversity and Economic
Per-formance.” Journal of Economic Literature, 43, pp. 762-800.
[4] Banerjee, Abhijit V. and Rohini Pande. 2007. “Parochial Politics: Ethnic Preferences
and Political Corruption.” BREAD Working Paper, no. 152.
[5] Barkan, Joel D. and Michael Chege. 1989. “Decentralizing the State: District Focus
and the Politics of Reallocation in Kenya.” Journal of Modern African Studies, 27:3,
pp. 431-453.
[6] Bates, Robert H. 1983. “Modernization, Ethnic Competition, and the Rationality of
Politics in Contemporary Africa.” in Donald Rothchild ed.State Versus Ethnic Claims:
African Policy Dilemmas. Boulder: Westview Press.
[7] Brune, Stefan. 1999. “Guinea.” in Dieter Nohlen, Michael Krennerich, and Bernhard
Thibaut eds.Elections in Africa: A Data Handbook. Oxford: Oxford University Press.
[8] Campbell, Bonnie K. 1991. “Negotiating the Bauxite/Aluminium Sector under
Nar-rowing Constraints.” Review of African Political Economy, 51, pp. 27-49.
Recent Evidence from Albania.” European Economic Review, 45, pp. 405-23.
[9] Easterly, William and Ross Levine. 1997. “Africa’s Growth Tragedy: Policies and
Ethnic Divisions.” Quarterly Journal of Economics, 112, pp. 1203-50.
[10] Everett, Richard. 1985. “Guinea: A Tough Road Ahead.” Africa Report, 30:4, pp.
19-24.
[11] Gardinier, David E. 1988. “Book Review: Historical Dictionary of Guinea, Second
Edition, by Thomas E. O’Toole.”International Journal of African Historical Studies,
21:4, pp. 722-724.
[12] Glik, Deborah C., William B. Ward, Andrew Gordon, and Fassu Haba. 1989. “Malaria
Treatment Practices Among Mothers in Guinea.”Journal of Health and Social
[13] Graybeal, N. Lynn and Louis A. Picard. 1991. “Internal Capacity and Overload in
Guinea and Niger.” Journal of Modern African Studies, 29:2, pp. 275-300.
[14] Heston, Alan, Robert Summers and Bettina Aten. 2006. “Penn World Table Version
6.2.” Center for International Comparisons of Production, Income and Prices at the
University of Pennsylvania.
[15] Hodonou, Valentin. 2004. “Guinea-Conakry Adrift.” African Geopolitics, 14.
http://www.african-geopolitics.org (accessed 19 July 2007).
[16] Kaba, Lansine. 1977. “Guinean Politics: A Critical Historical Overview.” Journal of
Modern African Studies, 15:1, pp. 25-45.
[17] Kaba, Lansine. 1985. “A New Era Dawns in Guinea.” Current History, 84:501, pp.
174-178 and 187.
[18] Kasara, Kimuli. 2007. “Tax Me If You Can: Ethnic Geography, Democracy, and the
Taxation of Agriculture In Africa.”American Political Science Review, 101:1, pp.
159-72.
[19] Knippenberg, Rudolf, Eusebe Alihonou, Agnes Soucat, Kayode Oyegbite, Maria
Calivis, Ian Hopwood, Reiko Niimi, Mamadou Pathe Diallo, Mamadou Conde, and
Samuel Ofosu-Amaah. 1997. “Implementation of the Bamako Initiative: Strategies in
Benin and Guinea.”International Journal of Health Planning and Management, 12:S1,
pp. S29-S47.
[20] La Porta, Rafael, Florencio Lopez-de-Silanes, Andrei Shleifer, and Robert W. Vishny.
1999. “The Quality of Government.” Journal of Law, Economics, & Organization,
15:1, pp. 222-79.
[21] Miguel, Edward and Mary Kay Gugerty. 2005. “Ethnic Diversity, Social Sanctions,
and Public Goods in Kenya.” Journal of Public Economics, 89, pp. 2325-68.
[22] Momoh, Eddie. 1984. “A Dawn Descends, A Myth Broken.” West Africa, 9 April, pp.
[23] Montalvo, Jose G. and Marta Reynal-Querol. 2005. “Ethnic Polarization, Potential
Conflict, and Civil Wars.” American Economic Review, 95:3, pp. 796-816.
[24] Murdock, George Peter. 1967. “Ethnographic Atlas: A Summary.”Ethnology, 6:2, pp.
109-236.
[25] O’Toole, Thomas and Janice E. Baker. 2005. Historical Dictionary of Guinea: Fourth
Edition. Lanham, Maryland: The Scarecrow Press.
[26] Posner, Daniel N. 2005. Institutions and Ethnic Politics in Africa. Cambridge:
Cam-bridge University Press.
[27] Posner, Daniel N. 2007. “Regime Change and Ethnic Cleavages in Africa.”Comparative
Political Studies, 40:11, pp. 1302-1327.
[28] Reinikka, Ritva and Jakob Svensson. 2004. “Local Capture: Evidence from a Central
Government Transfer Program in Uganda.” Quarterly Journal of Economics, 119:2,
pp. 679-705.
[29] Riviere, Claude. 1977. Guinea: The Mobilization of a People. Ithaca: Cornell
Univer-sity Press.
[30] Schissel, Howard. 1986. “Conte in Control.” Africa Report, 31:6, pp. 21-25.
[31] Sillah, Alhassan. 2007. “Guinea’s Strongman Feels the Heat.” BBC News, 22 January,
http://news.bbc.co.uk/1/hi/world/africa/6287961.stm (accessed 20 July 2007).
[32] Tishken, Joel E. 1994. “Book Review: Ethnicity and Conflict in the Horn of Africa by
Katsuyoshi Fukui; John Markakis.” African Economic History, 22, pp. 149-153.
[33] World Bank. 2005. “Project Appraisal Document on a Proposed Credit in the Amount
of SDR 16.6 Million (US$25 Million Equivalent) to the Republic of Guinea for a Health
Sector Support Project.” http://go.worldbank.org/XDNQC6V6F0 (accessed 19 July
2007).
[34] Yansane, Aguibou Y. 1990. “Guinea: The Significance of the Coup of April 1984 and
Figure 1: Average Infant Mortality by Year of Birth
Figure 2: Changes in infant mortality for Sousou mothers in urban areas
Notes: Plotted are the estimatedγj in equation (2) in the text for the sample of babies born in the urban
Figure 3: Changes in infant mortality for educated Sousou mothers in urban areas
Notes: Plotted are the estimatedγj in equation (2) in the text for the sample of babies born to an educated
Figure 4: Changes in infant mortality for uneducated Sousou mothers
Notes: Plotted are the estimated γj in equation (2) in the text for the sample of babies born to an
Figure 5: Changes in infant mortality in urban Sousou communities
Notes: Plotted are the estimatedδj in equation (4) in the text for the sample of babies born in the urban
Figure 6: Changes in infant mortality for Sousou mothers by areas and by the number of eligible women in their household
Notes: Plotted are the estimated coefficientsγw
j forw= 2,3 in the following equation
yimwrt = αm+βwrt+
4
X
w=1 1991X
j=1977
γw
j Sm∗1(t=j)∗Nw+x′imwrtθ+εimwrt
where subscript w refers to the number of eligible women in motherm’s household and Nw is a dummy
Table 1: Differences in women’s socio-economic characteristics by ethnicity and by region
(1) (2) (3) (4) (5) (6)
All Conakry Lower Guinea Middle Guinea Upper Guinea Forest Guinea
Panel A: Percentage of women who attended primary school
Sousou 26.3*** 49.6 17.7*** 41.2** 31.3 44.4
Peulh 17.0*** 37.4*** 19.1 13.6*** 13.7*** 16.7**
Malinke 23.2 54.6* 46.6*** 37.8*** 19.6 18.1***
Foresters 35.4*** 54.5 46.4** 33.3 45.2*** 33.9***
Total 23.1 46.8 20.4 15.0 19.2 26.4
Panel B: Percentage of women with access to electricity
Sousou 47.5*** 89.8 33.4** 35.3 46.7 37.5
Peulh 29.2*** 83.2** 34.8 18.5*** 25.7 31.1***
Malinke 30.1 90.3 63.8*** 36.4** 27.0 17.8*
Foresters 16.6*** 90.9 53.6* 33.3 35.5 11.3***
Total 31.3 87.8 35.9 19.6 27.2 15.5
Panel C: Percentage of women owning a television set
Sousou 16.8*** 38.1** 9.8*** 17.6 13.3 0.0***
Peulh 8.0*** 37.2* 11.0 3.3*** 3.9 1.1
Malinke 9.5 59.2*** 32.4*** 20.5*** 6.0 1.2
Foresters 4.2*** 63.6* 28.6* 8.3 6.5 0.9
Total 9.7 42.6 11.7 4.2 5.7 1.0
Panel D: Number of women in the sample
Sousou 1107 273 792 17 16 9
Peulh 2112 188 457 1143 234 90
Malinke 1634 108 73 45 901 507
Foresters 755 22 28 12 31 662
Total 5608 591 1350 1217 1182 1268
Sources: Guinea 1992 Demographic and Health Survey.
Table 2: Impact on infant mortality of being born to Sousou mothers after 1984
(1) (2) (3) (4) (5)
All No migration No migration Urban Rural
Panel A: All babies
Born to Sousou mothers 0.016 0.014 -0.011 -0.026 0.000
after 1984 (0.013) (0.018) (0.018) (0.020) (0.014)
Mother FE YES YES YES YES YES
Year FE YES YES NO NO NO
Region-by-year FE NO NO YES YES YES
Other controls YES YES YES YES YES
# of clusters 10 10 10 10 10
# of observations 18932 13837 13837 6161 7676
Panel B: Babies born to educated mothers
Born to Sousou mothers 0.018 0.026∗ -0.008 -0.012 0.025
after 1984 (0.011) (0.012) (0.016) (0.015) (0.072)
Mother FE YES YES YES YES YES
Year FE YES YES NO NO NO
Region-by-year FE NO NO YES YES YES
Other controls YES YES YES YES YES
# of clusters 10 10 10 10 10
# of observations 3259 1931 1931 1364 567
Panel C: Babies born to uneducated mothers
Born to Sousou mothers 0.015 0.013 -0.008 -0.019 -0.004
after 1984 (0.014) (0.019) (0.018) (0.024) (0.013)
Mother FE YES YES YES YES YES
Year FE YES YES NO NO NO
Region-by-year FE NO NO YES YES YES
Other controls YES YES YES YES YES
# of clusters 10 10 10 10 10
# of observations 15626 11885 11885 4791 7094
Table 3: Percentage of Sousou communities by region
(1) (2) (3)
All Urban Rural
All 17.8 19.1 16.1
Lower Guinea 53 46 60
Middle Guinea 0 0 0
Upper Guinea 2.1 0 4.2
Forest Guinea 0 0 0
Conakry 48.1 48.1 n.a.
Table 4: Impact on infant mortality of being born in Sousou communities after 1984
(1) (2) (3) (4)
No migration No migration Urban Rural
Sousou communities 0.025 0.010 -0.031 0.033
after 1984 (0.018) (0.023) (0.034) (0.037)
Mother FE YES YES YES YES
Year FE YES NO NO NO
Region-by-year FE NO YES YES YES
Other controls YES YES YES YES
# of clusters 445 445 247 198
# of observations 13837 13837 6161 7676
Notes: Standard errors reported in parentheses are clustered at the community level. The number of clusters used for standard error estimation is reported in the row entitled# of clusters. Other controls include dummies for baby girls, babies born in multiple birth, and birth orders (2nd to 8th and 9th or higher). The sample excludes babies conceived in other locations than the community where their mother was surveyed. Columns (3) and (4) further restrict the sample to those babies born in urban and rural areas, respectively. * significant at 10% level, ** 5%, *** 1%.
Table 5: Maternal mortality by ethnicity
(1) (2) (3) (4)
Area Sousou Non-Sousou t p-value
All 4.2 5.9 3.17 0.002
Conakry 5.4 4.2 -0.81 0.418
Lower Guinea 3.9 3.7 -0.15 0.881
Middle Guinea 0 6.7 11.53 0.000
Upper Guinea 0 3.6 8.15 0.000
Forest Guinea 15.8 9 -0.80 0.432
Sources: Guinea 1992 Demographic and Health Survey.
Notes: Shown in columns (1) and (2) are the percentages of dead women among married sisters of the interviewed women in the survey. Column (3) showstvalues for the null that these percentages are the same between Sousou and non-Sousou.
Table 6: Checking sample selection bias due to the number of eligible women in households
(1) (2) (3) (4) (5)
All No migration No migration Urban Rural
Sousou after 1984 interacted with
1 eligible woman 0.016 0.030∗∗ 0.011 -0.023 0.058∗∗
(0.010) (0.014) (0.018) (0.028) (0.021)
2 eligible women 0.003 0.001 -0.012 -0.003 -0.035∗∗∗
(0.019) (0.022) (0.022) (0.043) (0.011)
3 eligible women 0.009 -0.005 -0.079∗∗ -0.115∗∗∗ -0.044
(0.026) (0.030) (0.035) (0.025) (0.049)
4+ eligible women 0.073∗∗∗ 0.035 0.105∗∗ 0.090 0.225∗∗
(0.019) (0.035) (0.051) (0.055) (0.084)
F-statistics 3.97** 4.86** 5.44** 5.80** 12.36***
p-value [0.047] [0.028] [0.021] [0.017] [0.002]
Mother FE YES YES YES YES YES
Year-by-eligibility FE YES YES NO NO NO
Region-by-year-by-eligibility FE NO NO YES YES YES
Other controls YES YES YES YES YES
# of clusters 10 10 10 10 10
# of observations 18932 13837 13837 6161 7676
Notes: Reported are the coefficients on the interaction terms of the indicator of being born to a Sousou mother after 1984 with the indicators for this mother living in a household where the number of women eligible for the survey (ie. aged between 15 and 49) is 1, 2, 3, and 4 and above. Year-by-eligibility FEandRegion-by-Year-by-eligibility FErefer to the year fixed effect and the region-by-year fixed effect, respectively, interacted with indicators for the number of eligible women in a mother’s household (1, 2, 3, and 4 and above). F-statistics andp-value show the results of testing the equality of the four reported coefficients. Standard errors reported in parentheses are clustered at the ethnicity-by-period level where the period refers to years until 1984 or years after 1984. The number of clusters used for standard error estimation is reported in the row entitled