91
J Trop Soils, Vol. 21, No. 2, 2016: 91-97DOI: 10.5400/jts.2016.21.2.91
J Trop Soils, Vol. 21, No. 2, 2016: 91-97 ISSN 0852-257X
Carbon Stock in Integrated Field Laboratory Faculty of Agriculture
University of Lampung
Irwan Sukri Banuwa, Tika Mutiasari, Henrie Buchari and Muhajir Utomo
Department of Soil Science, Faculty of Agriculture, Universitas Lampung, Jln. Prof. Soemantri Brodjonegoro, No. 1, Bandar Lampung 35145, Indonesia
email: irwanbanuwa@yahoo.com
Received 2 Janury 2016 / accepted 30 April 2016 ABSTRACT
Penelitian ini bertujuan untuk mengetahui jumlah karbon tersimpan dan jumlah serapan CO2 di Laboratorium Lapang Terpadu Fakultas Pertanian Universitas Lampung. Penelitian dilaksanakan dari bulan April 2015 sampai dengan November 2015. Penelitian disusun dalam rancangan acak kelompok lengkap (RAKL), sebagai perlakuan adalah lima satuan lahan dengan 4 ulangan. Estimasi biomassa tanaman kayu menggunakan persamaan allometrik, estimasi biomassa tanaman bawah menggunakan persamaan berat kering tanaman, untuk analisis Organik tanaman dan C-Organik tanah di laboratorium menggunakan metode Walkley and Black. Hasil penelitian menunjukkan bahwa satuan lahan dengan tutupan vegetasi tanaman berkayu yang rapat berpengaruh nyata terhadap total biomassa tanaman kayu, besar C-Organik tanaman kayu dan jumlah karbon total. Biomassa tanaman kayu terbesar pada satuan lahan 5 yaitu sebesar 1.196,88 Mg ha-1, dan karbon total sebesar 437,19 Mg ha-1. LLT FP Unila memiliki total karbon tersimpan sebesar 2.051,90 Mg dengan kemamapuan menyerap CO2total sebesar 6.656,88 Mg.
Kata kunci: Biomassa, C-organik, karbon tersimpan, persamaan Allometrik
This study aimed to determine the amount of carbon stock and CO2 plant uptake in the Integrated Field Laboratory (IFL) Faculty of Agriculture University of Lampung. The research was conducted from April to November 2015. The study was arranged in a completely randomized block design (CRBD), consisting of five land units as treatment with four replications for each treatment. Biomass of woody plants was estimated using allometric equation, biomass of understorey plants was estimated using plant dry weight equation, and organic C content in plants and soils were analyzed using a Walkey and Black method. The results showed that land unit consisting of densely woody plants significantly affects total biomass of woody plants, organic C content in woody plants and total carbon content (above and below ground). The highest amount of woody plant biomass was observed in land unit 5,i.e. 1,196.88 Mg ha-1, and above ground total carbon was 437.19 Mg ha-1. IFL Faculty of Agriculture University of Lampung has a total carbon stock of 2,051.90 Mg and capacity to take up total CO2 of 6,656.88 Mg.
Keywords: Allometric equations, biomass, CO2 plant uptake, organic-C, total carbon
ABSTRAK
INTRODUCTION
Forest plays an important role, among others, as a source of carbon stock in nature, in which carbon is stored as vegetative biomass and soil carbon. Conversion of forest into other land uses has led an increase of CO2 emission into atmosphere, which is derived from biomass burning and mineralization of soil organic carbon during
clearing, and loss of vegetation as carbon sink (C-sink) (Widiantoet al. 2003).
92
gigatons CO2 released into atmosphere during 1850 until 2000, and that amount is increasing continously and has led global warming, resulting in an increase of average temperature of atmosphere, sea and terrestrial. The increase of temperature on earth has caused ice melting in the Arctic Pole and an increase of sea water temperature, which further increases sea volume and sea level about 9 to 100 cm. If the global warming goes on, it may cause major disaster worldwide (Appset al. 2003).
Based on the reasons mentioned above, healthy environmental management should be developed by controlling the amount of CO2 in the atmosphere. One way to control the amount of CO2 in the atmosphere is by increasing the amount of CO2 uptake by plants as much as possible and mitigating CO2 emission into atmosphere as low as possible (Lasco 2002). Forest preservation, tree cultivation on agricultural land and peat preservation are important actions to mitigate excessive amounts of CO2 in the atmosphere. On the other hand, long term intensive farming can decrease the amount of soil organic matter and increase CO2 emission into atmosphere (Sleutelet al. 2006; Nieder and Richter 2000). Therefore, measuring the amount of carbon stored in plants (biomass) on a certain land use can indicate the amount of CO2 in the atmosphere that is taken up by plants (Hairiah and Rahayu 2007).
The amount of carbon stock in each land use varies, depending on diversity and density of vegetation, soil types, and soil management. Carbon stock in a land use can be higher if the soil has good fertility status, or in other words the above ground of carbon stock (vegetative biomass) is determined by the the amount of carbon stock in soil (soil organic matter, SOM) (Hairiah and Rahayu 2007). Negash and Starr (2015) reported that the carbon stock in herbage was lower than that in coffee plants, and the highest carbon stock was found in trees. In addition, Chitiel at. (2012) indicated that different amount of carbon stock is also determined by climate regime and landscape.
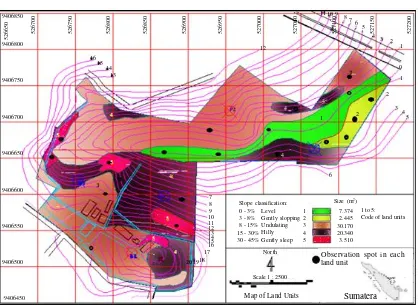
Integrated Field Laboratory (IFL) Faculty of Agriculture University of Lampung is a field that can be used for doing research and practicum for lecturers and students of Faculty of Agriculture University of Lampung, which is located at the campus of University of Lampung, covering about 6.784 ha. Banuwa, Syam and Wiharso (2011) showed that IFL has various slopes, based on slope classification IFL has five different land units, namely land unit 1 with slope of 0-3% (level) covering about 0.737 ha; land unit 2 with slope of 3-8% (gently sloping) covering about 0.245 ha; land unit 3 with slope of 8-15% (undulating) covering
about 3.417 ha; land unit 4 with slope of 15-30% (hilly) covering about 2.034 ha; and land unit 5 with slope of 30-45% (gently steep) covering about 0.351 ha. With various slopes (level up to gently steep) IFL has a high potential erosion, as a result the soil is vulnerable to lose nutrient and organic matter, which are important for plant growth and development. As a supporting facility of learning activities for academia at the University of Lampung, environmental sustainability and soil fertility of IFL should be maintained.
The objective of this study was to determine the carbon stock in IFL Faculty of Agriculture University of Lampung with various slopes.
MATERIALS AND METHODS
Location of the Study
The study was conducted at Integrated Field Laboratory and analysis of soil organic carbon was conducted at Laboratory of Soil Chemistry, Faculty of Agriculture, University of Lampung. The research was performed in April until November 2015. The map of IFL was presented in Figure 1.
Calculation of Carbon Stock
Biomass of woody plants was estimated using allometric equation, without destructing the plants (non destructive). Observations were conducted by recording the names of trees, measuring the diameters of trees at breast height (dbh),i.e. 1.3 m above ground using a measuring tape, and measuring the height of woody plants at the experimental plots (5m x 5m) for each land unit using christen meter, then the biomass was calculated using allometric equation. Allometric equation used in this study was developed by Alternative to Slash and Burn (Table 1) (Hairiah and Rahayu 2007). Biomass of understorey plants was estimated by destructing the plants and then the biomass was calculated using plant dry weight equation. Observation was performed by cutting the understorey plants at the experimental plots (1m x 1m) and weighing the plants, and then 100 g of understorey plants were oven-dried at 80oC for 48 h and weighed in. Biomass
of understorey plants was calculated using total plant dry weight equation, namely:
(g)
Figure 1. Map of Integrated Field Laboratory Faculty of Agriculture University of Lampung, Lampung, Indonesia (Banuwaet al. 2011).
Map of Land Units
Scale 1 : 2500
North Observation spot in each
land unit Code of land units
526650
526700 526750 526800 526850 526900 526950 527000 527050 527100 527150 527200
1 ml of H2SO4 were added into erlenmeyer flask (in a fume hood). After the suspension was cooled, 100 ml of distilled water, 5 ml of H3PO4, 2.5 ml of NaF 4% and 5 drops of diphenylamine indicator were added into the suspension. After that, the suspension was titrated with ammonium ferrous sulfate solution into a final color change of light green (Afandiet al. 2011).
The above ground carbon stock was calculated after the data of plant biomass and organic C content in plants were collected, then the above ground carbon stock was calculated using equations developed by Alternative to Slash and Burn (Hairiah
and Rahayu 2007). The amount of carbon uptake by plants was calculated using the following equation (Rifyunando 2011).
The data of woody plant biomass, understorey plant biomass, organic C content in woody plants, organic C content in understorey plants and total
Table 1. Estimation of Tree Biomass using Allometric Equations.
Type of tree Estimation of tree biomass,
kg per tree Reference Branched tree BK = 0.11pD2.62 Ketterings (2001)
Non-branched tree BK = πpH D2/40 Hairiahet al.(1999)
Banana tree BK = 0.030 D2.13 Arifin (2001)
Bamboo BK = 0.131 D2.28 Priyadarsini (1999)
“Sengon” tree BK = 0.0272 D2.831 Sugiharto (2002)
94
carbon were statistically tested using analysis of variance (ANOVA) and least significant difference test (LSD) with a significance level of 5%.
RESULTS AND DISCUSSION
Above ground Carbon Stock
The amount of woody plant biomass in each land unit at IFL varies. The highest amount of woody plant biomass was observed in land unit 5, i.e. 1,196.88 Mg ha-1 and the lowest amount of biomass
was found in land unit 2,i.e. 237.43 Mg ha-1. The
amount of plant biomass is determined by the number of stands and the number of population of woody plants in a land unit, land unit 5 with slope of 30 – 45% (gently steep) is rarely used for cultivation for both practicum and research, as a result the population of woody plants in land unit 5 is abundant and diverse, and the predominant plant species observed is woody plants. In addition, land unit 5 is densely covered by woody plants. In contrast, in land unit 2 (slope of 3 – 8%), which is classified as gently sloping, the amount of woody plant biomass is very low because the land unit 2 is frequently used as experimental plots for both practicum and research, which are cultivated with food crops, such as maize, sorghum and cassava, and interplanted with some coconut trees, consequently the amount of plant biomass in land unit 2 is the lowest among other land units (Table 2).
The results of this study showed that the amount of understorey plant biomass in different land units is not significanly different. Land unit 1 is dominated by paddy fields and fish ponds including some coconut trees and “pasiran” trees. As a result,
the land was uncovered and hardly any shade that can hamper the growth of understorey plants was observed. Chang (1968) and Chambers (1978) suggest that shade can affect environmental factors, such as temperature, soil moisture, aeration, nutrient immobilization and weed control. The non-significantly different of the amount of understorey plant biomass in different land units is also observable for the non-significantly different of organic C content in understorey plants.
The content of organic C in woody plants among land units is significantly different, which is due to the diversity of woody plants in each land unit, land unit 4 has the lowest organic C content in woody plants among other land units,i.e. 36.07%, which is not significantly different from land unit 1 that has 41.02% organic C content. This finding is due to the diversity of plant species in land unit 4 and 1 is relatively similar, which is dominated by banana trees and some coconut trees. On the other hand, land unit 2 (46.50%), land unit 3 (44.49%) and land unit 5 (43.02%) have the highest organic C content in woody plants among other land units, due to the number of plants in those land units are higher than that in land unit 1 and 4.
The above ground carbon stocks in land unit 1, 2, 3, 4 and 5 are 143.07 Mg ha-1; 88.79 Mg ha-1;
260.71 Mg ha-1, 327.04 Mg ha-1; and 437.19 Mg
ha-1, respectively, in which land unit 5 has the
highest total carbon stock,i.e. 437.19 Mg ha-1. The
main source of above ground carbon stock is woody plant biomass that grows in land unit 5 including ketapang trees (Terminalia catappa), bayur trees (Pterospermum acerifolium), “pasiran” trees, randu trees (Ceiba pentandra), coconut trees, sugar palm trees (Borassus falbellifer), waru trees
Table 2. The effect of land unit on the amount of woody plant biomass, the amount of understory plant biomass, organic C content in woody plants, organic carbon content in understory plants and total aboveground carbon.
Note: Value followed by the same letter in the same column were not significantly different according to LSD test for 5%. Value in parantheses were transformation by x
Land Unit
Biomass of Woody Plants
Biomass of Understory
Plants
Organic C in Woody Plants
Organic C in Understory
Plants
Total Aboveground
Organic C
Mg ha-1 Mg ha-1 % % Mg ha-1
1 372.97 ab 0.147 (0.38) a 41.02 ab 34.34 a 143.07 ab
2 237.43 a 0.098 (0.31) a 46.50 b 27.79 a 88.79 a
3 655.28 abc 0.11 (0.33) a 44.49 b 35.54 a 260.71 abc
4 938.80 bc 0.12 (0.34) a 36.07 a 31.13 a 327.04 abc
5 1.196.88 c 0.11 (0.33) a 43.02 b 29.66 a 437.19 c
Sumber: Banuwaet al. (2011) (Hibiscus tiliaceus) and bamboo. Plants take up CO2 from the atmosphere, which is further converted into C6H12O6, and O2 that is released into atmosphere, and food stock (i.e. carbohydrate molecules) that is stored as biomass. On the other hand, land unit 2 has the lowest above ground carbon stock, i.e. 88.79 Mg ha-1. With slope of 3-8% that is
classified as gently sloping, land unit 2 is an ideal land for cultivation, consequently land unit 2 is frequently used for experimental plots for both practicum and research, and generally cultivated with annual crops and food crops. As a result, the above ground organic carbon stock in this land unit is the lowest among other land units.
Bouwman (1990) suggested that plants as carbon sink helps to mitigate CO2 in the atmosphere via photosynthesis, in which CO2 is taken up and converted by plants into organic carbon in the form of biomass. Biomass can absorb energy, which is further converted into carbon in plants, especially in woody plants. The absolute carbon content in biomass or the amount of carbon stored in biomass is called carbon storage or carbon stock (Appset al. 2003).
Soil Organic Carbon
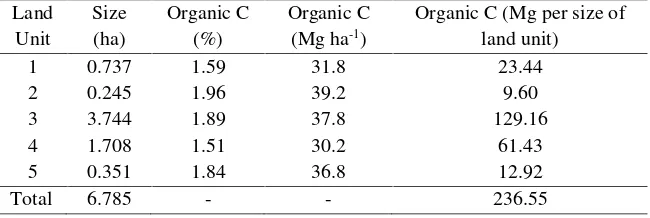
The content of organic C in top soils (0 – 20
cm) is between 1.51% and 1.96%. Table 3 presents the content of soil organic C in each land unit.
The content of soil organic C indicates the amount of carbon taken up by plants via photosynthesis, which further goes into soil via decomposition and accumulate in soil. High soil erosion rate can lose carbon that stored in soil (Banuwa 2013). The content of soil organic carbon also indicates the condition of plants that cover the land. In uncovered lands, the ability of plants to take up carbon via photosynthesis is smaller than that of plants in covered lands. Higher organic carbon content in soil indicates higher above ground photosynthesis process in which carbon is found.
The highest soil organic C content is observed in land unit 2,i.e. 1.96% in the top soil 0-20 cm. Land unit 5, which has the highest amount of plant biomass or above ground carbon, contains 1.84% soil organic C, which is lower than that in land unit 2 and 3. Land unit 2 and 3 are always used for experimental plots (practicum) of cultivated crops, so N fertilizer is always applied to these lands, as a result both land unit 2 and 3 have the highest soil organic matter content among other land units. This finding is in line with the study of Utomoet al. (2012) that indicated that the treatments of zero tillage and application of 200 kg N ha-1 was able to increase
46.1% soil organic carbon in comparison with without N fertilizer application. Further, the low content of soil organic C in land unit 5 may be due to land unit 5 has steep slope (30-45%), causing high erosion rate and runoff that happen continuously, consequently the content of soil organic C in land unit 5 becomes low. In addition, due to erosion, decomposition process of plant residues in the top soil becomes slow and hampered, as a result the content of soil organic C becomes low.
CO2 Plant Uptake
The results showed that CO2 uptake by plants in land unit 1 is about 524.65 Mg ha-1 or 386.67 Mg
per size of land unit 1, the uptake in land unit 2 is 325.60 Mg ha-1 or 79.77 Mg per size of land unit 2,
the uptake in land unit 3 is 956.03 Mg ha-1 or 3,579.38
Mg per size of land unit 3, the uptake in land unit 4 is 1,199.27 Mg ha-1 or 2,048.35 Mg per size of land
unit 4, and the uptake in land unit 5 is 1,603.17 Mg ha-1 or 562.71 Mg per size of land unit 5, so the total
CO2 uptake for all land units is 4,608.72 Mg ha-1 or
6,656.88 Mg per 6.78 ha (total size of IFL) (Table 4 and 5). In conclusion, IFL has capacity to take up carbon dioxide of 386.67 Mg ha-1 in land unit 1; 79.77
Mg ha-1 in land unit 2; 3,579.38 Mg ha-1 in land unit 3;
2,048.35 Mg ha-1 in land unit 4 and 562.71 Mg ha-1 in
land unit 5. In total, IFL has capacity to take up CO2 of 6,656.88 Mg.
Table 3. The content of soil organic C.
Land Unit
Size (ha)
Organic C (%)
Organic C (Mg ha-1)
Organic C (Mg per size of land unit)
1 0.737 1.59 31.8 23.44
2 0.245 1.96 39.2 9.60
3 3.744 1.89 37.8 129.16
4 1.708 1.51 30.2 61.43
5 0.351 1.84 36.8 12.92
96
Table 4. The amount of plant biomass. total aboveground organic C and CO2 uptake.
Land unit Total biomass (Mg ha-1)
Total aboveground organic C (Mg ha-1)
CO2uptake
(Mg ha-1)
1 373.35 143.07 524.65
2 237.74 88.79 325.60
3 655.60 260.71 956.03
4 939.14 327.04 1,199.27
5 1,197.21 437.19 1,603.17
total 3,403.05 1,256.81 4,608.72
Table 5. Total biomass, total aboveground organic C and CO2 uptake.
Land unit
Size (ha)
Total biomass (Mg per size of land unit)
Total aboveground organic C (Mg per size of land unit)
Total CO2uptake (Mg
per size of land unit)
1 0.737 275.16 105.45 386.67
2 0.245 58.25 21.75 79.77
3 3.744 2,454.59 976.11 3,579.38
4 1.708 1,604.05 558.59 2,048.35
5 0.351 420.22 153.45 562.71
total 6.784 4,812.27 1,815.35 6,656.88
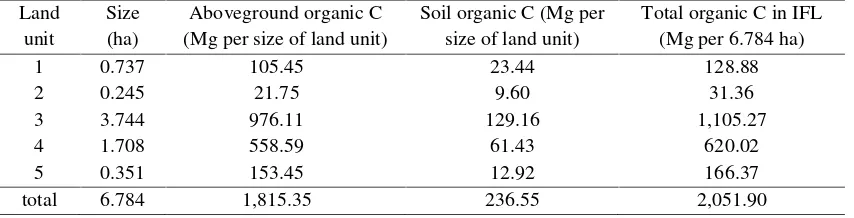
Total Carbon
Total carbon stock in IFL Faculty of Agriculture University of Lampung is presented in Table 6.
The results showed that land unit 5, which is densely covered by woody plants, significantly affect total biomass, total above ground organic C and CO2 plant uptake,i.e. 1,197.21 Mg ha-1, 437.19 Mg ha-1
and 1,603.17 Mg ha-1, respectively. The more plants
with dense canopy, the more CO2 is taken up by plants (Table 4). This finding corresponds to the study of Banuwa and Buchori (2010) about carbon stock in various farming systems of coffee plantation. The study showed that P5 farming system (i.e. mixed farming system including coffee, pepper, banana and cocoa) consists of more plant population with highly dense canopy, as a result the availability of soil organic carbon is abundant, which further leads
to high soil microbial activity. Based on this condition, P5 farming system has the highest stock of organic carbon. However, because the size of land unit 5 at IFL Faculty of Agriculture University of Lampung is only 0.351 ha, its contribution to total carbon and CO2 plant uptake at IFL Faculty of Agriculture University of Lampung is not that high (Table 6).
CONCLUSIONS
Land unit 5 (gently steep with slope of 30-45%) has the highest total biomass of woody plants among other land units,i.e. 1,196.88 Mg ha-1 and the highest
total above ground carbon,i.e. 437.19 Mg ha-1. IFL
Faculty of Agriculture University of Lampung has total carbon stock of 2,051.90 Mg and total CO2 plant uptake of 6,656.88 Mg.
Table 6. Total carbon in Integrated Field Laboratory Faculty of Agriculture University of Lampung.
Land unit
Size (ha)
Aboveground organic C (Mg per size of land unit)
Soil organic C (Mg per size of land unit)
Total organic C in IFL (Mg per 6.784 ha)
1 0.737 105.45 23.44 128.88
2 0.245 21.75 9.60 31.36
3 3.744 976.11 129.16 1,105.27
4 1.708 558.59 61.43 620.02
5 0.351 153.45 12.92 166.37
REFERENCES
Apps M, J Canadell, M Heiman, V Jaramillo, D Murdiyarso, D Schimel and M Manning. 2003. Science Statement on Current Scientific Understanding of the Processes Affecting Terrestrial Carbon Stocks and Human Influences upon Them. IPCC. Geneva. 37 p.
Arifin J. 2001. Estimasi Penyimpanan C Pada Berbagai Sistem Penggunaan Lahan di Kecamatan Ngantang, Malang, Jurusan Tanah, Fakultas Pertanian, Universitas Brawijaya, Malang, 61 p (in Indonesian). Banuwa IS dan H Buchori. 2010. C-tersimpan pada berbagai pola usahatani berbasis kopi. Prosiding Seminar Nasional Masyarakat Konservasi Tanah dan Air Indonesia, 24-25 November 2010, FP Universitas Jambi. Jambi, Hal. 595-609 (in Indonesian).
Banuwa IS, T Syam dan D Wiharso. 2011. Karakteristik Lahan Laboratorium Lapang Terpadu FP Unila (Laporan Penelitian). Bandar Lampung (in Indonesian).
Banuwa IS. 2013. Erosi. Kencana Prenada Media Group. Jakarta. 204 halaman (in Indonesian).
Bouwman AF. 1990.Soil and Greenhouse Gases. John Willy and Sons. United States. Hal 261-266 Chambers RE. 1978. Klimatologi Pertanian Dasar.
Bogor. Fakultas Pertanian IPB. Halaman 23-24 (in Indonesian).
Chang JH. 1968.Climate and Agriculture An Ecological Survey. Chicago : Aldine Publishing Company. Hal 304-310.
Chiti T, L Gardin, L Perugini, R Quaratino, FP Vaccari, F Miglietta and R Valentini. 2012. Soil organic carbon stock assessment for the different cropland land uses in Italy.Biol Fertil Soils 48: 9-17. doi:10.1007/s00374-011-0599-4.
Hairiah K. 2007. Pengukuran Karbon Stock Diatas Permukaan Tanah. Transkip Presentasi Pada Workshop Lahan Gambut Untuk Perlindungan Iklim Global dan Kesejahteraan Masyarakat. Diselenggarakan Climate Change Forests and Peatlands in Indonesia.Weatlands International. Http : www.wetlands.or.id.com/publications/files/book/ pdf. Diakses tanggal 12 Maret 2015 (in Indonesian). Hairiah K dan S Rahayu. 2007. Pengukuran Karbon Tersimpan di Berbagai Macam Penggunaan Lahan. World Agroforestry Center. Bogor. Indonesia. 77 hlm (in Indonesian).
Hairiah K, MV Noordwijk and C Palm. 1999. Methods for sampling above and below ground organic pools. In: Murdiyarso D, MV Noordwijk and DA Suyamto (eds). Modelling Global Change Impacts on the Soil Environment. IC-SEA Report No. 6. SEAMEO BIOTROP GCTE IC-SEA, Bogor, p: 46-77.
IPCC [Intergovernmental Panel on Climate Change]. 2007: Climate Change 2007: Synthesis Report. Contribution of Working Groups I, II and III to the Fourth Assessment Report of the Intergovernmental Panel on Climate Change. In: RK Pachauri and A Reisinger (eds.)]. IPCC, Geneva, Switzerland, 104 pp.
Ketterings QM, R Coe, MV Noordwijk, Y Ambagau and C Palm. 2001. Reducing uncertainty in the use of allometric biomass equations for predicting above-ground tree biomass in mixed secondary forests. Forest Ecol Manage146: 199-209.
Lasco RD. 2002. Forest Carbon Budgets an Southeast Asia Following Harvesting and land Cover Change. In: Impacts of Land Use Change on the Terrestrial Carbon Cycle in the Asian Pasific Region.Science in China 45: 76-87.
Murdiyarso D, U Rosalina, K Hairiah, L Muslihat, INN Suryadiputra dan Adijaya. 2004. Petunjuk Lapang Pendugaan Cadangan Karbon Diatas dan di bawah Permukaan Pada Lahan Gambut. Proyek Climate Change, Forests and Peatlands in Indonesia. Wetlands International-Indonesia Programme dan Wildlife Habitat Canada. Bogor. Indonesia.www.wetlands.or.id.com/climate/ publication/reference/files/book/pdf. Diakses Tanggal 12 Maret 2015.
Negash M dan M Starr. 2015. Biomass and soil carbon stocks of indigenous agroforestry systems on the south-eastern Rift Valley escarpment, Ethiopia.Plant Soil 393: 95-107. doi 10.1007/s11104-015-2469-6. Nieder R dan J Richter. 2000. C and N accumulation in
arable soils of West Germany and its influence on the environment-developments 1970 to 1998.J Plant Nutr Soil Sci 163:65-72
Priyadarsini R. 1999. Estimasi Modal C (C-stock) Masukan Bahan Organik, dan Hubungannya dengan Populasi Cacing Tanah pada Sistem Wanatani. Program Pasca Sarjana, Universitas brawijaya, Malang. 76 pp (in Indonesian).
Rifyunando dan Regi. 2011. Estimasi Stok Karbon Mangrove di Kawasan Cagar Alam Reuweung Sancang Kecamatan Cibolang Kabupaten Garut. Universitas Pendidikan Indonesia. Bandung (in Indonesian).
Sleutel S, S DeNeve, B Singier dan G Hofman. 2006. Organic C levels in intesively managed arable soil-long term regional trends and characterization of fractions.Soil Use Manage22: 188-196.
Sugiharto C. 2002. Kajian Aluminium Sebagai Faktor Pembatas Pertumbuhan Akar Sengon (Paraserianthes falcataria L. Nelson). Jurusan Tanah, Fakultas Pertanian, Universitas Brawijaya. Malang. 64 pp (in Indonesian).
Utomo M, H Buchari, IS Banuwa, LK Fernando dan R Saleh. 2012. Carbon Storage And Carbon Dioxxide Emission As Influenced By Long-Term Conservation Tillage And Nitrogen Fertilization In Corn-Soybean Rotation.J Tanah Trop17: 75-84.
Thom WO dan M Utomo. 1991. Manajemen Laboratorium dan Metode Analisis Tanah. Universitas Lampung. Bandar Lampung. Hlm. 21-41 (in Indonesian). Widianto, K Hairiah, D Suharjito dan AM Sardjono. 2003.