Competitiveness of Indonesian Shrimp
Compare with Thailand Shrimp in Export Market
Lina Asmara Wati
1*, Wen-I, Chang
2, Moch Muslich Mustadjab
31
Department of Socio-Economic Faculty of Agriculture, Double Degree Program, University of Brawijaya. 2
Department of Agribusiness Management, College of Management, National Pingtung University of Science and Technology, Taiwan.
3
Department of Socio-Economic Faculty of Agriculture, University of Brawijaya
Abstract
With the water area accounts for 81 percent of the total area, fishery is a major business in Indonesia. As one of the world's largest shrimp exporting countries, Indonesia also relies on the revenues of shrimp exports in the international markets. This research compared the competitiveness of shrimp export from Indonesia and Thailand to Japan and US. The indicator adopted in this research was the RCA index. In this research collected secondary data from 1989 to 2010 for analysis. Results showed RCA values of Indonesia were higher than 1, which indicates advantaged competitiveness of Indonesia shrimp exports in the liberalized markets. Nevertheless, compared with Thailand, Indonesia remained relatively disadvantaged. To reinforce the Indonesian shrimp export, necessary infrastructure, such as networks shipment or delivery, packaging and transportation, must be improved. Further researches to determine the factors affecting competitiveness of export shrimp in liberalized market, make and analyze for the policy strategy formulation of Indonesia shrimp export in liberalized market are also advised.
Keywords: Competitiveness; Indonesian Shrimp Export; RCA.
INTRODUCTION
As an archipelago, Indonesia has a great potential in the fisheries industry, especially because it has a fairly broad sea area 7.9 million km2, and coastline along the 80,791 km2 with extensive aquaculture and fish pond spread in some parts of the country. Indonesia has a vast 81 percent water area of the total area of Indonesia, so it is not impossible that Indonesia could rule the business world fisheries. Based on the diversity of types fish, besides tuna shrimp is a main fishery exports of the Indonesia. Indonesia is one of the world's largest shrimp exporting countries, especially to the major markets (Japan and United States markets). However, the positions of Indonesia in recent years are declining and shifted by Thailand, China and Vietnam. This is mainly due to the decline in the competitiveness of Indonesian shrimp in the international market, either because of the efficiency of the business, the ability to penetrate the market, as well as the quality and sanitation issues specifically related to the issue of antibiotics.
However, the development of shrimp
constrained low productivity and quality
Corresponding Address:
Lina Asmara Wati
Email : [email protected]
Address : Department of Socio-Economic Faculty of Agriculture, Double Degree Program, University of Brawijaya.
requirements are not optimal fulfillment. Sustainable export success can only be achieved if high productivity combined with high quality. In the era of globalization, every country can not avoid the trade and foreign relations (relations between states), because without it the country will not be able to survive and compete with other countries. Foreign trade can be considered as an important means and stimulator for the economic growth of a country. The first question in economic research is how to allocate resources, in order to ensure social welfare, including high living standards.
▸ Baca selengkapnya: i……my wallet in this market two months ago
(2)consumption level in Japan increased by 5%. In Thailand, Ex-farm prices of vannamei in Thailand were 20% lower in May than the same month last year as a result of an influx of supplies, but recovered by 2-3% in July as a result of government and industry intervention. Overall, prices of Thai vannamei shrimp have dropped from USD 5.6/kg in January to around USD 4.00/kg in May. Thai frozen shrimp exports in the first five months of 2012 shrank by 2.2% to USD 552 million largely as a result of the drop in exports to EU markets. Exports to the EU, valued at USD 79 million, declined by 16%. The EU market is Thailand’s third biggest market after the USA and Japan [7].
The Danish shrimp industry, a major processor and re-exporter, has been especially hit, and has witnessed a 17 percent drop in exports. The slowing economic growth in China has also cooled the country’s import demand. By contrast, US shrimp imports increased by 3 percent during the first half of the year, boosted by lower prices. Over the same period, deliveries to Japan rose by 2 percent, as retailers took advantage of the lower international prices to promote the product aggressively, a trend that is continuing in the second half of the year. As for exports, supply of vannamei (Pacific white shrimp) from India continued to be adequate during autumn, but the harvest of other species was poor. In Vietnam, the shrimp crop has been affected by disease, which has forced some Vietnamese processors to source vannamei from Thailand and India for export processing. In Thailand, a government scheme to stabilize the price of vannamei has been well-received by shrimp farmers resulting in the firming of shrimp prices during the third quarter [6].
Indonesia is the world's major producer of shrimp. Producing countries are the world's largest shrimp is another Brazil, RRC, Equador,
India, Indonesia, Thailand and Vietnam.
Indonesia has the ability to increase domestic production of shrimp for shrimp aquaculture area has a fairly extensive. Total potential land for shrimp farming approximately 913,000 hectares, however the potential for new areas utilized about 35%. Of shrimp farming land is about 75% of them (about 240,000 ha) is a traditional shrimp productivity is still low at around 0.6 tons / ha. Shrimp commodity commonly traded in the form of fresh shrimp, frozen, processed form of canned shrimp, cooked shrimp and dried shrimp or salted. Consumer demand for shrimp the world average increase of 11.5% per year. It's
become one of the attraction / business prospects commodity shrimp. The market share of the five largest countries exporting shrimp dominated by Canada, Thailand, Indonesia, Vietnam and Russia. Canada has the largest market share is 10.49% and its development trend is only 1.35%, while Thailand with a market share of 9.57% has the biggest trend that is 11.99%. During the period 2004 -2008, Indonesia has a market share of 8.16% with a trend of 1.86% and an exporting country ranks third in the world [4].
Thailand is the world's number one exporter since 1993. Marketing strategies through innovative product development to create value-added products. In addition, the exporter Thailand has committed time and maintain the quality. The power of the shrimp industry is determined by the strong role of entrepreneurs who are members of various associations, and market intellegencia. Ex-farm prices of vannamei in Thailand were 20% lower in May than the same month last year as a result of an influx of supplies, but recovered by 2-3% in July as a result of government and industry intervention. Overall, prices of Thai vannamei shrimp have dropped from USD 5.6/kg in January to around USD 4.00/kg in May. Thai frozen shrimp exports in the first five months of 2012 shrank by 2.2% to USD 552 million largely as a result of the drop in exports to EU markets, according to the Deputy Commerce Minister Poom Sarapol. Exports to the EU, valued at USD 79 million, declined by 16%. The EU market is Thailand’s third biggest market after the USA and Japan [9].
Import export activity reflected in a country's trade balance. Trade liberalization policies that seek to eliminate trade barriers to increase exports, but on the other side can also increase imports. A country aims to have a surplus balance of trade or exports greater than imports. Thus, trade liberalization will affect the trade balance of exports and imports growth. Growth of exports and imports that determine the balance of trade surplus or deficit [17].
shrimp exports is hampered by non-tariff and tariff barriers. Tariffs are applied in order to protect the domestic processed shrimp industry of the country [12]. In the first 5 months in 2012, Thai shrimp exports earned 552 million USD, a drop of 2.23 percent from the same period last year. The exports to the EU during the period were recorded at 79 million US dollars, a decrease of 16 percent due to the Eurozone crisis. In 2011, Thai shrimp exports were as high as 260 million US dollars in value, rising 7.9% from 2010. Europe has been the third largest shrimp market of Thailand after USA and Japan, while Thai frozen shrimp in 2011 was valued at 1.7 billion dollars [14]. Export is one of primary activity in liberalized market. All of export activity must have strategy to get maximum profit, customer, good quality of their products and capable to compete in international market. Some export strategy, is assessing a product's export potential, making the export decision, the value of planning, the planning process and the result and approaches to exporting. Before make a strategy of competitiveness, the first step we must know how about the position Indonesian shrimp in liberalization market.
The researchers are interested in which sector can contribute for their country. So, many
researchers choose research topic about
competitiveness. In order we have many strategies to compete with other countries in liberalized market. From this it appears that the shrimp industry in Indonesia (and also other developing countries) will be more severe, which is related to the downward trend in prices and rising non-tariff barriers. The implication, market development will be owned by the countries that can afford to sell shrimp with better quality, the condition of constant returns to scale and increasing return to scale. Thus, in this research will be analyze the competitiveness of Indonesian shrimp compare with Thailand shrimp in export market. Thailand was chosen because has good
quality and high productivity of shrimp
production.
LITERATURE SUITABLE WITH THE PURPOSE
Indonesia has a large maritime zone, about 5.8 km2 consisting of archipelagic waters, territorial seas, and Exclusive Economic Zones. Its coastline is more than 81,000 km long. Its sustainable fisheries (MSY) of all kinds are about 6.4 million tons a year while its total allowable catch (TAC) is estimated at 80% amounting to about 5.12 million tons annually. Indonesian
national fisheries production grow continuously at an average annual rate of 9.92%, e.q. 6.12 million tons in 2004 to about 9.82 million tons in 2009 [9].
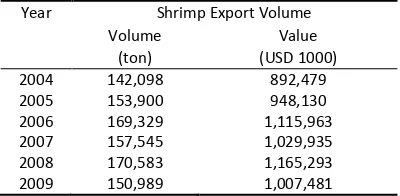
Based on the volume and the value, the average of Indonesian shrimp exports has increased between 2004 and 2009. In 2004 to 2008 the volume and the value always increase but in 2009 decrease. Table 2 provides the volume of Indonesian shrimp export from year 2004 to 2009.
Table 1. The development of Indonesian Shrimp Export Volume
Year Shrimp Export Volume
Volume Value
(ton) (USD 1000) 2004 142,098 892,479 2005 153,900 948,130 2006 169,329 1,115,963 2007 157,545 1,029,935 2008 170,583 1,165,293 2009 150,989 1,007,481
Source: Indonesian Fisheries Book, 2011.
Thailand fishery production has increased dramatically and its per capita fishery product has risen from 20 to 40 kilograms (1990-2008). For the rapid growth of fishery production, the ex-vessel price or farm price of fisheries products has been quite stable compared with other food prices. Therefore fishery products have changed from luxury food items to ordinary food items. Thailand’s fisheries exports have increased impressively, while imports have also increased significantly as demands for re-exports have grown. In 2008 fisheries production was 3.2 million tons worth 4,310 million USD. Production was mainly from marine fishing (51%), coastal aquaculture (25%), freshwater culture (17%) and freshwater fishing (7%). Thailand’s 2008 import of aquatic products, mostly for re-export was 1.62 million tons worth THB 81,129 million (2,700 million USD). Import have increased on average 7.79% a year from 1990-2008. Imported fishery products, have played an important role since 2002, when they reached 1 million tons [11].
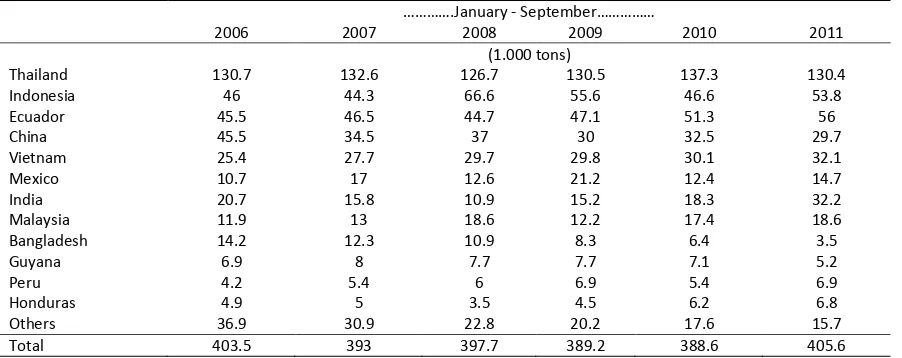
World's major importers of shrimp are: U.S.,
Japan, and the EU and the following
development. First, in the U.S. market going trend of increased consumption. Since 2002, Shrimp consumption per capita reached 2.29 pounds per year in 1987 and increased to 4.40 pounds / year by 2006 so that the shrimp into
Table 2. Import Shrimp: USA
………….January - September………
2006 2007 2008 2009 2010 2011
(1.000 tons)
Thailand 130.7 132.6 126.7 130.5 137.3 130.4
Indonesia 46 44.3 66.6 55.6 46.6 53.8
Ecuador 45.5 46.5 44.7 47.1 51.3 56
China 45.5 34.5 37 30 32.5 29.7
Vietnam 25.4 27.7 29.7 29.8 30.1 32.1
Mexico 10.7 17 12.6 21.2 12.4 14.7
India 20.7 15.8 10.9 15.2 18.3 32.2
Malaysia 11.9 13 18.6 12.2 17.4 18.6
Bangladesh 14.2 12.3 10.9 8.3 6.4 3.5
Guyana 6.9 8 7.7 7.7 7.1 5.2
Peru 4.2 5.4 6 6.9 5.4 6.9
Honduras 4.9 5 3.5 4.5 6.2 6.8
Others 36.9 30.9 22.8 20.2 17.6 15.7
Total 403.5 393 397.7 389.2 388.6 405.6
Source: Globefish, 2012a.
(1) Thailand with a share of 34.71%, (2) China 18.95%, (3) Vietnam 10.45%, (4) Denmark 6.67 %,
(5) Netherlands 6.22%. Indonesia is ranked 6th after the Netherlands (5.44%) in 2010 [10]. Previous research about competitiveness shrimp
have done before and they were use some analysis approach, such as Porter model, PAM model, RCA index, etc. Each models have lack and excess. The development of the concept of competitiveness is inseparable from trade theory since Adam Smith until the theory evolve now. However, because of the competitiveness has wide coverage, none of the models can explain full about competitiveness.
ANALYTICAL METHOD
About economic globalization and trade liberalization, the future competitive advantage possessed by only commodity that has a comparative advantage. The concept of revealed comparative advantage (Balassa 1965, 1977, 1979, 1986) pertains to the relative trade performance of individual countries in particular commodities. On the assumption that the commodity pattern of trade reflects the inter - country differences in relative costs as well as in non-price factors, this is assumed to reveal the comparative advantage of the trading countries. The factors that contribute to movements in RCA are economic: structural change, improved world demand and trade specialization. The index of revealed comparative advantage (RCAij) has a relatively simple interpretation. If it takes a value greater than unity, the country has a revealed comparative advantage in that product. The advantage of using the comparative advantage index is that it considers the intrinsic advantage of a particular export commodity and is consistent with changes in an economy’s relative
factor endowment and productivity. The
disadvantage, however, is that it cannot distinguish improvements in factor endowments and pursuit of appropriate trade policies by a country [2]. Comparative advantage underlies economists’ explanations for the observed pattern of inter-industry trade. In theoretical models, comparative advantage is expressed in terms of relative prices evaluated in the absence of trade. Since these are not observed, in practice we measure comparative advantage indirectly. Revealed comparative advantage indices (RCA) use the trade pattern to identify the sectors in which an economy has a comparative advantage, by comparing the country of interests’ trade profile with the world average. The RCA index is defined as the ratio of two shares. The numerator is the share of a country’s total exports of the commodity of interest in its total exports. The denominator is share of world exports of the same commodity in total world exports.
The concept of competitiveness was originally not an economic concept, but the concepts of
politics and business to improve the
competitiveness of the company's performance discussion can’t be separated from the two terms are the comparative and competitive advantages. Comparative advantages of each country will determine what happens in the event of trade between them. One method for analyzing comparative advantage is Revealed Comparative Advantage (RCA). The concept of RCA is the ratio between the market share of a product of a
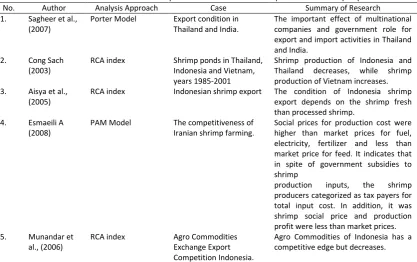
Table 3. Some references of previous research about competitiveness shrimp export
No. Author Analysis Approach Case Summary of Research 1. Sagheer et al.,
(2007)
Porter Model Export condition in Thailand and India.
The important effect of multinational companies and government role for export and import activities in Thailand and India.
2. Cong Sach (2003)
RCA index Shrimp ponds in Thailand, Indonesia and Vietnam, years 1985-2001
Shrimp production of Indonesia and Thailand decreases, while shrimp production of Vietnam increases. 3. Aisya et al.,
(2005)
RCA index Indonesian shrimp export The condition of Indonesia shrimp export depends on the shrimp fresh than processed shrimp.
4. Esmaeili A (2008)
PAM Model The competitiveness of Iranian shrimp farming.
Social prices for production cost were higher than market prices for fuel, electricity, fertilizer and less than market price for feed. It indicates that in spite of government subsidies to shrimp
production inputs, the shrimp producers categorized as tax payers for total input cost. In addition, it was shrimp social price and production profit were less than market prices. 5. Munandar et
al., (2006)
RCA index Agro Commodities Exchange Export means higher specialization. The formula used is:
𝑅𝐶𝐴= consistent with the pattern of comparative advantage.
In this research, the indicator used is the RCA index. Indonesia shrimp commodity has a comparative advantage in the power market liberalization, can create jobs and increase incomes. Thailand country selected as a competitor because exporters have high quality and high productivity of shrimp production. Competitiveness analyze in this research used secondary data about total export fresh shrimp, frozen shrimp and processed shrimp from
country i = I (Indonesia), T (Thailand), to market j = A (US), J (Japan) in year t (thousands of tons), real price of fresh shrimp, frozen shrimp and processed shrimp from country i = I (Indonesia), T (Thailand), to market j = A (US), J (Japan) in year t (thousands of USD / Kg), total value export of all products from country i = I (Indonesia), T (Thailand), to market j = A (USA), J (Japan) in year t (million USD) in periode year 1989-2010. The data sources from UNComtrade, Indonesian Fisherman Book and Statistics Indonesia. The research [16] showed that Thailand is a major
competitor Indonesia. Competition major
exporters will continue amongst the Asian countries generally benefit from its geographical advantages. On the other hand, in this research choose two country as a major importers are still dominated by the U.S., and Japan, competition causes each country has a specific marketing strategy. Between Indonesia and Thailand occurred competitiveness in exporting shrimp to the U.S., and Japan. Data in this paper based from UNComtrade draws on data from a product with the code:
• 030623:Shrimps and prawns, not frozen, in shell or not, including boiled in shell (fresh shrimp).
• 030613:Shrimps and prawns, frozen, in shell or not, including boiled in shell (frozen shrimp). • 160520:Shrimps and prawns, prepared or
Competitiveness of fresh shrimp (RCS). Competitiveness indicator used is the RCA index. RCA index value above one indicates a relative advantage, and if the value is below one indicate condition of disadvantage in exporting these products. As the identity equation, the formula:
Competitiveness of fresh shrimp (RCS).
RCSIJ = ((QXSIJ*PXSIJ)/VXTIJ))/(VXSDJ/VXTDJ) ..(2) RCSIA = ((QXSIA*PXSIA)/(VXTIA)) /
(VXSDA/VXTDA) ……….……….………...(3) RCSTJ=((QXSTJ*PXSTJ)/(VXTTJ))/(VXSDJ/VXTDJ) ...(4) RCSTA = ((QXSTA*PXSTA)/(VXTTA)) /
(VXSDA/VXTDA) ……….…….…………...(5)
Competitiveness of frozen shrimp (RCB). RCBIJ = ((QXBIJ*PXBIJ)/VXTIJ)) / (VXBDJ/VXTDJ)
………...………..(6) RCBIA = ((QXBIA*PXBIA)/(VXTIA)) /
(VXBDA/VXTDA) ……..…….……..…………...(7) RCBTJ = ((QXBTJ*PXBTJ)/(VXTTJ)) /
(VXBDJ/VXTDJ) ……...………...(8) RCBTA = ((QXBTA*PXBTA)/(VXTTA)) /
(VXBDA/VXTDA)………...…………...(9)
Competitiveness of processed shrimp (RCO). RCOIJ = ((QXOIJ*PXOIJ)/VXTIJ)) / (VXODJ/VXTDJ)
……….…..………...……..(10) RCOIA = ((QXOIA*PXOIA)/(VXTIA)) /
(VXODA/VXTDA) ………...…….…….……...(11) RCOTJ = ((QXOTJ*PXOTJ)/(VXTTJ)) /
(VXODJ/VXTDJ)………...……….…..(12) RCOTA = ((QXOTA*PXOTA)/(VXTTA)) /
(VXODA/VXTDA) ...……..…………..…...(13)
Note:
RCSij is Revealed Comparative Advantage fresh shrimp from country i to country j in year.
RCBij is Revealed Comparative Advantage frozen shrimp from country i to country j in year.
RCOij is Revealed Comparative Advantage processed shrimp from country i to country j in year.
QXSij is total exports of fresh shrimp from country i = I (Indonesia), T (Thailand), to market j = A (US), J (Japan) in year t (thousands of tons).
QXBij is total exports of frozen shrimp from country i = I (Indonesia), T (Thailand), to market j = A (US), J (Japan) in year t (thousands of tons).
QXOij is total exports of processed shrimp from country i = I (Indonesia), T (Thailand), to market j = A (US), J (Japan) in year t (thousands of tons).
PXSij is price of fresh shrimp exports from country i = I (Indonesia), T (Thailand), to market j = A (US), J (Japan) in year t (thousands of USD / Kg).
PXBij is price of frozen shrimp exports from country i = I (Indonesia), T (Thailand), to market j = A (US), J (Japan) in year t (thousands of USD / Kg).
PXOij is price of processed shrimp exports from country i= I (Indonesia), T (Thailand), to market j = A (US), J (Japan) in year t (thousands of USD/ Kg).
VXTij is the total value of exports of all products from country i = I (Indonesia), T (Thailand), to market j = A (US), J (Japan) in year t (million USD).
VXSDj is the total value of fresh shrimp from the world to market j = A (US), J (Japan) in year t (million USD).
VXBDj is the total value of frozen shrimp from the world to market j = A (US), J (Japan) in year t (million USD
VXODj is the total value of processed shrimp from the world to market j = A (US), J (Japan) in year t (million USD).
VXTDj is the total value of exports of all products from the world to market j = A (US), J (Japan) in year t (million USD).
RESULTS
The objective of this research is analyze the competitiveness of Indonesia shrimp export compare with Thailand in liberalized market (in exporting shrimp two major markets (Japan and US)) and will be conducted using RCA index as follows. RCA calculation results for Indonesia and Thailand in exporting three kinds shrimp products (fresh, frozen and processed) to two markets (Japan and US) are presented in Table 4.
Based on Table 4, period year 1989-2010 Indonesia and Thailand has a comparative advantage in exporting shrimp to the two major markets (i.e Japan and U.S. with three kinds of shrimp production, ie fresh shrimp, frozen shrimp and processed shrimp), each of which has a value of more than one (above one) and no RCA value of less than one. This means that the two countries (Indonesia and Thailand) able to compete in the liberalized market. When viewed from the RCA value there are fluctuation. RCA values of Indonesia were higher than 1, which
indicates advantaged competitiveness of
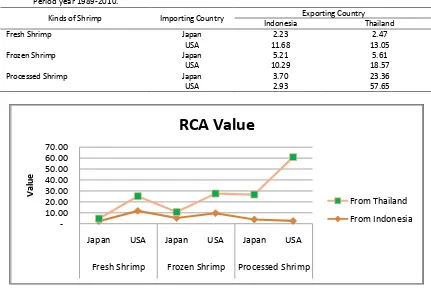
Table 4. Average Value RCA Index of three kind Shrimp Product from Indonesia and Thailandto the two major Markets, Period year 1989-2010.
Kinds of Shrimp Importing Country Exporting Country Indonesia Thailand
Fresh Shrimp Japan 2.23 2.47
USA 11.68 13.05
Frozen Shrimp Japan 5.21 5.61
USA 10.29 18.57
Processed Shrimp Japan 3.70 23.36
USA 2.93 57.65
Figure 1. RCA Value
Nevertheless, compared with Thailand, Indonesia remained relatively disadvantaged. Among the
three types of export shrimp products,
Indonesian fresh and frozen shrimp products had greater competitiveness than processed ones. Based on Table 4, Indonesia has similar RCA value with Thailand in fresh shrimp and frozen shrimp export to Japan, because Indonesia do not has high technology to process the shrimp (Thailand has more the high technology than Indonesia) yet, Indonesia and Thailand have similar RCA value in fresh shrimp because needs more handling than processed shrimp. So that the necessary infrastructure such as networks shipment/delivery, packaging and transportation better.
Most of the RCA value describe Japan export destination is lower than US. This is not an issue for this importer country (Japan) because Japan is a traditional shrimp export markets of Indonesia and Thailand, Japan also has a relatively close geographically compared to US. For Indonesia if it wanted to keep the Japan
market it is necessary to aquaculture
development with better quality.
The RCA value of Indonesia less than Thailand. It was thought to be related to changes the composition of product export which
products majority is vaname, one disadvantage of White shrimp compared to is shrimp harvest size smaller so the price is relatively more low price. Therefore, in order to maintain market share in Japan it is necessary to encourage the
development of shrimp pound (Panaeus
monodon sp) seed setting and holding superior quality. The implication, brood stock centers and research should be encouraged and supported by an adequate budget.
CONCLUSION
RCA value of Indonesia is lower than the RCA value of Thailand, this indicates that there is still competition between the exporters (Indonesia and Thailand). Among the three of export shrimp products, Indonesia has the advantage on fresh and frozen shrimp products. But Thailand has the advantage on processed shrimp product For Indonesia if it wanted to keep the Japan market it is necessary to aquaculture development with better quality.
From this competitiveness analyze the data show that the position shrimp export of Indonesia less than shrimp export of Thailand. So the Indonesian government must observe to fisheries sector such as determine or have some good policy about fisherman, catching, export
-10.00 20.00 30.00 40.00 50.00 60.00 70.00
Japan USA Japan USA Japan USA
Fresh Shrimp Frozen Shrimp Processed Shrimp
Val
u
e
RCA Value
From Thailand
and import shrimp, have high technology, have a good handling for shrimp products, etc. For fisheries sector must have a good strategy to increase Indonesian shrimp export products. This research explains about competitiveness of Indonesian shrimp export compare with Thailand in liberalized market. Further researches to determine the factors affecting competitiveness of export shrimp in liberalized market, make and analyze for the policy strategy formulation of Indonesia shrimp export in liberalized market are also advised.
REFERENCES
[1]. Aisya, L.K., Y.D. Sari, dan S. Koeshendrajana.
2006. Pola Perdagangan Internasional
Ekspor Udang Indonesia. Indonesian Journal of Fisheries Research, 1(1):49-65.
[2]. Batra, A. Zeba, K. 2005. Revealed
Comparative Advantage: an Analysis for India and China. Work Paper No. 168. New Delhi.
[3]. Cong Sach, T. 2003. International Export
Implications of Expanding Shrimp
Aquaculture in Vietnam in Expanding Shrimp Aquaculture on Sandy Land in Vietnam. IUCN-The World Conservation Union and IISD (International Institute for Sustainable Development). Environmental
Economics Programme for Vietnam.
Vietnam.
[4]. Directorate of Agricultural and Forestry Products export. 2009. Unggulan Pertanian
Indonesia untuk Dunia. Marketing
Department of Indonesia. Jakarta.
[5]. Esmaeili, A. 2008. Measuring
Competitiveness of Shrimp Farming in Southern Iran: Using Pam Approach. World Applied Sciences Journal 4 (5): 724-729.
[6]. Food Outlook. 2012. Global Market
Analysis. FAO.
[7]. Globefish. 2012a. Globe Fish, Shrimp Asia. October 2012. Accessed in March 2013. [8]. Globefish. 2012b. The Shrimp Market is on
the Risk Despite the Difficult Global Economics Situation. Market Reports of Shrimp. December 2011.
[9]. Indonesian Fisheries Book. 2011. Indonesian Fisheries Book. Ministry of Marine Affairs and Fisheries Republic of Indonesia. Jakarta. [10].ITPC Osaka. 2012. Market Brief: HS 160520.
Osaka.
[11].Lawapong, A. 2010. A Value Chain Analysis of International Fish Trade and Food Security with an Impact Assessment of the
Small Scale Sector. Department of Fisheries Thailand. Thailand.
[12].Ministry of Marine Affairs and Fisheries Republic of Indonesia. 2012. Pembangunan Kelautan dan Perikanan Indonesia Tahun 2011. Ministry of Marine Affairs and Fisheries Republic of Indonesia. Jakarta.
[13].Munandar, J.M., Y. Arkema, H.
Hardjomidjojo, T. Djatna, J. Purwono, dan M. Aminah. 2006. Analisis dan Identifikasi
Faktor untuk Pengembangan Tingkat
Kompetisi Ekspor Komoditas Agroindustri Indonesia. Competitive Research Grant Final Report XII.. Institute for Research and Community Empowerment (LPPM), Institut Pertanian Bogor.
[14].Ngamsaithong, N. 2012. Thai Shrimp
Exports to 6 Main Market to be Expanded. The Thai Financial Post Publish on July 6th,
2012. Accessed in December 2012.
Thailand.
[15].Sagheer, S., S.S. Yadap, and S.G. Deskmuh. 2007. Assessing International Success and
National Competitive Environment of
Shrimp Industries of India and Thailand with Porter’s Diamond Model and Flexibility Theory. Global Journal of Flexible Sistem Management, 8(1&2): 31-43.
[16].Soepanto. 2011. Model Ekonometrika
Perikanan Indonesia: Analisis Kebijakan pada Era Liberalisasi Perdagangan. IPB. Bogor.