Contents lists available atScienceDirect
Forest Ecology and Management
j o u r n a l h o m e p a g e :w w w . e l s e v i e r . c o m / l o c a t e / f o r e c o
The impact of black cottonwood on soil fertility in coastal western hemlock forest
J. Sabau
a, M.G. Schmidt
a,∗, M. Krzic
baFaculty of Environment, Simon Fraser University, Burnaby, British Columbia, Canada V5A 1S6 bFaculty of Forestry, University of British Columbia, Vancouver, British Columbia, Canada V6T 1Z4
a r t i c l e
i n f o
Article history:
Received 1 May 2010
Received in revised form 13 July 2010 Accepted 13 July 2010
Keywords: Populus trichocarpa
Nutrient cycling Litterfall Decomposition Forest floor Mineral soil Forest soils
a b s t r a c t
Black cottonwood (Populus trichocarpaTorr. and Gray) is a deciduous tree species that extends from Alaska through coastal regions of western Canada into the northwestern United States and as far south as Baja California. We examined the influence of black cottonwood on soil fertility within a forest dominated by Douglas-fir [Pseudotsuga menziessi(Mirb.) Franco], western hemlock [Tsuga heterophylla(Raf.) Sarg], and western red cedar (Thuja plicataDonn ex. D. Don.). Six circular 0.008 ha plots with a single cottonwood tree in the center of conifers were paired with six conifer plots (of the same size) without cottonwood. Litterfall, litter decomposition, properties of forest floor and mineral soil, and N mineralization were compared between plot types. Cottonwood litter had higher concentrations of almost all elements relative to conifer litter. Mass loss did not differ between cottonwood and fir/hemlock litter on cottonwood sites. Twice the amount of mull-like humus form (vermimull and mullmoder, 56%) was found in cottonwood plots compared to 28% in conifer plots. Higher pH (4.4) was found in the forest floor under cottonwood compared to conifer (3.9). Total N concentration (3.33 g/kg) and base saturation (68%) were higher in the mineral soil under cottonwood compared to conifers (2.98 g/kg total N and 50% base saturation). Net ammonification and net mineralization were both lower under cottonwood. These results suggest a variable effect of cottonwood on soil fertility within coastal western hemlock forests with some soil variables changed in a favourable direction and some in an unfavourable direction.
© 2010 Elsevier B.V. All rights reserved.
1. Introduction
Forest managers in the Pacific Northwest traditionally view many deciduous trees as weeds that compete with conifers for resources. However, the presence of deciduous species in conifer stands can improve biodiversity, which in turn increases the capac-ity of ecosystems to renew and reorganize after disturbance. Biodiversity can therefore be seen as a kind of insurance policy against the loss of ecosystem functionality (Folke et al., 2004). In addition, soil fertility has been found to be higher under some broad-leaved species compared to conifers.
In the Pacific Northwest, deciduous species such as red alder (Alnus rubra Bong), vine maple (Acer circinatum Pursh), bigleaf maple (Acer macrophyllum Pursh), and black cottonwood ( Pop-ulus balsamiferaL.) grow within forests dominated by conifers. Red alder, a N-fixing tree species, has been observed to increase N (Tarrant et al., 1969), and organic matter content (Bormann and DeBell, 1981), as well as acidity in the mineral soil (Van Miegroet and Cole, 1984). Vine maple growing in the understory
∗ Corresponding author at: Faculty of Environment, Department of Geography,
Simon Fraser University, 8888 University Drive, Burnaby, British Columbia, Canada V5A 1S6. Tel.: +1 778 782 3323.
E-mail addresses:margaret schmidt@sfu.ca,caschmidtc@sfu.ca(M.G. Schmidt).
of Douglas-fir [P. menziessi(Mirb.) Franco] and western hemlock [T. heterophylla(Raf.) Sarg.] has been found to increase mineraliz-able N and total exchangemineraliz-able bases in the mineral soil (Tashe and Schmidt, 2001). Bigleaf maple sites have been observed to have higher pH and mineralizable N contents in the forest floor as well as higher concentrations of total N and exchangeable K, Ca, and Mg in the mineral soil (Turk et al., 2008) compared to adjacent conifer sites free from the influence of deciduous species.
Black cottonwood is regarded as the Pacific coastal race of balsam poplar (BC Ministry of Forests, 1996). It grows in Alaska through coastal regions of western Canada and the northwestern United States and as far south as Baja California (Fig. 1). Cotton-wood grows in climates ranging from relatively arid to humid, but achieves its best development in areas of humid climate (Haeussler et al., 1990). This species is highly shade intolerant and poorly adapted to both drought and waterlogging (BC Ministry of Forests, 1991). Cottonwood often grows within stands populated by conifers including Douglas-fir, western hemlock, and western red cedar, (T. plicataDonn ex. D. Don.) as well as other deciduous trees including bigleaf maple, vine maple, and red alder (Haeussler et al., 1990). Cottonwood can be a strong competitor for light within mixed stands due to its rapid height growth and early dominance. Information regarding the impact of cottonwood on soils is extremely limited. No studies were found that address the impact of cottonwood on soil fertility, however, other species within
J. Sabau et al. / Forest Ecology and Management 260 (2010) 1350–1358
Fig. 1.Geographic distribution of cottonwood in North America (modified fromUSDA Forest Services, 2004).
the genusPopulushave been shown to enrich conifer forests, as was reported byWeih (2004)in a study of boreal regions. In an effort to fill a knowledge gap associated with this species, our study examined the impact of cottonwood on soil fertility in a Douglas-fir/western hemlock dominated forest. Conifer plots with a cottonwood component were compared to pure conifer plots using a paired plot design. The goal of the study was to determine the influence of cottonwood on: (1) litterfall, (2) litter decomposi-tion, (3) forest floor properties, (4) mineral soil properties, and (5) N mineralization.
2. Methodology
2.1. Study area and sampling design
This study was undertaken at the Malcolm Knapp Research For-est (MKRF), located in Haney, east of Vancouver, British Columbia
Fig. 2.Location of Malcolm Knapp Research Forest in southwest British Columbia.
as Gleyed Dystric Brunisol formed on morainal deposits (Tashe and Schmidt, 2001).
Six pairs of circular 0.008 ha plots were located within conifer-dominated stands of the MKRF. Five of the research sites were located within the dry maritime (dm) subzone of the CWH, while one site was within the very wet subzone of the CWH. Snow per-sists for about 4 months on one of the six pairs used in this study, but does not generally occur on the other five sites. Each pair of plots contained one plot centred on a dominant cottonwood bole and one plot centred on a dominant conifer. Cottonwood plots had one cottonwood individual surrounded by conifers. Douglas-fir trees were chosen for the centre of pure conifer plots when-ever possible, howwhen-ever, one plot was centred around a western hemlock because an appropriate Douglas-fir tree could not be located.
Each pair of plots displayed similar site characteristics, includ-ing: slope, aspect, elevation, and age of stand. The soil moisture regime (SMR) did not differ by more than one unit and the soil textural class was adjacent on the textural triangle for each pair of plots. The SMR in the study area ranged from 2 to 6. The mean diameter for the central cottonwood stems was 53 cm with a range of 41–72 cm, while the mean diam-eter for central conifer stems was 58 cm with a range of 47–86 cm. One hundred percent of the basal area in conifer plots was from conifers, whereas the mean cottonwood basal area was 45% in cottonwood plots. The cottonwood plots were thus mixed conifer/deciduous plots rather than pure deciduous plots.
All plots had a radius of 5 m and were located at least 15 m away from trails or roads. Selected cottonwood trees were at least 15 m away from the boles of other deciduous trees, and pure conifer plots were at least 15 m away from all deciduous influence. Plots within the same pair were located a minimum of 30 m and a maximum of 60 m away from each other. This placement allowed pairs to be close enough to ensure similar site characteristics yet far enough to remove as much effect of cottonwood on the conifer plots as possible. Comparisons were made between plots within the same pair.
2.2. Litterfall sampling and analysis
Litterfall was collected in each plot for one year (August 2007 to August 2008). Five plastic trays (0.125 m2, lined with nylon mesh,
and with 1 mm2pores) were randomly placed on the forest floor
of each plot for a total of 60 trays. Litterfall was collected weekly in the autumn and monthly for the rest of the year. All litter col-lected from any one plot (5 trays per plot) was composited and then oven-dried at 70◦C for 24 h. Samples were sorted into: cottonwood leaves, fir/hemlock needles, western red cedar leaves, and “other” debris (small twigs, cone scales, and any other litter). Twigs that were larger than 2 mm in diameter were removed from samples (Maguire, 1994). Seasonal litter input was then determined.
Litterfall samples from the autumn for cottonwood, fir/hemlock, western red cedar, and “other” debris were analysed for P, K, Ca, Mg, S, Mn, B, Zn, Fe, Cu, and Al by an inductively coupled plasma-atomic emission spectrometer (ICP), following the closed vessel microwave digestion method (Kalra and Maynard, 1991). For anal-ysis of total C and N, tissue samples were ground with a Wiley mill (produced by Thomas Scientific) and run through a Fisons NA-1500 Elemental Analyser. Lignin analysis followed the acid detergent method byGoering and Van Soest (1970)as modified byRyan et al. (1990).
Cottonwood litter was placed in 12 cm×15 cm mesh bags
while fir/hemlock needles were placed in 6 cm×12 cm mesh bags.
Decomposition bags were made of 2-ply nylon mesh with 1 mm2
holes. All bags were filled with the equivalent of 2 g dry weight of litter. On December 5 and 6 of 2007, three bags each of two litter types (cottonwood and fir/hemlock) were randomly pinned to the forest floor in each of the 12 plots. All decomposition bags (72) were collected from each plot 18 months later. Litter was oven-dried at 70◦C for 24 h, weighed, and mass loss was determined.
2.3. Forest floor sampling and analysis
J. Sabau et al. / Forest Ecology and Management 260 (2010) 1350–1358
classify humus form to the group level according toGreen et al. (1993).
Three randomly selected forest floor samples were collected within each plot for further analysis. The moist forest floor sam-ples were weighed before they were oven-dried at 70◦C for 24 h to determine dry weight of the forest floor (Kalra and Maynard, 1991). Water content and bulk density of each sample were cal-culated. A subsample of equal weight was removed from each oven-dried sample. Composite samples from each plot were sent to the BC Ministry of Forests and Range Laboratory for determina-tion of the following properties: pH, total N, C, and S, mineralizable N, exchangeable cations, available P, cation exchange capacity (CEC), NH4-N and NO3-N. The pH was measured with a
combina-tion electrode and data acquisicombina-tion system in a 1:1 forest floor to water solution (Kalra and Maynard, 1991). Total C, N, and S were determined by a dry combustion method using a Fisons NA-1500 Elemental Analyser.
Mineralizable N was measured using an anaerobic incuba-tion method where soil samples were incubated under anaerobic conditions for 2 weeks at 30◦C, and N was determined colori-metrically by a Technicon Auto-analyzer II (Waring and Bremner, 1964a,b; Bremner, 1965). Mineralizable N was measured in a 1 M KCl extract and NH4-N and NO3-N were measured in a 2 M KCl
extract. Exchangeable cations were measured using an ARL 3560 inductively coupled argon plasma (ICAP) spectrometer. The sum of cations reported by this method was used to determine effec-tive CEC (Carter, 1993). Available phosphate was extracted using the Bray P1 method (Kalra and Maynard, 1991; John, 1970), while NH4-N and NO3-N were measured colorimetrically using an
Alp-kem Flow System IV analyzer (Carter, 1993).
The buried bag technique (Prescott et al., 2003; Prescott, 1992) was used to quantify differences in N mineralization rates between cottonwood and conifer plots. Bags were left to incubate at three random locations per plot for 40 days, from July 18 to August 27, 2007. The samples removed from each plot were compos-ited and delivered, within 48 h, to Pacific Soils Analysis Laboratory in Richmond, BC for chemical analysis. Samples were analysed for NH4-N and NO3-N concentrations before and after incubation.
Available NH4-N and NO3-N were determined using 0.5 M K2SO4
extract. NH4-N was determined colorimetrically on a Technicon
Autoanalyser, and NO3-N was determined by the chromotropic acid
colour development method, and measured on a Turner colorime-ter (Carcolorime-ter, 1993).
2.4. Mineral soil sampling and analysis
Mineral soil sampling took place during July and August 2007. Three randomly selected mineral soil samples were collected per plot using a bulk density corer with a volume of 490.3 cm3. Bulk
density cores were taken directly beneath forest floor sample loca-tions. The moist weight of all soil core samples was determined, samples were oven-dried at 105◦C for 48 h, and weighed again
Table 1
Seasonal litterfall (kg ha−1) in cottonwood and conifer plots (n= 6).
Season Cottonwood plots Conifer plots P Power
Autumn 3071 (1282) 2666 (921) 0.15 0.15
Winter 780 (410) 635 (237) 0.47 0.17
Spring 548 (296) 527 (384) 0.80 0.06
Summer 623 (223) 786 (204) 0.22 0.34
Annual total 5025 (1212) 4614 (840) 0.22 0.16
Values in parentheses represent standard deviations.
(Kalra and Maynard, 1991). Percentage of coarse fragment (diame-ter > 2 mm), gravimetric soil wa(diame-ter content, and bulk density were determined for each sample.
Equal portions of the remainder of the samples were thoroughly mixed on a per plot basis and sent to the BC Ministry of Forests and Range Laboratory. Analyses were completed using the same methodology used for forest floor samples and included tests for: pH, total N, C and S, mineralizable N, exchangeable cations, avail-able P, CEC, NH4-N and NO3-N.
2.5. Statistical analysis
Differences in properties between plot types were deter-mined using SPSS 16.0 statistical software (SPSS Inc., 2006). All data were analysed for normality using the One-Sample Kolmogorov–Smirnov test. Data not appearing normal were log transformed to achieve normality. Data were analysed using paired
t-tests, except in the case of autumn litterfall data, which were analysed using a one-way analysis of variance (ANOVA), and humus form data which were analysed using a Kruskal–Wallis test. When significant differences were found between litter types, data were further analysed with the Tukey/Tamhane mul-tiple comparison test. A significance level of 0.1 was used due to considerable natural heterogeneity within measured properties.
The probability of committing a Type II (ˇ) error was calculated when paired t-tests yielded non-statistically significant results (a Type II error results in a failure to reject the null hypothesis when the alternative hypothesis is true) (Kleinbaum et al., 1998). Power was determined by using a computer program created by Borenstein and Cohen (1988).
3. Results
3.1. Litterfall and litter decomposition
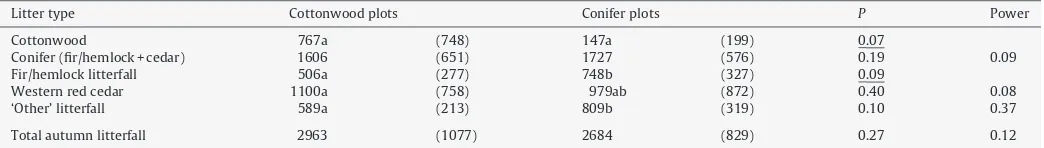
Seasonal litterfall weights were similar for cottonwood and conifer plots (Table 1). More than half of the annual litter fell in the autumn for both plot types. Significantly more cotton-wood litter fell in cottoncotton-wood plots compared with conifer plots, and significantly more fir/hemlock litter fell in conifer plots com-pared to cottonwood plots (Table 2) during the autumn. Within
Table 2
Autumn litterfall (kg ha−1) in cottonwood and conifer plots (n= 6).
Litter type Cottonwood plots Conifer plots P Power
Cottonwood 767a (748) 147a (199) 0.07
Conifer (fir/hemlock + cedar) 1606 (651) 1727 (576) 0.19 0.09
Fir/hemlock litterfall 506a (277) 748b (327) 0.09
Western red cedar 1100a (758) 979ab (872) 0.40 0.08
‘Other’ litterfall 589a (213) 809b (319) 0.10 0.37
Total autumn litterfall 2963 (1077) 2684 (829) 0.27 0.12
Table 3
Concentrations of elements (g g−1) in autumn litter from cottonwood plots (n= 6).
Element Cottonwood litter Fir/hemlock litter Red cedar litter ANOVA,P
C 507,530a (3746) 542,373b (6351) 543,258b (10,963) 0.00
N 14,563a (2093) 9772b (1076) 5693c (768) 0.00
P 643a (61) 492b (80) 362c (85) 0.00
K 4885a (1384) 1532b (552) 1115b (243) 0.00
Ca 19,215a (1732) 9995b (1832) 16,523a (2545) 0.00
Mg 1993a (351) 785b (85) 603b (124) 0.00
S 1385a (229) 837b (66) 543c (38) 0.00
Mn 122a (57) 300b (207) 109a (34) 0.01a
B 38a (6) 15b (4) 12b (2) 0.00
Zn 339a (112) 42b (16) 19c (7) 0.00
Fe 141 (25) 169 (68) 119 (21) 0.17
Cu 10a (1) 8a (3) 4b (1) 0.00
Al 125 (22) 125 (22) 264 (349) 0.41
Single and double underlined values indicate significant differences atP< 0.1 andP< 0.05, respectively. Values in parentheses represent standard deviations. Different letters in the same rows indicate significant differences atP< 0.05.
aData were log transformed to meet underlying statistical assumptions.
Table 4
Element contents (kg ha−1) of autumn litter (composite of all litter types) in cottonwood and conifer plots (n= 6).
Element Cottonwood plots Conifer plots P Power
C 1578 (569) 1437 (432) 0.28 0.12
N 28.02 (9.97) 23.34 (6.47) 0.10 0.23
P 1.57 (0.70) 1.30 (0.54) 0.25 0.17
K 6.74 (3.93) 4.77 (2.83) 0.08
Ca 44.14 (22.54) 33.59 (14.77) 0.13 0.23
Mg 3.12 (1.59) 2.29 (1.04) 0.07
S 2.49 (0.91) 2.02 (0.49) 0.11 0.27
Mn 0.45 (0.21) 0.56 (0.13) 0.24 0.27
B 0.05 (0.03) 0.04 (0.01) 0.04
Zn 0.38 (0.37) 0.14 (0.06) 0.13 0.43
Fe 0.70 (0.31) 0.97 (0.84) 0.30 0.17
Cu 0.022 (0.007) 0.018 (0.005) 0.03
Al 0.79 (0.35) 1.15 (1.02) 0.31 0.19
Values in parentheses represent standard deviations. Single and double underlined values indicate significant differences atP< 0.1 andP< 0.05, respectively.
cottonwood plots, there was significantly more conifer litter (fir/hemlock + cedar) than cottonwood litter (P= 0.096).
Cottonwood litter that fell in autumn had significantly higher concentrations of N, P, K, Ca, Mg, S, B, and Zn, and lower concentra-tions of Mn than fir/hemlock litter (Table 3). Cottonwood plots had higher contents of K, Mg, B, and Cu in autumn litterfall (composite of all litter types) than conifer plots (Table 4). There were no
signifi-cant differences in nutrient concentrations within fir/hemlock litter between cottonwood and conifer plots. No differences were found in lignin concentration or the lignin:N ratio between cottonwood and fir/hemlock litter (Table 5).
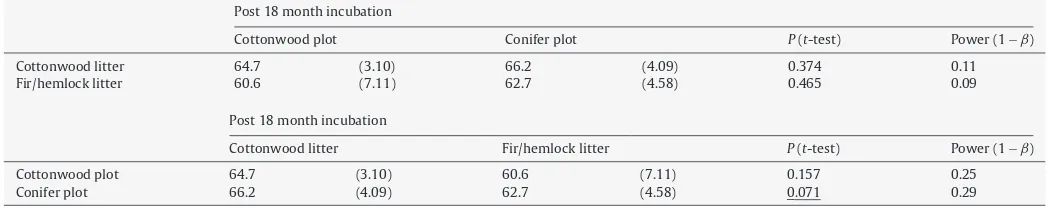
After 18 months of decomposition, mass loss did not differ between cottonwood and fir/hemlock litter within cottonwood plots, however, mass loss was lower for cottonwood litter when
Table 5
Properties of cottonwood and fir/hemlock litter (n= 4).
Property Concentrations (g g−1)
Cottonwood litter fir/hemlock litter P Power
Fibre (total) 664,912 (102,715) 574,955 (47,523) 0.13 0.41
Cellulose 320,432 (17,317) 307,089 (21,107) 0.43 0.22
Lignin 338,274 (91,506) 260,898 (50,242) 0.11 0.37
Lignin:N ratio 24 (6.30) 25 (4.73) 0.87 0.07
Values in parentheses represent standard deviations.
Table 6
Percentage of original litter remaining after 18 months decomposition period (n= 6).
Post 18 month incubation
Cottonwood plot Conifer plot P(t-test) Power (1−ˇ)
Cottonwood litter 64.7 (3.10) 66.2 (4.09) 0.374 0.11
Fir/hemlock litter 60.6 (7.11) 62.7 (4.58) 0.465 0.09
Post 18 month incubation
Cottonwood litter Fir/hemlock litter P(t-test) Power (1−ˇ)
Cottonwood plot 64.7 (3.10) 60.6 (7.11) 0.157 0.25
Conifer plot 66.2 (4.09) 62.7 (4.58) 0.071 0.29
J. Sabau et al. / Forest Ecology and Management 260 (2010) 1350–1358
Fig. 3. Mean thickness of forest floor horizons and Ah horizons for cottonwood and conifer plots (n= 6). None of the horizon depths are significantly different between plot types.
compared to fir/hemlock litter within conifer plots (Table 6). Mass loss did not differ for cottonwood litter decomposing in cotton-wood plots when compared to conifer plots, or for fir/hemlock litter decomposing in cottonwood as compared to conifer plots.
3.2. Forest floor, mineral soil and N mineralization
None of the forest floor or upper mineral horizon depths were significantly different between plot types (Fig. 3). The same six humus forms were identified in both cottonwood and conifer plots: humimor, mormoder, vermimull, leptomoder, and mullmoder (Fig. 4). However, forest floors within cottonwood plots were found to have double the amount of mull-like (vermimull and mullmoder,
P= 0.05) humus forms and a lesser (but not significantly different) proportion (38% vs. 55%) of mor-like (mormoder and humimor) humus forms compared to conifer plots.
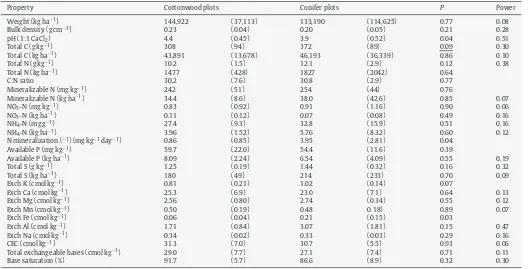
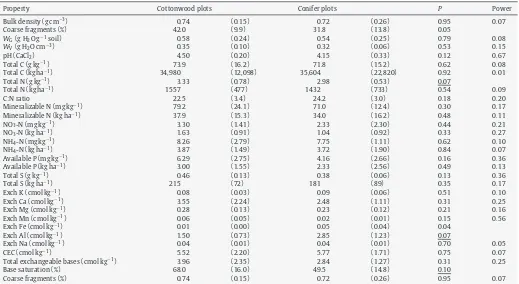
Forest floors of cottonwood plots had a higher pH and lower concentrations of exchangeable K and Fe (Table 7) when compared to conifer plots. Mineral soil within cottonwood plots had a higher total N concentration and base saturation and lower concentra-tions of exchangeable Fe and Al than mineral soil of conifer plots (Table 8).
Fig. 4.Frequency of humus forms within (A) cottonwood and (B) conifer plots (n= 6).
Table 7
Properties of the forest floor in cottonwood and conifer plots (n= 6).
Property Cottonwood plots Conifer plots P Power
Weight (kg ha−1) 144,922 (37,113) 133,190 (114,625) 0.77 0.08
Bulk density (g cm−3) 0.23 (0.04) 0.20 (0.05) 0.21 0.28
pH (1:1 CaCl2) 4.4 (0.45) 3.9 (0.52) 0.04 0.51
Total C (g kg−1) 308 (94) 372 (89) 0.09 0.30
Total C (kg ha−1) 43,891 (13,678) 46,193 (36,339) 0.86 0.10
Total N (g kg−1) 10.2 (1.5) 12.1 (2.9) 0.12 0.38
Total N (kg ha−1) 1477 (428) 1827 (2042) 0.64
C:N ratio 30.2 (7.6) 30.8 (2.9) 0.77
Mineralizable N (mg kg−1) 242 (51) 254 (44) 0.76
Mineralizable N (kg ha−1) 34.4 (8.6) 38.0 (42.6) 0.85 0.07
NO3-N (mg kg−1) 0.83 (0.92) 0.91 (1.16) 0.90 0.06
NO3-N (kg ha−1) 0.11 (0.12) 0.07 (0.08) 0.49 0.16
NH4-N (mg g−1) 27.4 (9.3) 32.8 (15.9) 0.51 0.16
NH4-N (kg ha−1) 3.96 (1.52) 5.76 (8.32) 0.60 0.12
N mineralization (−1) (mg kg−1day−1) 0.86 (0.85) 3.95 (2.81) 0.04
Available P (mg kg−1) 59.7 (22.0) 54.4 (11.6) 0.39
Available P (kg ha−1) 8.09 (2.24) 6.54 (4.09) 0.55 0.19
Total S (g kg−1) 1.25 (0.19) 1.44 (0.32) 0.16 0.32
Total S (kg ha−1) 180 (49) 214 (233) 0.70 0.09
Exch K (cmol kg−1) 0.81 (0.21) 1.02 (0.14) 0.07
Exch Ca (cmol kg−1) 25.3 (6.9) 23.0 (7.1) 0.64 0.13
Exch Mg (cmol kg−1) 2.56 (0.80) 2.74 (0.34) 0.55 0.12
Exch Mn (cmol kg−1) 0.50 (0.19) 0.48 0.18) 0.89 0.07
Exch Fe (cmol kg−1) 0.06 (0.04) 0.21 (0.15) 0.03
Exch Al (cmol kg−1) 1.71 (0.84) 3.07 (1.81) 0.15 0.47
Exch Na (cmol kg−1) 0.34 (0.02) 0.33 (0.03) 0.29 0.16
CEC (cmol kg−1) 31.3 (7.0) 30.7 (5.5) 0.93 0.06
Total exchangeable bases (cmol kg−1) 29.0 (7.7) 27.1 (7.4) 0.71 0.11
Base saturation (%) 91.7 (5.7) 86.6 (8.9) 0.32 0.30
Table 8
Properties of mineral soil in cottonwood and conifer plots (n= 6).
Property Cottonwood plots Conifer plots P Power
Bulk density (g cm−3) 0.74 (0.15) 0.72 (0.26) 0.95 0.07
Coarse fragments (%) 42.0 (9.9) 31.8 (13.8) 0.05
WG(g H2O g−1soil) 0.58 (0.24) 0.54 (0.25) 0.79 0.08
WV(g H2O cm−3) 0.35 (0.10) 0.32 (0.06) 0.53 0.15
pH (CaCl2) 4.50 (0.20) 4.15 (0.33) 0.12 0.67
Total C (g kg−1) 73.9 (16.2) 71.8 (15.2) 0.62 0.08
Total C (kg ha−1) 34,980 (12,098) 35,604 (22,820) 0.92 0.01
Total N (g kg−1) 3.33 (0.78) 2.98 (0.53) 0.07
Total N (kg ha−1) 1557 (477) 1432 (733) 0.54 0.09
C:N ratio 22.5 (3.4) 24.2 (3.0) 0.18 0.20
Mineralizable N (mg kg−1) 79.2 (24.1) 71.0 (12.4) 0.30 0.17
Mineralizable N (kg ha−1) 37.9 (15.3) 34.0 (16.2) 0.48 0.11
NO3-N (mg kg−1) 3.30 (1.41) 2.33 (2.30) 0.44 0.21
NO3-N (kg ha−1) 1.63 (0.91) 1.04 (0.92) 0.33 0.27
NH4-N (mg kg−1) 8.26 (2.79) 7.75 (1.11) 0.62 0.10
NH4-N (kg ha−1) 3.87 (1.49) 3.72 (1.90) 0.84 0.07
Available P (mg kg−1) 6.29 (2.75) 4.16 (2.66) 0.16 0.36
Available P (kg ha−1) 3.00 (1.55) 2.33 (2.56) 0.49 0.13
Total S (g kg−1) 0.46 (0.13) 0.38 (0.06) 0.13 0.36
Total S (kg ha−1) 215 (72) 181 (89) 0.35 0.17
Exch K (cmol kg−1) 0.08 (0.03) 0.09 (0.06) 0.51 0.10
Exch Ca (cmol kg−1) 3.55 (2.24) 2.48 (1.11) 0.31 0.25
Exch Mg (cmol kg−1) 0.28 (0.13) 0.23 (0.12) 0.21 0.16
Exch Mn (cmol kg−1) 0.06 (0.05) 0.02 (0.01) 0.15 0.56
Exch Fe (cmol kg−1) 0.01 (0.00) 0.05 (0.04) 0.04
Exch Al (cmol kg−1) 1.50 (0.73) 2.85 (1.23) 0.07
Exch Na (cmol kg−1) 0.04 (0.01) 0.04 (0.01) 0.70 0.05
CEC (cmol kg−1) 5.52 (2.20) 5.77 (1.71) 0.75 0.07
Total exchangeable bases (cmol kg−1) 3.96 (2.35) 2.84 (1.27) 0.31 0.25
Base saturation (%) 68.0 (16.0) 49.5 (14.8) 0.10
Coarse fragments (%) 0.74 (0.15) 0.72 (0.26) 0.95 0.07
Values in parentheses represent standard deviations. Single and double underlined values indicate significant differences atP< 0.1 andP< 0.05, respectively.
After incubation, cottonwood plots had significantly lower NH4 -N concentrations (P= 0.03) and significantly higher NO3-N (P= 0.01) concentrations compared to conifer plots. Net ammonification and net mineralization were significantly higher in conifer plots (Table 7).
4. Discussion
4.1. Litter decomposition
The presence of cottonwood did not appear to influence decom-position processes or soil C accumulation. Evidence for this lack of influence includes: no difference in decomposition rates between cottonwood and fir/hemlock litter on cottonwood plots; no differ-ence in forest floor and Ah depths as well as weight per unit area of forest floor between cottonwood and conifer plots; and similar concentrations of C in the surface mineral soil on both plot types. These findings suggest similar long-term litter decomposition rates and similar mixing of decomposing organic matter into the mineral soil.
A contributing factor to the similarity in decomposition rates between cottonwood and fir/hemlock litter was most likely due to the similar chemical quality of the litter. We found no signifi-cant differences in the lignin concentrations or the lignin:N ratio between cottonwood and fir/hemlock litter. This lack of difference was unexpected since these properties generally tend to be lower for litter of deciduous trees compared to that of conifers (Pandey and Singh, 1982; Prescott and Blevins, 2000; Fisher et al., 2000) and the lignin:N ratio has been negatively correlated with decomposi-tion rates (Prescott et al., 2004).
We found a greater proportion of mull-like humus forms beneath cottonwood than beneath conifers, which may indicate different biological activity between the plot types.
Biologi-cal activity may be greater in cottonwood plots compared to conifer plots, as mulls are considered to be the most bio-logically dynamic humus form (Green et al., 1993). However, measurements of decomposition rates, forest floor depths and weights, and mineral soil C contents, all suggest a similar level of biological activity for cottonwood and conifer sites as dis-cussed previously. These results may thus indicate that mull-like humus form is not necessarily an indicator of enhanced biological activity.
We found an indication of possible species-specific decay com-munities in that decomposition rates were higher for fir/hemlock than cottonwood litter on conifer plots. It is possible that the biotic soil community within fir/hemlock sites is better suited to decomposing fir/hemlock litter than cottonwood litter, thus accounting for the difference in mass loss. As suggested by Vivanco and Austin (2008), plant species can create conditions within their own habitat that enhance decomposition of their own litter.
J. Sabau et al. / Forest Ecology and Management 260 (2010) 1350–1358
4.2. Nitrogen availability
The influence of cottonwood on N status of a site appears to be varied and possibly negative. The only indication of a poten-tially positive influence of cottonwood on the N status of sites was a higher concentration of total N in the mineral soil beneath cot-tonwood than beneath conifers. Mineralizable N in the forest floor and mineral soil as measured in an anaerobic incubation as well as total N in the forest floor were not significantly different between plot types.
Net N mineralization as measured in field incubation was sub-stantially lower in cottonwood compared to conifer plots. This seems to suggest that cottonwood is reducing N availability. The result of reduced N availability is surprising as we had expected N mineralization to be either similar or higher beneath cotton-wood based on litter chemical quality and forest floor properties. Nitrogen mineralization has been reported to have an inverse rela-tionship with the lignin:N ratio of litter (Pastor et al., 1987; Binkley and Giardina, 1998), a direct relationship with litterfall N (Reich et al., 1997), and an inverse relationship with C:N ratio (Devito et al., 1999). Though our results showed no difference between the lignin:N ratio of cottonwood compared to fir/hemlock litter, and no differences within the C:N ratio of the forest floor, we did find a significantly greater concentration of N in cottonwood litter. Fur-thermore, we measured a greater N flux in litterfall in the autumn beneath cottonwood than conifers. In spite of the apparent better litter quality and greater N flux in litterfall in cottonwood plots, net mineralization was lower under cottonwood. It is possible that other measures of litter quality than those used in this study may reveal that cottonwood litter is of poorer chemical quality than fir/hemlock litter.
Differences in type and activity of soil organisms beneath cot-tonwood and conifers may contribute to the apparent reduced N availability beneath cottonwood. It is possible that in our study the soil biotic community is dominated by decomposers with a greater efficiency for consuming conifer litter, and this may account for the greater N mineralization rates beneath conifers than beneath mixed cottonwood and conifer plots.Washburn and Arthur (2003) found higher rates of N mineralization below oak (Quercus prunus
L.) than below red maple (Acer rubrumL.) in a study in Kentucky, and hypothesized that the results were due to decomposer specificity. They suggested that decomposers with a greater efficiency for con-suming oak litter dominated the soil biotic community below oak trees.
There is mixed evidence (Binkley and Giardina, 1998) in the lit-erature concerning the effect of deciduous versus coniferous trees on rates of N mineralization. A number of studies support the notion that deciduous trees have a positive effect on the rate of N miner-alization (Paré and Bergeron, 1996; Perez et al., 1998; Devito et al., 1999; Côté et al., 2000; Ollinger et al., 2002; Chandler et al., 2008) while others state that this is not always the case (Binkley, 1995; Washburn and Arthur, 2003). No other studies have looked at N mineralization under naturally-occurring cottonwood, how-ever, a few have considered this process under trembling aspen (Populus tremuloidesMichx.), a species within the same genus as cottonwood. Overall, the results of our study are dissimilar to those reported for trembling aspen where higher rates of N mineraliza-tion were found below trembling aspen relative to conifers (Côté et al., 2000; Flannagan and Van Cleve, 1983).
4.3. Soil pH and cations
The pH of the forest floor and the base saturation of the min-eral soil were higher within cottonwood plots compared to conifer plots. Even though this positive effect on soil reaction was evident in the forest floor, it did not extend to the mineral soil. With time, the
pH of the mineral soil underneath the cottonwood plots may also increase, as changes often take longer to occur within mineral soils compared to the forest floors.Turk et al. (2008)also reported signif-icantly higher pH in the forest floor under maples growing within a conifer forest compared to pure conifer stands, but no differences were reported for the pH of the mineral soil.
Though cations were substantially elevated in cottonwood litterfall compared to fir/hemlock litterfall, this effect was consid-erably diluted on a flux basis, and was not apparent in the soil at all. Indeed, the only significant difference in exchangeable bases for forest floor or mineral soil was higher concentrations of K in forest floor of conifer plots. Our results are unlike those of stud-ies of other deciduous specstud-ies that occur in the study area.Turk et al. (2008)found significantly higher concentrations of Ca, Mg, and K in surface mineral soils beneath bigleaf maple.Ogden and Schmidt (1997)reported higher total Ca, Mg, and K concentrations within forest floor of vine maple plots compared to forest floor under conifers. It seems that cottonwood does not have a positive effect on exchangeable cations in soils, whereas bigleaf maple and vine maple do. A relatively high rate of cation uptake by cottonwood compared to bigleaf maple, vine maple, and conifers could account for these results. Bigleaf maple and vine maple are only colonized by endomycorrhizal fungi while cottonwood can be colonized by both ectomycorrhizal and endomycorrhizal fungi (Piotrowski et al., 2008), which may provide an advantage to cottonwood for nutri-ent uptake. It is also possible that root litter plays a more dominant role than leaf litter for cottonwood and that root properties are not appreciably different between cottonwood and conifers, thus accounting for the lack of differences in cation availability in min-eral soils.
5. Conclusion
Cottonwood litter was found to be of higher quality in terms of nutrient concentrations compared to conifer litter within the CWH zone of BC. Despite this apparent higher quality, cotton-wood litter did not decompose faster than fir/hemlock litter. Similar decomposition rates, a lack of measurable difference in forest floor weight below cottonwood compared to conifers, and lower net N mineralization beneath cottonwood suggest that cottonwood may not improve soil fertility. However, other results obtained in the study point to a positive effect of cottonwood on soil fertil-ity within conifer-dominated stands: the proportion of mull-like humus forms under cottonwood was almost double that under conifers, total N concentrations and base saturation were higher in the mineral soil, and pH was higher in the forest floor under cottonwood trees.
This was the first ecological study considering the effect of naturally-occurring cottonwood on soil fertility in forests of the CWH biogeoclimatic zone. Overall, our results suggest a variable effect of cottonwood on soil fertility with some soil variables changed in a favourable direction and some in an unfavourable direction. Many questions regarding the interaction of this tree species with the biotic and abiotic components of its ecosystem remain unanswered and future studies should aim to build further understanding of these components of the soil ecosystem.
Acknowledgements
Leah Honka, Jenn Melatini, and Brandon Heung. We are grateful for their help with sampling and laboratory analyses.
References
BC Ministry of Forests, 1996. Cottonwood and Balsam Poplar Managers’ Handbook for British Columbia. Forestry Canada, BC.
BC Ministry of Forests, Forestry Canada, 1991. Cottonwood: Ecological site quality and growth in coastal BC FRDA Memo no. 183.
Binkley, D., 1995. The influence of tree species on forest soils: processes and patterns. In: Mead, D.J., Cornforth, I.S. (Eds.), Proceedings of the Trees and Soil Work-shop. Lincoln University Press, Canterbury, pp. 1–33 (Agronomy Society of New Zealand Special Publication #10).
Binkley, D., Giardina, C., 1998. Why do tree species affect soils? The warp and woof of tree–soil interactions. Biogeochemistry 42, 89–106.
Bormann, B.T., DeBell, D.S., 1981. Nitrogen content and other soil properties related to age of red alder stands. Soil Sci. Soc. Am. J. 45, 428–432.
Borenstein, M., Cohen, J., 1988. Statistical Power Analysis: A Computer Program. Lawrence Erlbaum Associates, New Jersey.
Bremner, J.M., 1965. Nitrogen availability indices. In: Black, C.A. (Ed.), Methods of Soil Analysis, Part 2, Agronomy, vol. 9. Am. Soc. of Agron., Inc., Madison, WI, pp. 1324–1345.
Carter, M.R., 1993. Soil Sampling and Methods of Analysis. Canadian Society of Soil Science. Lewis Publishers, 823 pp.
Chandler, J., Schmidt, M.G., Dragicevic, S., 2008. Spatial patterns of forest floor prop-erties and litterfall amounts associated with bigleaf maple in conifer forest of southwestern British Columbia. Can. J. Soil Sci. 88, 295–313.
Côté, L., Brown, S., Pare, D., Fyles, J., Bauhus, J., 2000. Dynamics of carbon acid nitrogen mineralization in relation to stand type, stand age and soil texture in the boreal mixedwood. Soil Biol. Biogeochem. 32, 1079–1090.
Devito, K., Westbrook, C.J., Schiff, S.L., 1999. Nitrogen mineralization and nitrification in upland and peatland forest soils in two Canadian Shield catchments. Can. J. For. Res. 29, 1793–1804.
Fisher, R.F., Binkley, D., Pritchett, W.L., 2000. Ecology and Management of Forest Soils, third ed. John Wiley, New York.
Flannagan, P.W., Van Cleve, K., 1983. Nutrient cycling in relation to decomposition and organic-matter quality in taiga ecosystems. Can. J. For. Res. 13, 795–817. Folke, C., Carpenter, S., Walker, B., Scheffer, M., Elmquist, T., Gunderson, L., Holling,
C.S., 2004. Regime shifts, resilience, and biodiversity in ecosystem management. Annu. Rev. Ecol. Evol. Syst. 35, 557–581.
Fried, J.S., Boyle, J.R., Tappeiner II, J.C., Cromack Jr., K.J, 1990. Effects of bigleaf maple on soils in Douglas-fir forests. Can. J. For. Res. 20, 259–266.
Goering, H.K., Van Soest, P.J., 1970. Forage Fiber Analyses (Apparatus, Reagents, Procedures and Some Applications). U.S. Dep. Agric. Handbook No. 379, 20 pp (Washington, DC).
Green, R.N., Trowbridge, R.L., Klinka, K., 1993. Towards a taxonomic classification of humus forms. For. Sci. 39, 1–48.
Haeussler, S., Coates, D., Mather, J., 1990. Autoecology of common plants in British Columbia: a literature review. FRDA Report ‘58. Forestry Canada, BC Ministry of Forests.
John, M.K., 1970. Colorimetric determination of phosphorus in soil and plant mate-rials with ascorbic acid. Soil Sci. 109, 214–220.
Kalra, Y.P., Maynard, D.G., 1991. Methods Manual for Forest Soil and Plant Analysis. Forestry Canada, Northwest Region, Northern Forestry Centre, Alberta, Canada. Kleinbaum, D.G., Kupper, L.L., Muller, K.E., Nizam, A., 1998. Applied Regression Anal-ysis and Other Multivariable Methods, third ed. Duxbury Press, Toronto, p. 798. Klinka, K., Krajina, V.J., 1986. Ecosystems of the University of British Columbia Research Forest, Haney, BC. Faculty of Forestry, University of British Columbia, Vancouver, BC.
Maguire, D.A., 1994. Branch mortality and potential litterfall from Douglas-fir trees in stands of varying density. For. Ecol. Manage. 70, 41–53.
Malcolm Knapp Research Forest, 2008. General Information, Location and Ecol-ogy. Retrieved October 14, 2008 <http://www.mkrf.forestry.ubc.ca/general/ ecology.htm>.
Ogden, A., Schmidt, M., 1997. Litterfall and soil characteristics in canopy gaps occu-pied by vine maple in a coastal western hemlock forest. Can. J. Soil Sci. 77, 703–711.
Ollinger, S., Smith, L.M., Martin, M.E., Hallett, R.A., Goodale, L.C., Aber, J.D., 2002. Regional variation in foliar chemistry and N cycling among forests of diverse history and composition. Ecology 83, 339–355.
Pandey, U., Singh, J.S., 1982. Leaf-litter decomposition in an oak-conifer forest in Himalaya: the effects of climate and chemical composition. Forestry 55, 47–59. Paré, D., Bergeron, Y., 1996. Effects of colonizing tree species on soil nutrient avail-ability in a clay soil of the boreal mixedwood. Can. J. For. Res. 26, 1022–1031. Pastor, J., Gardner, R.H., Dale, V.H., Post, W.M., 1987. Successional changes in nitrogen
availability as a potential factor contributing to spruce declines in boreal North America. Can. J. For. Res. 17, 1394–1400.
Perez, C., Hedin, L.O., Armesto, J.J., 1998. Nitrogen mineralization in two unpol-luted old-growth forests of contrasting biodiversity and dynamics. Ecosystems 1, 361–373.
Piotrowski, J.S., Lekberg, Y., Harner, M.J., Ramsey, P., Rillig, M., 2008. Dynamics of mycorrhizae during development of riparian forests along an unregulated river. Ecography 31, 245–253.
Prescott, C.E., 1992. Immobilization and availability of N and P in the forest floors of fertilized rocky mountain coniferous forests. Plant Soil 143, 1–10.
Prescott, C.E., Blevins, L., 2000. Litter decomposition in British Columbia forests: influences of forestry activities. In: Hollstedt, C., Innes, T. (Eds.), Proceedings, From Science to Management and Back: A Science Forum for Southern Interior Ecosystems of British Columbia. Southern Interior Forest Extension and Research Partnership, Kamloops, BC, pp. 119–121.
Prescott, C.E., Hope, G.D., Blevins, L.L., 2003. Effect of gap size on litter decomposition and soil nitrate concentrations in a high-elevation spruce-fir forest. Can. J. For. Res. 33, 2210–2220.
Prescott, C.E., Vesterdal, L., Preston, C.M., Simard, S.W., 2004. Influence of initial chemistry on decomposition of foliar litter in contrasting forest types in British Columbia. Can. J. For. Res. 34, 1714–1729.
Reich, P.B., Grigal, D.F., Aber, J.D., 1997. Nitrogen mineralization and productivity in 50 hardwood and conifer stands on diverse soils. Ecology 78, 335–347. Ryan, M.G., Melillo, J.M., Ricca, A., 1990. A Comparison of methods for determining
proximate carbon fractions of forest litter. Can. J. For. Res. 20, 166–171. Schulp, C., Nabuurs, G., Verburg, P.H., de Waal, R.W., 2008. Effect of tree species on
carbon stocks in forest floor and mineral soil and implications for soil carbon inventories. For. Ecol. Manage. 256, 482–490.
SPSS Inc., 2006. SPSS 15.0 Command Syntax Reference. SPSS Inc., Chicago, IL. Tarrant, R.F., Lu, K.C., Bollen, W.B., Franklin, J.F., 1969. Nitrogen enrichment of two
forest ecosystems by red alder. USDA Forest Service Research Paper PNW-76, Portland, OR, 8 pp.
Tashe, N.C., Schmidt, M.G., 2001. The impact of vine maple on site fertility of coastal temperate forests. For. Ecol. Manage. 147, 263–279.
Tashe, N.C., Schmidt, M.G., 2003. The influence of understory vine maple on forest floor and mineral soil properties in coastal temperate forests. Can. J. Soil Sci. 83, 35–44.
Turk, T.D., 2006. The role of bigleaf maple in soil chemistry and nutrient dynamics in a coastal temperate forest. M.Sc. Thesis. Department of Geography, Simon Fraser University, Burnaby, BC, 89 pp.
Turk, T.D., Schmidt, M.G., Roberts, N.J., 2008. The influence of bigleaf maple on for-est floor and mineral soil properties in a coniferous forfor-est in coastal British Columbia. For. Ecol. Manage. 255, 1874–1882.
USDA Forest Services, 2008. Cottonwood. Silvics Manual Volume 2, Hard-woods, Agriculture Handbook 654, Retrieved October 2008 <http://www.na.fs. fed.us/spfo/pubs/silvics manual/volume 2/populus/trichocarpa.htm>. Van Miegroet, H., Cole, D.W., 1984. The impact of nitrification on soil
acidifi-cation and acidifi-cation leaching in a red alder ecosystem. J. Environ. Qual. 13, 586–590.
Vivanco, L., Austin, A., 2008. Tree species identity alters forest litter decomposition through long-term plant and soil interactions in Patagonia, Argentina. J. Ecol. 96, 727–736.
Waring, S.A., Bremner, J.M., 1964a. Ammonium production in soil under waterlogged conditions as an index of nitrogen availability. Nature 201, 951–952. Waring, S.A., Bremner, J.M., 1964b. Effect of soil mesh-size on the estimation of
mineralizable nitrogen is soils. Nature 202, 1141.
Washburn, C., Arthur, M.A., 2003. Spatial variability in soil nutrient availability in an oak-pine forest: potential effects of tree species. Can. J. For. Res. 33, 2321–2330. Weih, M., 2004. Intensive short rotation forestry in boreal climates: present and