A Sociolinguistic Profile of the
Tharu Dialects of the Western
Indo-Nepal Tarai
Western Indo-Nepal Tarai
Compiled by Jeff Webster
Primary Researchers:
Edward Boehm
M. G. D.
A. G.
K. A. J.
M. L.
N. L.
Laura Beth Webster
Jeff Webster
SIL International
®2017
SIL Electronic Survey Report 2017–013, August 2017 © 2017 SIL International®
The purpose of this sociolinguistic survey of the Tharu dialects of the Indo-Nepal Tarai was to investigate three areas: 1) socio-cultural factors: to discover important social, cultural, and geographic information about the Tharu; 2) strategic factors: to determine the best strategy for work among the Tharu; and 3) the need for mother tongue literature and literacy classes: to determine whether or not the Tharu desire written materials and literacy classes in their mother tongue, and if so, where.
Data collection for this survey began in September 1992 and was completed in November of the same year. The survey team, eight others besides myself, did an outstanding job in administering over 400 recorded text tests, 190 sentence repetition tests, and 100 language use and attitude questionnaires, and in collecting fifteen word lists, all in less than two months! The team covered a huge area—by bus, train, rickshaw, bicycle, and on foot.
Towards fulfilling the first two purposes of this survey, the investigation of socio-cultural and strategic factors, we can claim only partial success. So much more could be learned about the Tharu, but the solid foundation of cultural observation and experience by the team provides a sound basis for achieving the goals that relate to these purposes. Conclusions remain tentative, and the team remains sensitive to their need to continue as learners of the rich and complex Tharu culture.
iii
Contents
1 Introduction
1.1 Geography
1.2 People
1.2.1 Origins
1.2.2 Culture
1.2.3 Subgroups of Tharu
1.2.4 Population
1.3 Language
2 Goals
2.1 Dialect area study
2.1.1 Lexical similarity
2.1.2 Dialect intelligibility
2.2 Bilingualism
2.3 Language use and language attitudes
2.4 Tharu culture
3 Summary of findings
3.1 Tharu speech varieties
3.2 Tharu’s relationship to Hindi
3.3 Bilingualism in Hindi
3.4 Language use and language attitudes
3.5 Tharu culture
4 Study of dialect areas
4.1 Word list comparison
4.1.1 Procedures
4.1.2 Results
4.2 Dialect intelligibility
4.2.1 Procedures
4.2.2 Results
5 Bilingualism
5.1 Recorded text testing
5.1.1 Procedures
5.1.2 Results
5.2 Sentence repetition testing
5.2.1 Procedures
5.2.2 Results
6 Language use and attitudes, and language vitality
6.1 Procedures
6.2 Results
6.2.1 Language use
6.2.2 Language attitudes
7 Recommendations
7.1 For literature development and literacy programs
Appendix A. International Phonetic Alphabet (IPA) Appendix B: Tharu Survey Word Lists
1
1 Introduction
1.1 Geography
The Tharu are an aboriginal tribe inhabiting the whole sub-Himalayan Tarai from Nainital District of Uttar Pradesh in the west to just beyond the eastern border of Nepal. They live on both sides of the
India-Nepal border (Grierson 1916b:311 and Srivastava 1958:v).1
This survey focused only on the western half of the Tharu region: those Tharu groups living from Nainital District in the west, to Gonda District in the east, including both sides of the India-Nepal border. See maps 1, 2, and 3. Other Tharu groups live in the Tarai east of Gonda District, but they must await investigation at a future time. Map 4 shows the distribution of Tharu in the Tarai districts of Nepal.
Map 1. Tharu survey area
Source: © 1993 Ed Boehm. Used by permission.
Map 2. Nainital and Kheri
Source: © 1993 Ed Boehm. Used by permission.
Map 3. Kheri, Bahraich, Gonda, and Basti
Map 4. Tharu population of Nepal
Source: © 1993 Ed Boehm. Used by permission.
The Tarai—the name for the geographic region inhabited by the Tharu—is the strip of tropical, marshy flatlands that runs along the base of the east-west foothills of the Himalayas. The Tharu are found especially in the heavily forested areas of the Tarai. For centuries, the malaria and wild animals of the Tarai jungle ensured that only malaria-immune indigenous groups like the Tharu lived in this area. Neville (1905:71) writes that the Tharu “appear to be almost the only race that can stand the deadly climate of that tract.” But as World Health Organization spraying in the late 1950s largely eradicated malaria, other groups from the hills and the plains began to move in. Highways were built, agriculture spread, the timber industry was established, and the Tharus suddenly had fierce competition for their fertile land (Dahal 1992:17).
The various clans of Tharu are found living in different regions, generally separate from one another; these clans will be discussed in §1.2.3. Rana Tharu are located in Khatima, Sitarganj, Kichha, and Haldwani Tehsils of Nainital District, in Nighasan Tehsil of Kheri District, and in the far
southwestern districts of Nepal.
Buksa, a separate clan from Rana Tharu, are located in southwestern Nainital district, along a diagonal from Ramnagar to Dineshpur. They live in about 130 villages in Kichha and Kashipur Tehsils. There are also small numbers reported in Bijnor and Garhwal Districts.
Dangora Tharu generally live to the east of Rana Tharu. In India they live primarily along the
border in Nighasan Tehsil of Kheri District and Tulsipur Tehsil of Gonda District.2 In Nepal they live in
all border districts west of Dang-Deokri District. It appears that they are newcomers to the Indian side of the border.
Dang Tharus live primarily in the Dang valley of Dang-Deokri District, east of the Dangoras. The valley is at an elevation of about 600 meters above sea level (MacDonald 1975:267).
Kathoriya Tharus are found living in approximately the same areas as Dangoras. They are most heavily concentrated in Kailali District of Nepal, but are also in Kheri and Gonda Districts of India.
1.2 People
1.2.1 Origins
Srivastava (1958) provides a good summary of the debate over the origins of the Tharu. Many believe them to be originally a Dravidian race that has become more Mongoloid in appearance as a result of alliances with different hill races. Srivastava concludes, however, that they are the northernmost extension of the “Middle Indian aboriginal races,” since their basic cultural patterns are the same as those farther south. They are predominantly Mongoloid in their physical makeup, yet distinct from other groups in Nepal in that they have assimilated non-Mongoloid physical features as well.
Various authors have searched for Tharu origins by doing an etymology of their name, generally tracing through Hindi. Nesfield (in Srivastava 1958:186) searched for the meaning in the local language,
showing that the word thar in the dialect of the lowest classes means “a man of the forest”—an accurate
description of the people. One Tharu legend speaks of their tie to the forest (Müller-Böker 1991:112):
Long ago, God called all people to him in order to give them riches. All the castes, such as the Pahariyas, the Newaris, and the Tharus, started toward God in order to receive riches from him. After wandering a long way, they passed through a beautiful forest area (kathaban). Everyone continued their journey; only the Tharus remained in the forest, looking around for nice wood, thereby forgetting to continue their journey to God. After some time, the other people came back with riches, and the Tharus came back from the forest.
Though their exact origins may be debated, it is fairly certain that the Tharu are the original inhabitants of the Tarai, and that they have only recently been joined there by other groups.
Most of the Tharu interviewed in this survey claimed to be the descendants of Rajput women who fled Rajasthan approximately 800 years ago during a great battle in which their king was defeated. These women intermarried with their servants and settled in the dense forestlands of the north.
The Dangora Tharu in Gonda District trace their ancestry to Dang District in Nepal. They say that many people left Dang a long time ago and settled to the south, when there was a very evil king who was making life difficult for the people.
1.2.2 Culture
The religion of the Tharus is traditionally animistic, but many are now outwardly adopting Hindu beliefs and practices. They are a god-fearing people, with firm faith in deities, demons, and evil spirits, and they attribute the forests as the place where the gods and spirits live. They believe in a supreme being Thakur who is generally too distant and too benevolent to do any harm to mankind (Srivastava 1958:186). Many Tharu houses have a small raised platform in the front yard for household deities, often small images of horses.
Reportedly tracing back to their Rajput ancestry, Tharu women hold a dominant position in the family in many matters, with considerable freedom and great influence. They are the decision makers, though under the influence of Hindu culture the men are dominating the women more today.
various forest products. They are meat eaters, relishing many kinds of wild meat, though today hunting is much restricted. A distinction between Dangora and Rana Tharu is that the Dangora eat field rat and the Rana do not.
Tharu villages generally are quite independent of one another, not mixed with outside groups, and rarely with more than one clan of Tharu. Households are large with the extended family (all the sons’ families) all living in one house. Average household size is about ten, but households of up to fifty are not unheard of.
Until recently, the Tharu had little competition for land, filled as it was with malaria and wild animals, but since 1947 they have had increasing competition. Sikhs fleeing the Punjab arrived and began farming in the once dense jungle. Paharis came from the north seeking more prosperous farmland, and now make up 35–40 percent of the population of Nepal’s Tarai, compared to around five percent at the turn of the twentieth century (Dahal 1992:18). With their weakness for alcohol and their
inexperience at dealing with other groups, the Tharu rapidly lost their land and had nothing to show for it. In 1967 the Indian government declared the Tharu a Scheduled Tribe, which has provided some relief for them, but still today they are widely exploited by moneylender landlords.
The exploitation of the Tharu in the western Tarai of Nepal, according to Dahal (1992:17), extends
beyond landlessness to a system of bonded labor known as kamaiya, in which a man’s debt passes on to
his sons, leading to generations bonded by debt to landlords and moneylenders. These landlords are not only Bahuns Brahmins and Chhetris, but also Tharus themselves.
Dahal (1992:17) suggests that the Tarai is simmering with discontent. Three groups compete for limited resources: the original inhabitants like the Tharu must now learn to coexist with those of “Indian origin” and the Nepali highlanders.
With regard to marriage pattern, the Tharu always marry within their own clan, but generally with someone from outside their own village. The new couple takes up residence in the village of the groom. The average age of marriage is around fifteen (Singh 1988:17).
1.2.3 Subgroups of Tharu
Outsiders generally view the Tharu as one homogeneous group, and refer to them as Tharu or Tharuwa. The Tharu, however, recognize many different subgroups distinguished by clan, region, cultural
differences, and language. There are at least eight different clans, but the exact number is not known. Most Tharus interviewed in Nainital District knew that there were different clans of Tharu living much farther to the east, but they did not know anything about them. There is little interaction between clans.
The main clans of the Tharu are: 1) Rana, living mostly in Nainital District; 2) Buksa Bukas, Bhuksa, Buxa, recognized as a separate Scheduled Tribe by the government of India, living almost exclusively in Nainital District; 3) Dangora Dangoria, Dangaria, Dangwaria, Dangra, probably the most numerically dominant clan, living mostly in southwestern Nepal; 4) Kathoriya Tharu Katharya, Kateria, living in the same general area as the Dangora, but much smaller numerically; 5) Dang Tharu, living in Dang-Deokri District of Nepal; and 6) Sunha, Kutchia, and Thakur, whose exact location in southwestern Nepal is not known.
1.2.4 Population
India
The number of Tharu of all clans living in northern Uttar Pradesh is just over 115,000. Of these, an estimated 20,000 are Buksa in Nainital and Bijnor Districts. Nearly 54,000 mostly Rana Tharu live in Nainital District; approximately another 10,000 Rana are in Kheri and Pilibhit Districts. The remaining
31,000 Tharu in Uttar Pradesh are mostly Dangora, but mixed with Kathoriya and possibly other clans.3
Table 1 summarizes Tharu population in India by district. Literacy rates (inclusive of all age groups) are also included (Government of India 1981).
Table 1. Population and literacy among Tharu in India
District Total Male Female Male literacy Female literacy
Gonda 11,457 5,871 5,586 12.2% 0.3%
Kheri 17,789 9,301 8,488 8.6% 0.7%
Nainital 73,998 37,549 36,448 31.6% 6.1%
Pilibhit 273 138 135 1.1% 0.7%
Bahraich 6,340 3,270 3,070 7.9% 0.6%
Gorakhpur 2,303 1,230 1,073 43.3% 7.7%
Bijnor 3,647 1,968 1,679 19.5% 1.8%
Nepal
Tharus naming Tharu as their mother tongue are listed in the Census of Nepal for 1981. No subdivisions of Tharu are given. The speaking population in the Western Tarai was 333,755 in 1981. Tharu-speaking populations east of Kapilbastu District most likely speak substantially different varieties of Tharu, and are not included in this number. The total Tharu-speaking population in Nepal in 1981 was 545,685, comprising 3.6 percent of the total national population. Because of immigration by other groups, the Tharus are fast becoming a minority in an ethnically diverse Tarai; however, in districts like Kailali (47 percent), Bardiya (37 percent), and Dang (32 percent), Tharus still comprise a significant proportion of the population (Government of Nepal 1984a, and Rajaure 1992:37). Map 4 shows the distribution of Tharu in Nepal according to the 1981 census.
1.3 Language
The most common local term used to refer to the language spoken by the different clans of Tharu is simply “Tharuwa”; however, for consistency with the literature, “Tharu” will be used in this report to refer both to the people and the language. If questioned more specifically, Tharus will describe their language by clan name, recognizing that differences are largely clan-based. The clan names will also be used in this report to refer to the more localized speech varieties, such as Buksa, or Buksa Tharu, spoken by the Buksa clan in Nainital District. The locations of these varieties of Tharu are the same as the location of the clans discussed in §1.1.
Tharu is technically classified as part of either the Western or Eastern Hindi branch, Central Zone, Indo-Aryan, Indo-Iranian, Indo-European (Voegelin and Voegelin 1965:263; Grierson 1916b, 1916c).
Grimes (1988:567) lists Dang Tharu as an unclassified member of the Central Zone; four other Tharu varieties listed are classified in the Eastern Zone of Indo-Aryan.
From early descriptions, it seems clear that there are many different varieties of Tharu, all having many similarities with better-known regional languages, but all having enough differences to make further investigation and classification necessary.
Grierson’s (1916b:311) conclusion is that there is “no such thing as a Tharu language. Everywhere the Tharus speak, more or less correctly, the language of the Aryan races with whom they are
immediately in contact.” He refers to it mostly as a “broken” or “corrupt” form of some other language; often Tharu is used as an adjective to modify one of the more well-known regional languages: “Tharu Bhojpuri…is spoken along the Nepal frontier from [Gorakhpur] to Bahraich…. [It is] a corrupt form of Bhojpuri, mixed here and there with aboriginal words that will repay the investigations of the
ethnologist. It is worth noting that the Tharus of Bahraich and Gonda speak Bhojpuri, while the local Aryan language is not that language, but is Eastern Hindi” (1916b:42–44).
About the Tharus of Kheri District, Grierson writes that they are reported to speak a “corrupt Gorkhali” (Nepali), but on closer examination he concludes it to be the local Awadhi language mixed with Kanauji, and calls it “Tharu Awadhi” (1916c:121).
Of all the varieties of Tharu surveyed in this report, only a few are listed in the Ethnologue (Grimes
1988). Dang Tharu is recognized as distinct from Chitwan Tharu, with “Dhangura” listed as one of its variant names; Dangora, as used in this report, is probably a variant spelling of this. “Kathariya” is listed as a dialect of Dang Tharu. “Rana Thakur” is listed as a separate language located in the far east of Nepal; it is uncertain if this is related to the Rana Tharu or Thakur Tharu in this survey.
Population figures for the varieties of Tharu in India are essentially the same as for the clans discussed in §1.2.4; however, we have no statistics on the number of Tharus who do not speak Tharu. Interviews with Tharus living in India indicate that only those living away from Tharu villages,
especially in the cities, no longer speak the language. Offsetting the number of Tharu no longer speaking their mother tongue is the number of outsiders living among them who have learned to speak Tharu.
Hindi is undoubtedly an important second language for Tharus of the Indian Tarai, but its importance diminishes across the border. Dahal (1992:17) writes that Hindi is being pushed as a
unifying language of the Tarai, but that “even in the ‘Hindi-belt’ of Nepal, Hindi is hard to come by other than at political rallies.”
2 Goals
The following goals were formulated for this survey:
• To investigate the differences among the speech varieties spoken by the Tharu population.
• To discover the extent to which these speech varieties differ from Hindi.
• To investigate the extent of community bilingualism in Hindi.
• To investigate language use patterns and language attitudes towards both Tharu and Hindi.
• To discover those key social practices and cultural values that will provide insight into the
worldview of the Tharu.
To reach these five goals, we directed our survey into four main areas: 1) a study of the dialect areas, 2) a study of bilingualism in Hindi, 3) a study of language use and attitudes, and 4) a study of the Tharu culture.
2.1 Dialect area study
2.1.1 Lexical similarity
each other in sound and meaning. In this study lexical similarity is investigated by means of comparing equivalent words using 210-item word lists. Results are expressed as a percentage of similar items.
2.1.2 Dialect intelligibility
Another goal of the dialect study is to investigate the degree of inherent intelligibility between the different speech varieties spoken in the Western Indo-Nepal Tarai. Inherent intelligibility is
understanding that is the result of two speech varieties being closely related to one another, as opposed to understanding that is acquired by exposure. Intelligibility testing, used in tandem with lexical similarity, helps determine the most meaningful grouping of speech varieties. Inherent intelligibility is inferred from a sample’s average understanding of a recorded text. The results are expressed as a percentage, based on the average of scores on a recorded text test. Sample size and standard deviation are also given.
2.2 Bilingualism
The third goal, concerning community bilingualism in Hindi, was formulated because of the important role that Hindi plays in education, commerce, media, and religion. Extensive and high-level bilingualism would suggest that local communities could effectively use media in these languages. In this study, bilingualism is investigated using both recorded text tests and a sentence repetition test. The results for recorded text tests are expressed as in §2.1.2. The results for sentence repetition testing are expressed as the percentage of the population at a particular level of fluency.
2.3 Language use and language attitudes
The fourth goal concerning language attitudes towards Tharu was formulated because of the powerful effect that attitude has on the acceptance and use of literature, and because present language use patterns provide an indication of the future of a language. Strong attitudes against Hindi, or in favor of the development of Tharu, could significantly restrict the understanding and acceptance of written materials in Hindi, even if research suggests Tharu speakers adequately understand it. This investigation uses formal and informal questionnaires in addition to observation. Results are expressed as the
percentage of subjects giving a particular response; they are also documented with quotes from individuals interviewed and with observations by the researchers.
2.4 Tharu culture
The final goal of investigating the Tharu culture was formulated because of the need to understand important cultural differences before initiating cross-cultural work. In this study, culture was investigated by observation and informal interviews, using a list of topics and questions to guide the investigation. Results are presented in this report as a summary of general information about the Tharu, included mostly in §1. More specific details are given in a separate document entitled “A summary of Tharu culture,” included here as appendix G.
3 Summary of findings
3.1 Tharu speech varieties
There is considerable diversity among the Tharu varieties encountered in this survey. Language
The different varieties share as little as 58 percent lexical similarity. Among these, there are four subgroups that arise from the study of the word lists: 1) Buksa, 2) Rana, 3) Kathoriya and Sunha, and 4) Dangora (from west to east). These four subgroups form a dialect chain in which similarity decreases
with distance. From the word lists, Kathoriya Tharu (KkP)4 appears to be a potential center point in the
chain, a variety that even the ends of the chain might understand.
Recorded text testing confirms the suspicion that Kathoriya Tharu is a center point in a dialect chain. Of those varieties tested on their understanding of Kathoriya Tharu (KkP), subjects averaged 90 percent or better. At the ends of the dialect chain, however, Rana Tharus (RNS) understood the Dang Tharu (DDK) text at an average of only 51 percent (DDK understood the RNS text at an average of 68 percent).
Besides Kathoriya (KkP), no other reference point was understood well at all of the other test points. Interestingly, not only is KkP understood well at the other test points, but subjects in KkP also
understood the other reference points better than any other test point.
Only four of six possible test points were tested on the Kathoriya recorded text test (RTT). Neither Rana (RNS) nor Buksa (BNM) (both in Nainital District) was tested on the Kathoriya RTT. Because RNS, BNM, and RKB had such uniformly high scores among themselves, it is expected that results from RKB would be fairly representative of results from RNS and BNM. Final verification of the suspected high intelligibility at these two points needs further testing.
From lexical similarity results, it appears that Chitwan Tharu, to the east of this survey area, is quite different from the varieties studied here, and should be thought of as a separate language.
3.2 Tharu’s relationship to Hindi
Hindi is closely related to the Tharu varieties in this survey. Lexically, it is closest to the Buksa and Rana varieties, and somewhat less similar to the Kathoriya and Dangora varieties. Understanding of a simple Hindi text appears to be quite high among Tharu speakers in India; however, it is likely that these results show an overlay of learned ability in Hindi, an ability that is not shared by all segments in Tharu
communities. In the one village in Nepal where the Hindi text was tested, understanding was quite low, showing that the results from the test points in India may reflect the effect of learning and not just the result of Tharu’s inherent closeness to Hindi.
3.3 Bilingualism in Hindi
Results of testing Hindi bilingualism among the Tharu show a typical pattern of second-language acquisition: those who are educated score significantly better than those who are uneducated. Among those who have received at least one year of education, there is “very good, general proficiency” in Hindi. This educated group comprises approximately 10–30 percent of the population. Among the 70–90 percent who are uneducated, proficiency in Hindi is only at a basic level. Such results indicate that these people would have great difficulty understanding or communicating any complex subject matter in Hindi.
3.4 Language use and language attitudes
Tharu is nearly always used in the home. There is no indication that Tharu is being replaced by Hindi in the critical domains of home and religion. The use of the Tharu language continues to be important for in-group communication.
Attitudes towards the use of Tharu are consistently strong and positive. All indications are that Tharu will remain in use as a mother tongue for the foreseeable future. Attitudes are tentatively positive towards literature in Tharu; however, attitudes towards literature in Kathoriya Tharu are somewhat negative, though this assessment is very preliminary.
3.5 Tharu culture
Like many tribal groups in India, the Tharus are changing rapidly. In many ways they are maintaining an uncomfortable balance between their traditional culture and the encroaching Hindu culture; Tharu culture today is a blend of both worlds. Among the younger generation, education is providing
opportunity for advancement in the national culture; the other key force of change is immigration into traditional Tharu areas by outside groups. The maintenance of language, a key measure of change in a culture, suggests that the Tharu will continue to maintain a strong sense of cultural identity in the foreseeable future.
4 Study of dialect areas
The purpose of a dialect area study is to define in quantifiable terms the differences existing between speech varieties in a given geographic area. In order to understand the extent of dialect differences throughout the western Indo-Nepal Tarai, a dialect area study was carried out which consisted of word list comparison and dialect intelligibility testing.
4.1 Word list comparison
4.1.1 Procedures
Comparing word lists between two points is one method of measuring the similarity of those two speech varieties. This systematic study of vocabularies is known as a lexical similarity study. Speech varieties that have more words in common (higher lexical similarity), generally understand each other better than those communities that have fewer words in common.
Analysis of the word lists was by means of grouping similar words together for each English gloss and calculating the percentage of similar words between any two word lists. Similarity is based on phonological similarity and not strictly on cognate relationship, using similarity-counting procedures outlined in Blair (1990:31–32). After the words were grouped according to these counting procedures, an analysis was run using the compass algorithm in Wimbish’s Wordsurv program (1989). Additional phonological regularities were identified in this way, and the groupings readjusted to account for these.
Word list similarity, or lexical similarity, below 60 percent typically corresponds with inadequate intelligibility between the compared varieties (reflective of distinct languages). Lexical similarity above 90 percent typically corresponds with high intelligibility between the compared varieties (reflective of very closely related dialects). Dialect intelligibility testing is not usually required for either situation. Lexical similarity between 60 and 90 percent warrants fuller investigation by means of dialect
intelligibility testing to determine the nature of the relationship between the two speech varieties (Blair 1990:23).
A 210-item word list was elicited from mother tongue speakers of each speech variety under investigation, and transcribed using first the Devanagari script and then the International Phonetic Alphabet. This alphabet and the complete word lists are shown in appendices A and B. In most cases, word lists were double-checked with other mother tongue speakers for errors and to weed out items that appeared to be different but which are really only synonyms. Past experience shows that
Because Hindi plays such a strong role as an inter-group language, there is often the problem of eliciting a Hindi word when a local word is commonly used. For this reason, a strong effort was made at all times to elicit local Tharu words if they were still in use.
4.1.2 Results
A total of sixteen word lists were compared: table 2 identifies each list by the three-letter code, name, and location it represents. The maps show the location of these word list points.
Table 2. Word lists, source locations, and identity codes
Code Speech variety Location: Village, Tehsil, District, Country
BNM Bhuksa Tharu Madnapur, Gandepur, Nainital, India
BNT Bhuksa Tharu Thari, Ramnagar, Nainital, India
RNK Rana Tharu Sugia, Khatima, Nainital, India
RNS Rana Tharu Sisaikera, Sitarganj, Nainital, India
RNS Rana Tharu Sisana, Sitarganj, Nainital, India
RkM Rana Tharu Majhgam, Kanchanpur, Kanchanpur, Nepal
RKB Rana Tharu Bangama, Nighasan, Kheri, India
TkN Thakur Tharu Naibasti, Mahendranagar, Kanchanpur, Nepal
KkP Kathoriya Tharu Pavera, Pavera, Kailali, Nepal
SkP Sunha Tharu Piparia, Mahendranagar, Kanchanpur, Nepal
DKS Dangora Tharu Sivratnapur, Asuliya, Kelali, Nepal
DDK Dang Tharu Kotani, Dang, Dang-Deokri, Nepal
DGC Dangora Tharu Chandanpur, Tulsipur, Gonda, India
DkR Dangora Tharu Rajipur, Kanchanpur, Kanchanpur, Nepal
CCC Chitwan Tharu Chitwan, Chitwan, Chitwan, Nepal
HIN Hindi Standard, Uttar Pradesh, Hindi, India
Table 3. Lexical similarity for all word list points
BNM—Buksa
93 BNT—Buksa BUKSA
77 76 RNK—Rana 79 76 97 RNS—Rana
79 77 97 97 RNS—Rana RANA
77 73 91 89 93 RkM—Rana 77 75 90 91 89 88 RKB—Rana 76 75 84 83 87 85 83 TkN—Thakur
69 66 74 74 76 74 79 74 KkP—Kathoriya LINK DIALECTS
67 65 71 71 74 70 70 71 73 SkP—Sunha
65 63 67 67 68 66 72 68 79 74 DKS—Dangora
59 58 64 63 64 63 66 63 76 73 92 DDK—Dang DANGORA
64 61 68 68 69 69 71 66 79 72 89 88 DGC—Dangora 60 58 63 63 66 66 65 67 74 72 85 86 82 DkR—Dangora
58 56 56 57 57 57 58 60 63 63 65 63 61 67 CCC—Chitwan OTHERS
83 80 70 70 71 68 70 72 68 66 64 59 58 65 60 HIN—Hindi
As much as possible, varieties that are more similar are placed next to one another in this table, and spaces are inserted to draw attention to dialect groupings. Several observations can be made about this display of lexical similarity. Percentages vary from a high of 97 to a low of 56. It is also clear that the speech varieties cluster into several groups. Excluding Chitwan (CCC) and Hindi (HIN), there are four main subgroups: Buksa, Rana, Dangora, and a “link” group.
Figure 1 graphically shows groupings and the similarity percentages (from table 3) at which any two groups can be linked. For example, the Rana and Buksa groups are linked and become one group, which shares lexical similarity of 73 percent or greater.
Figure 1. Grouping of test points based on lexical similarity data.
Subgroups of Tharu based on lexical similarity
Two Buksa points (BNM, BNT) form the Buksa subgroup that unites at 93 percent lexical similarity. The Buksa and Rana subgroups share at least 73 percent lexical similarity with each other.
Sunha (SkP) and Kathoriya (KkP) do not fit easily in any of the other subgroups. Sunha shares 70 percent or greater lexical similarity with the Rana group, and 72 percent or greater with the Dangora group. Kathoriya shares 74 percent or greater similarity with both the Rana and Dangora groups. Both Sunha and Kathoriya seem to form bridges between the Rana and Dangora groups: Rana and Dangora only share 63 percent or greater lexical similarity with each other.
Other neighboring languages
The geographically nearest Tharu variety examined in this survey is Chitwan Tharu (CCC), using a partial word list from Leal (1978). It is clearly quite different from the other varieties, sharing from a low of 56 percent lexical similarity with one of the Rana varieties to a high of 67 percent with one of the Dangora varieties.
The lexical similarity results show that the Buksa subgroup is most closely related to Hindi (80 percent or greater); the Rana subgroup shares 68 percent or greater similarity with Hindi; the Dangora subgroup is least similar of all the subgroups with Hindi (58–65 percent).
Comparing lexical similarity with Hindi is particularly troublesome: it is very difficult to distinguish between Hindi words that have become part of the local vocabulary, and those that have been given because the researchers were using Hindi. The Buksa word lists may be especially affected by this problem: Buksa is lexically closer to Hindi than to any of the other Tharu varieties, results that are a bit suspicious. In regard to this, see §4.2.2 for a discussion of the relationship between lexical similarity and understanding of a recorded text.
4.2 Dialect intelligibility
4.2.1 Procedures
The procedures for testing dialect intelligibility are those described by Casad (1974) and Blair (1990). These procedures will be described briefly here.
For each speech variety under investigation a short two to four minute narrative story is recorded from a mother tongue speaker. Each story is transcribed phonetically (often in Devanagari first) and translated into English, thus facilitating the development of a list of simple questions about the story. Questions for each story are translated and recorded into each of the other speech varieties under investigation. An RTT is then developed which consists of a story played one time through, followed by that same story interspersed with questions about that story. Questions are always in the mother tongue of the subject, and are only played one time each.
The places from which tests are developed are called reference points. The places in which tests are administered are called test points. A test developed and administered in the same place is known as a hometown test. Each RTT must first be screened by a panel of ten mother tongue speakers who validate the test by scoring nearly perfectly on the test in its final form of ten questions. Questions missed by more than one mother tongue speaker are usually eliminated. Likewise, each subject must score at least 80 percent on an RTT in their own mother tongue before they qualify to take an RTT in another speech variety. In this way the validity of each test and the suitability of each subject is ensured.
Generally speaking, if a sample of ten people from a test point averages 80 percent or higher on a recorded text test, then that community is said to adequately understand the dialect of the reference point—the test point and the reference point are varieties of the same language.
they had just needed a bit more time to adjust to the researchers and the testing method. In another instance, several subjects were tested on a series of tests without first taking a hometown test. These were accepted only because they all scored 100 percent on the next test, proving their suitability as subjects.
The result of intelligibility testing is expressed as a percentage (based on the mean average) score of a sample of usually ten people. In order to ensure that what is being tested is inherent intelligibility and not acquired intelligibility, standard deviation is calculated. A high standard deviation (above 12 or 13) indicates relatively wide variation in subjects’ test performance. A common cause for such wide variation is that some subjects have acquired intelligibility through contact with people from other speech
varieties. Table 4 shows the relationship between standard deviation and average score on a dialect intelligibility test (Blair 1990:25).
Table 4. Relationship between standard deviation and average score on an intelligibility test
Standard Deviation
High Low
A
ve
ra
ge
S
co
re High
Situation 1
Many people understand well the story on the test tape, but some have difficulty.
Situation 2
Most people understand the story on the test tape.
Low
Situation 3
Many people cannot understand the story, but a few are able to answer correctly.
Situation 4
Few people are able to understand the story on the test tape.
4.2.2 Results
Seven recorded text tests were developed and tested in this survey. Results from testing among these different Tharu varieties are shown in table 5. The tests reference points are listed horizontally across the top; the places where each test was administered are listed vertically down the left side. The top number is the average for the sample; the middle number is the standard deviation; the bottom number is the sample size. For example, ten subjects from DKS scored 91 percent on the test developed in RNS, with a standard deviation of 9.9.
Table 5. Summary results of recorded text test (RTT)
BNM RNS RKB KkP DKS DGC DDK
BNM 98 95 — — — — —
4.4 10.1 — — — — —
13 10 — — — — —
RNS — 97 99 — — 52 51
— 8.1 3.2 — — 18.1 14.5
— 19 10 — — 10 10
RKB 100 96 98 90 88 78 69
0 7.0 4.6 12.5 9.8 8.6 16.3
10 10 23 10 10 10 10
KkP — 96 95 94 93 91 84
— 6.0 7.1 10.7 8.3 8.8 17.1
BNM RNS RKB KkP DKS DGC DDK
DKS — 91 — 97 95 83 87
— 9.9 — 4.8 8.3 11.6 15.7
— 10 — 10 20 10 10
DGC — 73 75 95 79 96 72
— 18.5 18.6 7.0 15.1 7.3 14.8
— 11 11 10 11 23 10
DDK — 68 — 95 — 71 93
— 15.5 — 5.3 — 12.9 8.5
— 10 — 10 — 10 18
The scores on the downward diagonal from left to right (in bold and shaded) are the hometown test scores. These scores ranged from a low of 93 (on a sample of 18 in Dang District DDK), to a high of 98 (on a sample of 23 in Bangama RKB). Subjects missed questions on a hometown test because, in our opinion, a hometown test is so easy that their attention wandered. Other tests required, and received, greater attention. It is interesting to note that in several instances subjects performed better on a test tape from another village than they did on a test from their own village.
Analyzing the scores in each vertical column reveals how well different test points understand the speech variety of that reference point. In general the Rana Tharu reference points (RNS and RKB) were not understood well at the Dangora Tharu test points (DDK and DGC). DDK only scored 68 percent on the RTT from RNS, with wide variation in understanding among the subjects as seen by the standard deviation of 15.5. Likewise, the Dangora reference points were not understood well at the Rana test points: RNS only scored 51 on the test from DDK. RNS and DDK represent the geographic extremes in this survey.
Intermediate geographically, and also according to lexical similarity, is Kathoriya Tharu (KkP). All test points tested (on KkP, RKB, DKS, DGC, and DDK) averaged at least 90 percent. Test points RNS and BNM were not tested on KkP; however, we can extrapolate from the results we do have. Average RTT scores among RNS, RKB, and BNM are uniformly high—all above 95 percent. Based on these high scores, we could have chosen any one of these points as representative of the other two. This suggests that RNS and BNM should not score significantly different from RKB (90 percent) on the KkP test. Therefore, there is one point, KkP, which seems to be adequately understood by all test points in this survey.
Comparison of lexical similarity scores with RTT scores raises some questions. Lexical similarity scores are surprisingly low between the Rana and Buksa groups in light of the fact that RTT scores between RNS and BNM are at least 95 percent. One reason for this, and there are several possible, is that the Buksa word lists show a bias towards Hindi in their similarity: Buksa appears to be more lexically similar with Hindi, which makes it appear less similar with the other Tharu varieties.
5 Bilingualism
Bilingualism is ability in a second language that is the result of learning, either formally (e.g., in school) or informally (as in the bazaar). A recorded text test (RTT) and a sentence repetition test (SRT) were used in this survey to evaluate bilingual ability in Hindi. Bilingualism was only tested at the test points in India. It was not possible to test Nepali ability at any of the test points in Nepal.
5.1 Recorded text testing
5.1.1 Procedures
from dialect intelligibility testing as discussed in §4.2.1. Since this method only evaluates comprehension ability, it is not adequate for evaluating higher levels of bilingual proficiency (Blair 1990:74). Used in conjunction with sentence repetition testing we have a double check on our results, obtaining a more accurate understanding of bilingualism than if only one method were used.
When using recorded text tests in bilingualism testing, care must be taken to test a sample that is representative of the demographic characteristics in the community. A sample of subjects should therefore include men and women, young and old, educated and uneducated, and traveled and untraveled, in the same proportion as the population as a whole.
5.1.2 Results
A Hindi recorded text test was developed in Bareilly, Uttar Pradesh. This was then tested at five test points as a preliminary, or pilot test, of bilingualism in Hindi. The two test points not tested are in Nepal and are more influenced by Nepali. Subjects in DKS (in Nepal on the border) did relatively poorly on the Hindi RTT. On the basis of these results no further testing of Hindi was done in Nepal. All of the test points in India did quite well, showing good understanding of a simple narrative text. These results are summarized in table 6.
Table 6. Hindi RTT results (HinRTT)
Results from this pilot test show that further bilingualism testing is needed. Simple narrative material is understood well by the small samples tested; further testing was needed (using the sentence repetition test) to more thoroughly investigate Hindi proficiency.
5.2 Sentence repetition testing
5.2.1 Procedures
A sentence repetition test (SRT) consists of a set of fifteen carefully selected sentences recorded on a cassette tape. Each sentence is played once for each subject. Subjects are evaluated, according to a four point scale 0–3), on their ability to accurately repeat each sentence. Essentially any deviation from the recorded sentences is counted as an error. A subject’s ability to accurately repeat sentences of increasing difficulty is directly correlated with the overall ability to speak and understand the language: the higher the score, the greater the bilingual ability. Though an SRT is quite time consuming and difficult to develop, once developed it is very quick and easy to administer, making it possible to evaluate a large sample in a community in a very short time. This procedure provides a more complete and accurate evaluation of a community’s bilingual ability than recorded text testing. Radloff (1991) provides complete procedures for constructing and administering a sentence repetition test.
In a community different levels of bilingual ability frequently pattern with such demographic factors as sex, age, education, and amount of travel. These factors, therefore, must be adequately accounted for in the sample tested using the SRT. A small sample of at least five to ten people must be tested for each different combination of demographic factors that the researchers expect to have a significant effect on bilingual ability. The specific demographic factors are determined by observation, by informal interviewing, and from census data. Our samples were chosen keeping in mind the factors of sex, education, and age, with the greatest importance placed on education.
Test Points
RNS RKB BNM DKS DGC DDK KkP HIN
Hindi RTT
91 92 91 74.5 93.5 — — 100
9.4 7.9 11.0 12.1 6.7 — — 0
SRT results are expressed as a point total out of 45 possible points. They are interpreted according to a corresponding bilingualism proficiency level, or reported proficiency evaluation (RPE) level. These RPE levels range from 0+ (very minimal proficiency) to 4+ (approaching the proficiency of a native speaker). Probably at least a level 3 proficiency is required to adequately understand most philosophical
or religious material (Kindell 1991:28).5 Table 7 relates Hindi SRT score with the equivalent RPE level
(Varenkamp 1991:9 and Radloff 1991:242).
Table 7. Score ranges on Hindi SRT corresponding to RPE levels
SRT (Score out of 45) RPE level Proficiency descriptions
44–45 4+ Near-native-speaker proficiency
38–43 4 Excellent proficiency
32–37 3+ Very good, general proficiency
26–31 3 Good, general proficiency
20–25 2+ Good, basic proficiency
14–19 2 Adequate, basic proficiency
8–13 1+ Limited, basic proficiency
4–7 1 Minimal, limited proficiency
0–3 0+ Very minimal proficiency
5.2.2 Results
A demographic profile of a community provides the basis for interpreting the results of bilingualism testing. The percentage of the community with certain social characteristics (e.g., younger, uneducated, female) should be compared with that social group’s average proficiency. Table 8 gives a demographic profile for Tharu populations in this survey. This profile is based on detailed census figures for Kailali District in Nepal (Government of Nepal 1984a) and a Tharu village in Gonda District (Singh 1988:16), in addition to general literacy statistics for districts in Uttar Pradesh (Bose 1991). The range of percentages in each social category reflects the approximate spread among the various Tharu areas.
A total of 190 subjects in five Tharu villages were tested on the Hindi sentence repetition test. In each village a stratified sample was selected that was as representative as possible of the overall village population, based on demographic profiles developed for each village.
Table 8. Demographic profile of Tharu villages
Uneducated (0 years)
Primary Ed. (1–5 years)
Higher Ed. (6+ years)
SEX AGE TOTAL
Male
Younger (15-34) 17–22% 4–7% 4–5% 29%
Older (35+) 19–22% 1–3% 0–1% 23%
Totals (Male) 36–44% 5–10% 4–6% 52%
Female
Younger (15-34) 26–28% 1–3% 0–1% 30%
Older (35+) 16–18% 0–2% 0% 18%
Totals (Female) 42–46% 1–5% 0–1% 48%
TOTALS 78–90% 6–15% 4–7% 100%
Overall results for each village are compared in table 9, along with results for just the uneducated part of the sample: x= mean average, s= standard deviation, N= sample size, L= equivalent RPE level of the average. Individual scores are included in appendix E.
Table 9. Hindi SRT results by village
Overall Uneducated
Village x s N L x s N L
Sisana (RNs)
27.7
12.5
42
3
19.9
11.3
21
2+
Mathpuri (BNM)
28.5
9.0
47
3
24.7
9.1
26
2+
Bangama (RKB)
21.8
11.8
42
2+
16.1
9.5
27
2
Bhusahar Hunchawa
19.3
9.4
39
2
14.7
7.3
23
2
Chandenpur (DGC)
19.4
13.1
20
2
10.1
6.2
10
1+
*Chandenpur was used as a pilot test point. A larger and more representative sample was tested in the nearby
village of Bhusahar Hunchawa.
A few comments can be made about this general display of data. There is a slight decline in average score from west to east: Sisana and Mathpuri are in Nainital District and have the highest scores;
Bhusahar Hunchawa and Chandenpur are in Gonda District and have the lowest scores. There are several reasons for this. Standard Hindi is spoken in Nainital District, but in Gonda District a non-standard variety of Hindi is spoken. Also, the Tharu villages in Gonda District are more remote (with less opportunities for learning Hindi) than in Nainital District.
The difference in average score between most pairs of villages is not statistically significant.
However, SRT results from Mathpuri are significantly different from Bangama, Bhusahar Hunchawa, and
Chandenpur, but not from Sisana.6 Figure 2 shows the distribution of bilingual proficiency levels for both
Mathpuri and Bhusahar Hunchawa. This figure shows that ability in Hindi is quite varied within a village, and also between villages.
Figure 2. Distribution of Hindi proficiency in two Tharu villages with percentage of sample at each level. Keeping in mind that there is wide variation in Hindi ability among the villages, detailed results by social category are presented together in table 10.
Table 10. Summary of SRT results
UNEDUCATED (0 YEARS) EDUCATED (1 YEAR OR MORE)
AGE GROUP: YOUNGER (15–34) OLDER (35+) YOUNGER (15–34) OLDER (35+) TOTAL
MALE
x= 25.4 x= 18.7 x= 32.4 x= 27.3 x= 27.2
s= 9.8 s= 11.2 s= 7.8 s= 10.6 s= 10.9
N= 17 N= 30 N= 52 N= 13 N= 113
L= 2+ L= 2 L= 3+ L= 3 L= 3
FEMALE
x= 17.1 x= 13.7 x= 35.6 x= 17.3 x= 19.3
s= 8.4 s= 8.2 s= 6.6 s= 5.5 s= 11.1
N= 34 N= 26 N= 14 N= 3 N= 77
L= 2 L= 2 L= 3+ L= 2 L= 2
TOTAL
x= 18.1 x= 31.7 x= 24.0
s= 10.0 s= 8.7 s=11.6
N= 107 N= 83 N= 190
L= 2 L= 3+ L= 2+
These results show a typical pattern of second-language acquisition: the educated have a significantly better Hindi ability than the uneducated; for those who are uneducated, men have significantly better Hindi ability than women; and younger people have better Hindi ability than older people. In every social category average Hindi ability is RPE level 2 or higher, characteristic of at least “adequate, basic proficiency.” Those who have completed at least one year of formal education average RPE level 3+, characteristic of “very good, general proficiency.” Those who are educated can probably use Hindi satisfactorily in most situations, though they may have some difficulty using Hindi for communication of philosophical or religious subjects.
However, interpretation of these results must consider the extent of education in the Tharu
communities. A vast majority of the population, perhaps as much as 90 percent, still falls in the category of uneducated; this segment of the population will not be able to adequately use Hindi for
communication of complex subject matter.
6 Language use and attitudes, and language vitality
6.1 Procedures
A study of language use patterns attempts to describe which speech varieties a community uses in different social situations. These situations, called domains, are contexts in which the use of one language variety is considered more appropriate than another (Fasold 1984:183).
A study of language attitudes attempts to describe people’s attitude towards the different speech varieties that are known to them, and about the choices people should make with regard to language use. The primary method for studying both language use and language attitudes among the Tharu was the use of orally administered questionnaires. Observation was also used.
were not included in the final form of the questionnaire. This final form was administered at two test points in conjunction with bilingualism testing.
The questions were asked in Hindi, adding a potential bias from use of the prestige language by the researchers. Some inconsistency in how questions were asked, especially those probing language
attitudes, has led to results that are less reliable than they ought to be.
The following questions comprised the preliminary form of the questionnaire. Those marked with an asterisk were asked on the final form of the questionnaire.
1. What do you call your language?
2. What other languages do you speak?
3. Do you ever speak Hindi with other Tharus?
4. What language do you speak to merchants in the bazaar?
5. *What language is spoken in your home?
6 *What language do the children use when playing?
10. Are there Tharus who speak differently from you? 11. …Where?
12. *Do you understand the Tharu spoken in Kheri District? 13. *…In Gonda District? [In Nainital District?]
14. *Where is the sweetest Tharu spoken?
15. *What language do you use in private worship?
16. *In what language should a mother speak to her young child? 17. Should Tharu children learn to speak Hindi?
18.a *Would it be a good thing for books to be written in Rana Tharu? 18.b *…In Kathoriya Tharu?
19. Would you want your child (or you) to marry someone who spoke only Hindi? 20. …Only Tharu?
24. *Do you think children here will still be speaking Tharu in 50 years?
6.2 Results
6.2.1 Language use
A total of 47 subjects responded to the preliminary form of the questionnaire; an additional 47 subjects responded to the final form. Complete subject responses are included in appendix F.
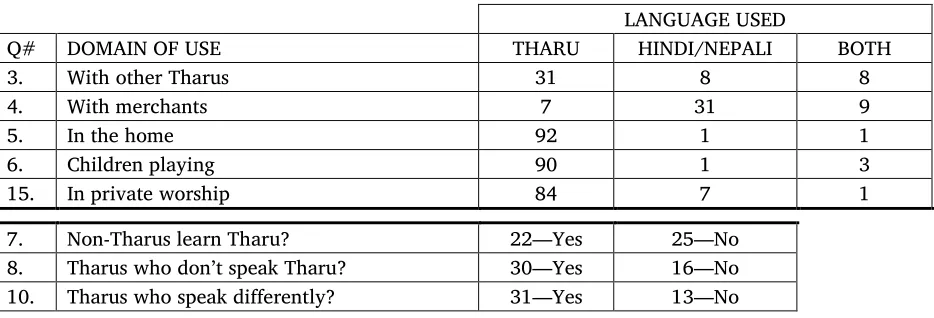
Table 11. Language use patterns
LANGUAGE USED
Q# DOMAIN OF USE THARU HINDI/NEPALI BOTH
3. With other Tharus 31 8 8
4. With merchants 7 31 9
5. In the home 92 1 1
6. Children playing 90 1 3
15. In private worship 84 7 1
7. Non-Tharus learn Tharu? 22—Yes 25—No
8. Tharus who don’t speak Tharu? 30—Yes 16—No
10. Tharus who speak differently? 31—Yes 13—No
These results show that Tharu is strongly used in the crucial domains of home and religion. Tharu is the language of in-group identification, the one with emotive appeal. The fact that children at play use Tharu almost exclusively suggests that it will remain a vital language for the youngest generation.
With outsiders such as merchants, Hindi is most commonly used because most merchants do not speak Tharu. With other Tharus, the language is used by most people, but 34 percent (16 of 47) responded that they sometimes used Hindi or Nepali.
Testifying to the vitality of the Tharu language, nearly half of the respondents knew of outsiders who had learned to speak Tharu. Counterbalancing this, however, about two-thirds of the respondents knew of Tharus who did not speak Tharu, primarily those who had moved to towns in Nainital District.
6.2.2 Language attitudes
Questions dealing with language attitudes revealed that, in general, attitudes are very positive towards the Tharu language (each person liking the local variety best). Likewise, attitudes towards the use of Hindi are positive.
It proved difficult to probe attitudes towards different varieties of Tharu, or of the perceived understanding of different varieties of Tharu, because in most cases people were not familiar with them.
Results from some of the individual language attitude questions are presented below.
14. Where is the sweetest Tharu spoken?
Own village Don’t know Other places
68 10 14
The majority, 74 percent, thought that the Tharu they spoke was the sweetest; no other specific place or area was mentioned by more than four people. Clearly, there is no recognized standard or prestigious variety of Tharu.
16. In what language should a mother speak to her young child? Tharu Hindi Both Don’t know
83 5 1 1
In question 16, 92 percent of respondents said that a mother should use Tharu when speaking to her child. This shows a very positive attitude toward the use of the mother tongue.
17. Should a child learn to speak Hindi?
Yes No
Speaking Hindi is seen as a very valuable asset; it is part of identification with the broader political unit and necessary for advancement.
18a. Would it be a good thing for books to be written in Tharu?
Yes No Don’t know
88 3 1
18b. Would it be a good thing for books to be written in Kathoriya Tharu?
Yes No Other
5 27 1
In question 18a, “Tharu” was equated with Rana Tharu. This is the variety that is assumed if clarification is not made. Attitudes are consistently positive towards the prospect of vernacular literature in Tharu. Towards the prospect of literature in Kathoriya Tharu, however, attitudes are largely negative. It seems probable that much of this negative attitude is rooted in the fact that most people think
Kathoriya Tharu is a variety unknown to them, when in fact they have just understood a text from Kathoriya. Kathoriya Tharu is largely unfamiliar to other Tharus, and so people have no basis from which to answer the question. There is no other evidence of negative attitudes towards Kathoriya Tharu or its speakers. Further study needs to be done to determine if negative attitudes exist which would likely be a hindrance to the acceptance of vernacular literature in Kathoriya Tharu.
19. Would you want your child (or you) to marry someone who spoke only Hindi?
Yes No Other
25 16 5
20. Would you want your child (or you) to marry someone who spoke only Tharu?
Yes No Other
35 7 2
Responses to questions 19 and 20 appear inconsistent and may be the result of mistakes in questioning. A majority responded that it is all right to marry someone who spoke only Hindi; a more substantial majority responded that it is also all right to marry someone who spoke only Tharu. Perhaps more significant is the fact that 35 percent responded that it would not be all right to marry someone who spoke only Hindi. This reflects a large segment of the population for whom maintenance of the mother tongue is still very important. Interestingly, one person who answered “yes” to question 19 said, “If they want to [marry a Hindi-speaking girl] we will teach her our language.”
24. Do you think children here will still be speaking Tharu in fifty years?
Yes No Maybe Don’t know
62 17 4 9
People’s perception of the future vitality of the language is largely positive: 67 percent think that children will still speak Tharu in fifty years. That nearly 20 percent of respondents answered negatively shows that many people are feeling that the Tharu language is threatened.
7 Recommendations
7.1 For literature development and literacy programs
varieties tested in the Western Indo-Nepal Tarai; and 4) lexically, Kathoriya Tharu is at the midpoint of a dialect chain, between the more divergent Rana and Dangora varieties.
In light of these findings, we recommend that any literature development be done in Kathoriya Tharu. Indications are that written materials done in Pavera village of Kailali District, Nepal (or a village that speaks this same dialect) would likely be adequately understood by all the Tharu varieties covered in this survey.
Literacy programs will also be needed in this same variety of Tharu. Reception of written Tharu materials should be tested among speakers of Rana Tharu and Dangora Tharu to determine their
acceptance before extensive literature development is done. Tharus easily recognize the other varieties of Tharu and may initially reject material in other varieties; promotion of the written form would play an important part in a literacy program.
7.2 For further survey
The biggest need for further survey lies east of Gonda District (Dang District in Nepal). The Kathoriya Tharu (KkP) RTT should be tested at selected points to determine how far this language variety reaches. The different Tharu varieties along the Nepal-India border east to the eastern border of Nepal need to be surveyed, and dialect centers determined.
In addition, it remains to be shown conclusively that Kathoriya Tharu is understood well among the Buksa and Rana of Nainital District. Testing of the KkP RTT should be done in BNM and RNS.
It will also be informative to test bilingualism in Nepali at representative points in Tharu
communities in West Nepal. In addition to this, it is recommended that Tharu varieties in north Kailali District and in Bardiya and Banke Districts of Nepal be compared with those found in this survey. The same holds true for the Tharu spoken in Basti District of India.
Before extensive literature development is begun, further language attitude studies are necessary to probe attitudes towards oral and written Kathoriya Tharu. If literature in this variety proves
24
Appendix A. International Phonetic Alphabet (IPA)
Consonants B ila b ia l La b iod en ta l D en ta l A lv eo la r P os ta lv eol ar A lv eo p ala ta l R et rof le x P ala ta l V ela r U vu la r P h ar yn ge al G lo tta l
Plosive p b t̪ d̪ t d ʈ ɖ c ɟ k g q ɢ ʔ
Nasal m ɱ n ɳ ɲ ŋ ɴ
Fric. ɸ β f v θ ð s z ʃ ʒ ɕ ʑ ʂ ʐ ç ʝ x ɣ χ ʁ ħ ʕ h ɦ Affric. pɸ bβ t̼s d̼z ts dz tʃ dʒ tɕ dʑ
Lateral l̺ l ɭ ʎ ʟ
Lat. Fric. ɬ ɮ
Flap ɾ ɽ
Trill ʙ r ʀ
Approx. w ʋ ɹ ɻ j ɰ
Consonant Diacritics
Aspirated ʰ tʰ Labialize ʷ tʷ Ejective ʼ tʼ Voiced ̬ t̬ Long ː tː Palatalized ʲ tʲ Unreleased ̚ t̚ Voiceless ̥ d̥
Vowels
Front Central Back
unrd. rd. unrd. rd. unrd. rd.
Close i y ɨ ʉ ɯ u
Near-close ɪ ʏ ʊ
Close-mid e ø ɘ ɵ ɤ o
Mid ə
Open-mid ɛ œ ɜ ɞ ʌ ɔ Near-open æ ɐ
Open a ɶ ɑ ɒ
Vowel Diacritics
25
Appendix B: Tharu Survey Word Lists
Details of Word Lists on Tharu Survey
Code Language Name Village Tehsil District Country Date
BNM Bhuksa Tharu Madinapur Gandepur Nainital India 09/09/92
BNT Bhuksa Tharu Thari Ram Nagar Nainital India 11/09/92
RNK Rana Tharu Sugia Khatima Nainital India 10/09/92
RNS Rana Tharu Sisaikhara Sitarganj Nainital India 09/09/92
RNS Rana Tharu Sisana Sitarganj Nainital India 15/09/92
RKM Rana Tharu Majhgam Kanchanpur Kanchanpur Nepal 17/09/92
RKB Rana Tharu Banghati Nighasan Kheri India 15/09/92
TkN Thakur Tharu Nai Basti Mahandranagar Kanchanpur Nepal 16/09/92
KkP Kathoria Tharu Pavera Pavera Kaila1i Nepal 06/10/92
SkP Sunha Tharu Piparia Mahandranagar Kanchanpur Nepal 16/09/92
DKS Dangora Tharu Sivratnapur Asuliya Kaila1i Nepal 17/09/92
DDK Dang Tharu Kothari Gobadilha Dang Nepal 29/09/92
DGC Dangora Tharu Chandanpur Tulsipar Gonda India 29/09/92
DkR Dangora Tharu Rajipur Kanchanpur Kanchanpur Nepal 11/09/92
CCC Chit Wan Tharu Chitwan Chitwan Chitwan Nepal 1978
HIN Standard Hindi
Code Age Sex Elicited by Place Checked Date
BNM 22 M M. G. D. Madinapur Yes 09/09/92
BNT 50 M M. G. D. Thari Yes 11/09/92
RNK 43 M N. L. Sugia Yes 10/09/92
RNS 18 M N. L. Si Saikhara Yes 09/09/92
RNS 40 M N. L. Sisana Yes 15/09/92
RKM 29 M N. L. Majhgam Yes 17/09/92
RKB 45 M M. G. D. Banghati Yes 15/09/92
TkN 30 M N. L. Palvera Yes 16/09/92
KkP 50 F M. G. D. Piparia Yes 06/10/92
SkP 30 M N. L. Sivratnapur Yes 16/09/92
DKS 26 M M. G. D. Barhani Yes 17/09/92
DDK 25 M N. L. Chandanpur Yes 29/09/92
DGC 23 M N. L. Mahandranagar Yes 29/09/92
DkR 19 M N. L. Yes 11/09/92
CCC Leals
Code Age Sex Elicited by
BNM -- F M. G. D.
BNT 35 M M. G. D.
RNK 20 M N. L.
RNS 21 M N. L.
RNS ? ? N. L.
RKM ? M M. G. D.
RKB 26 M N. L.
TkN ? ? N. L.
KkP ? M M. G. D.
SkP ? ? N. L.
DKS ? ? M. G. D.
DDK ? ? N. L.
DGC 16 M N. L.
DkR 29 M N. L.
CCC
HIN 26 M Jeff Webster
Word list data
1. body
HIN 1 ʃʌɾiɾ
RNS 1 ʃʌɾiɾ
RNK 1 ʃʌɾiɾ
BNM 1 ʃʌɾiɾ
SkP 1 ʃʌɾiɾ
TkN 1 ʃʌɾiɾ
RNS 1 ʃʌɾiɾ
RkM 1 ʃʌɾiɾ
RKB 1 ʃʌɾiɾ
BNT 1 ʃʌɾaɾ
BNM 2 batʌn
BNT 2 bʌdʌn
DGC 3 dẽh
RKB 3 deh
DKS 3 deh
KkP 3 deh
DkR 4 aŋ
DDK 4 aŋ
2. head
HIN 1 sɪɾ
BNM 1 sɪɾ
RNS 2 mʊɖ
RNK 2 mʊɖ
RNS 2 mʊɖ
BNM 2 muɖ
RKB 2 muɖ
TkN 2 muɖ
RkM 2 muɖ
DGC 2 muɖ
SkP 2 mʊɖɪja
DKS 2 mʊɖi
CCC 2 muːɖ
KkP 2 muɾija
DkR 3 kʌpaɾ
DDK 3 kʌpaɾ
DGC 3 kʌpaɾ
BNT 3 ɡʰopʌɖi
3. hair
HIN 1 bal
BNM 1 bal
BNT 1 bal
RNS 1 baɾ
RNK 1 baɾ
DGC 1 baɾ
SkP 1 baɾ
RKB 1 baɾ
TkN 1 baɾ
RNS 1 baɾ
RkM 1 baɾ
KkP 1 baɾ
DkR 2 bhuʈʌla
DKS 2 bhuʈʌla
DDK 2 bʰutla
CCC 3 keis
4. face
DGC 1 tʃehʌɾa
RNS 2 mo
BNM 2 mo
RKB 2 muh (used most)
RNK 2 muh
DGC 2 muh
DKS 2 muh
TkN 2 muh
HIN 2 mũh
DkR 2 mũh
BNT 2 mũh
DDK 2 mũh
SkP 2 mʊh
RNS 2 mʊh
RkM 2 moh
KkP 2 mũ
5. eye
HIN 1 aŋkʰ
BNM 1 aŋkʰ
DGC 1 aŋkʰ
DKS 1 aŋkʰ
TkN 1 aŋkʰ
BNT 1 aŋkʰ
DDK 1 aŋkʰ
KkP 1 aŋkʰ
RNS 1 aŋkʰi
RNK 1 aŋkʰi
DkR 1 aŋkʰi
RNS 1 aŋkʰi
SkP 1 akʰi
RKB 1 akʰi
RkM 1 ãŋkʰi
CCC 2 aiːkʰ
6. ear
HIN 1 kan
RNS 1 kan
RNK 1 kan
BNM 1 kan
DGC 1 kan
DkR 1 kan
SkP 1 kan
RKB 1 kan
TkN 1 kan
DKS 1 kan
BNT 1 kan
RNS 1 kan
RkM 1 kan
CCC 1 kan
DDK 1 kan
KkP 1 kan
7. nose
HIN 1 nak
RNS 1 nak
RNK 1 nak
BNM 1 nak
DkR 1 nak
SkP 1 nak
RKB 1 nak
TkN 1 nak
DKS 1 nak
BNT 1 nak
RNS 1 nak
RkM 1 nak
CCC 1 nak
DDK 1 nak
DGC 1 nak
KkP 1 nak
8. mouth
HIN 1 mũh
RNS 1 mũh
BNT 1 mũh (4)
DkR 1 mũh (4)
DDK 1 mũh (4)
BNM 1 moh (4)
RkM 1 moh (4)
SkP 1 mʊh (4)
RNS 1 mʊh (4)
RKB 1 muh (4)
TkN 1 muh (4)
DKS 1 muh (4)
RNK 1 muh (4)
CCC 1 muːhʌ
DGC 1 mʊh
KkP 1 mũ (4)
9. teeth
HIN 1 dãnt
RNS 1 dãnt
RNK 1 dãnt
DGC 1 dãnt
DkR 1 dãnt
RKB 1 dãnt
DKS 1 dãnt
BNT 1 dãnt
RNS 1 dãnt
DDK 1 dãnt
KkP 1 dãnt
BNM 1 dand
SkP 1 daːt
TkN 1 daːt
RkM 1 daːt
10. tongue
HIN 1 dʒibʰ
RNS 1 dʒibʰ
RNK 1 dʒibʰ
BNM 1 dʒibʰ
DkR 1 dʒibʰ
SkP 1 dʒibʰ
RKB 1 dʒibʰ
TkN 1 dʒibʰ
DKS 1 dʒibʰ
BNT 1 dʒibʰ
RNS 1 dʒibʰ
RkM 1 dʒibʰ
DDK 1 dʒibʰ
DGC 1 dʒibʰ
KkP 1 dʒibʰ
CCC 1 dʒibʰi
11. breast
HIN 1 stʌn
RNS 2 tʃutʃi RNK 2 tʃutʃi RNS 2 tʃutʃi
BNM 2 tʃutʃ
BNT 2 tʃutʃ
SkP 3 dudʰ
RKB 3 dudʰ
DkR 3 dudʰ
TkN 3 dudʰ
RNS 3 dudʰ
DGC 3 dudʰ
KkP 3 dudʰ
DKS 3 dʊʈ
DDK 3 ɖuɖʰ
CCC 4 dudʰaktʃʰaʈi HIN 5 tʃʰati RNS 5 tʃutʃi RNK 5 tʃutʃi RNS 5 tʃutʃi 12. belly
HIN 1 peʈ
RNS 1 peʈ
RNK 1 peʈ
BNM 1 peʈ
DGC 1 peʈ
DkR 1 peʈ
RKB 1 peʈ
TkN 1 peʈ
DKS 1 peʈ
BNT 1 peʈ
RNS 1 peʈ
RkM 1 peʈ
SkP 1 pjaʈ
DDK 1 pjeʈ
CCC 1 peit
KkP 1 peʈʰ
13. arm
HIN 1 bãh
DkR 1 bãh
RNS 1 bãh
CCC 1 bahiː
HIN 2 haʈʰ
RNS 2 haʈʰ
RNK 2 haʈʰ
DGC 2 haʈʰ
DkR 2 haʈʰ
DDK 2 haʈʰ
DKS 2 haʈʰ
RKB 2 haʈʰ
KkP 2 haʈʰ
RNS 2 haʈʰ
TkN 2 hatʰ
RkM 2 hatʰ
BNM 3 pãtʃa
DKS 3 pãtʃa
BNT 3 pãtʃa
SkP 4 kohʌni
14. elbow
HIN 1 kʊhʌni
BNM 1 kʊhʌni
RNS 1 kahʌni
HIN 1 kohʌni
RNK 1 kohʌni
RKB 1 kohʌni
TkN 1 kohʌni
RkM 1 kohʌni
RNS 1 kohʌni
BNT 1 koni
CCC 1 kehuni
KkP