Colleges Differ between Academic
and Vocational Programs?
Andrew M. Gill
Duane E. Leigh
a b s t r a c t
This paper provides new evidence about the payoffs to community col-leges’ terminal training programs as distinct from their traditional trans-fer function. Using NLSY data, we oftrans-fer three main findings. First, four-year college graduates who started at a community college are not at a substantial earnings disadvantage relative to those who started at a four-year college. Second, community college students in terminal training pro-grams enjoy a positive payoff comparable to that received by four-year college starters who do not graduate. Finally, we find evidence of positive self-selection for community college students who choose the terminal training track.
I. Introduction
Community colleges have two main roles. Traditionally, they have provided what Kane and Rouse (1999) term the ‘‘transfer function.’’ That is, commu-nity college students complete two years of a general undergraduate education, some-times receive an associate degree, and then transfer (if they have the interest and capability) to a four-year college to complete a bachelor’s degree. More recently, community colleges have evolved into a second role as the primary institutional supplier of adult training services. Adult training services include terminal vocational training programs, remedial education, and ‘‘customized’’ or ‘‘contract’’ courses
Andrew M. Gill is a professor of economics at California State University, Fullerton. Duane E. Leigh is a professor of economics at Washington State University, Pullman The authors gratefully acknowl-edge the helpful comments of Ted Bird, Michael Hilmer, Audrey Light, Steve Perez, Lakshmi Raut, Wayne Strayer, and Cindy Zoghi, as well as those of seminar and session participants at Cal State Ful-lerton and the 2001 meeting of the Society of Labor Economists. The data used in this article can be obtained beginning August 2003 through July 2006 from Andrew M. Gill, Department of Economics, California State University, Fullerton, Fullerton, CA 92834-6848 or agill@fullerton.edu.
[Submitted January 2001; accepted October 2001]
ISSN 022-166X2003 by the Board of Regents of the University of Wisconsin System
designed to meet the particular needs of local employers. Customized courses gener-ally provide either job-specific skill training or remedial training delivered to em-ployers on site. We apply the term ‘‘terminal training’’ to this heterogeneous mix of vocational and remedial courses.
A small but growing literature generally offers a positive view of the labor market payoffs to attending a community college. Nevertheless, the available evidence often does not distinguish between the payoff to the transfer function of community col-leges as opposed to their terminal training function. In addition, the literature does not adequately address the process that sorts students between alternative postsecondary education tracks.
This paper provides new evidence on the labor market payoffs to community college education making the distinction between the transfer and terminal training functions of community colleges. We are specifically interested in answering three questions:
1. Do four-year college graduates who begin at a two-year college and transfer suffer a labor market disadvantage relative to those who initially enrolled in a four-year institution?
2. How effective are community college terminal programs in boosting labor mar-ket earnings?
3. Does the principle of comparative advantage help to explain the sorting of community college students by transfer and terminal tracks?
The first two of these questions have immediate policy relevance. Question 1 is important in assessing whether policies of states including California and New York to limit enrollment at four-year colleges and encourage students to begin their studies at two-year colleges adversely affect the post-college earnings of those who eventu-ally earn bachelor’s degrees. In California, for example, the President of the Univer-sity of California system recently proposed a ‘‘dual admissions plan’’ that would grant provisional admission to a UC campus to students from less affluent high schools provided that they first successfully complete two years of community col-lege coursework (Weiss 2000).
Since community colleges offer a different curriculum mix than that offered by four-year colleges, Question 2 is relevant to state policy makers charged with the task of allocating scarce tax dollars between the two categories of higher educational institutions. In addition, this question applies to efforts to assess the importance of community college systems in state economic development efforts. Osterman and Batt (1993) provide a useful discussion for the states of North Carolina and South Carolina of the economic development role of community college workplace training programs designed to attract new employers while retaining existing employers.
importance of vocational training curriculums in community colleges leads us to question whether community college students who end up in terminal programs, rather than being somehow short-changed, are not appropriately pursuing their own self-interest given their tastes and abilities. Following the classic analysis of Willis and Rosen (1979), we pose Question 3 to establish whether there is evidence of selection bias caused by the sorting of community college students along the lines suggested by the theory of comparative advantage.
Our empirical analysis is based on a large sample of respondents drawn from the National Longitudinal Survey of Youth (NLSY) for whom we observe postsecondary school choices and subsequent labor market earnings.
II. Existing Evidence
In a widely cited study, Kane and Rouse (1995) analyze two major data sets to estimate the returns to both two-year and four-year colleges. Using data from the National Longitudinal Survey of the Class of 1972 (NLS-72), they find that the returns per year of college credits are quite similar for two-year and four-year colleges. Specifically, controlling for a variety of personal characteristics and whether or not a degree is earned, estimated wage effects for men range from 4 to 6 percent for every year of credits completed at either a two-year or a four-year college. Women’s returns are slightly higher at 6–8 percent for either type of college. Note that these estimated returns to two-year college credits do not differentiate between credits earned in transfer as opposed to terminal training programs.1
Using NLSY data, Kane and Rouse again report positive wage effects for both men and women who do not complete A.A. and B.A. degrees. Among men, for example, they find that those who attended a two-year college but did not complete an A.A. degree earned a wage premium of about 8 percent relative to terminal high school graduates. This 8 percent estimate compares favorably with returns of 9 per-cent for men who started at a two-year college and transferred to a four-year college and of 8 percent for men who started at a four-year college (with no degree in either case). Estimated wage effects jump to about 33 percent for both men and women with B.A. degrees. Also using NLSY data, Leigh and Gill (1997) report similar wage premiums of about 10 percent for men who attended either a two-year or a four-year college but did not earn a degree.
These results suggest that students who enroll in a community college, regardless of whether they choose a transfer or a terminal training program, enjoy about the same wage premiums as four-year college students, so long as a B.A. degree is not attained. However, there are two reasons for expecting that we do not yet have completely satisfactory answers to the three questions posed above. First, Kane and Rouse (1995) and Leigh and Gill (1997) use an educational hierarchy that categorizes people by their highest degree earned. This hierarchy effectively precludes them
from addressing Question 1 because they do not differentiate the returns to a B.A. degree for those who started at a community college and transferred versus those who started at a four-year college. Second, both studies fail to adequately model the choice between community college terminal and transfer programs making the estimates supplied not applicable to Question 3 and of limited usefulness to answer-ing Question 2.2
A recent paper by Hilmer (2000b) does differentiate the returns to a bachelor’s degree between those who started at two-year and four-year colleges. Using data from the Baccalaureate and Beyond (B&B) survey, his main result is that there is essentially no difference in entry-level wages of B.A. degree recipients who trans-ferred from a community college versus those who started at a four-year college. While reassuring to community college advocates, this result is of limited applicabil-ity to our Question 1 because the restriction of B&B data to B.A. degree recipients does not allow an analysis of the full range of postsecondary school options available to high school graduates. Moreover, Hilmer’s analysis is limited to wages at first post-college job.
Continuing to focus on Question 1, the community college literature leads us to expect that among bachelor’s degree holders, those who started at a two-year college might earn either larger or smaller labor market returns than those available to indi-viduals who started at a four-year college. Returns to a B.A. degree may be lower for community college transfers for the very reasons that led them to enroll at a community college in the first place. Compared to those who started at a four-year college, Kane and Rouse (1999) and Hilmer (2000a, 2000b) describe that community college students are more likely to have poorer high school grades and standardized test scores, to come from families with fewer financial resources, to have no family tradition of attending college, and to attend less selective four-year colleges. Hilmer (2000a) also points out that community college transfers are less likely to major in high-wage fields such as engineering. It is worth noting that even if all of these potentially observable characteristics are the same, there still may be unobservable differences that work against community college transfers due to the break in the continuity of their academic experience.
On the other hand, the diversion effect hypothesized in the literature raises the possibility that community college transfer students might enjoy higher returns.3
From the perspective of critics, two-year college transfer students who successfully earn a B.A. may be viewed as ‘‘survivors’’ who possess the persistence and motiva-tion to overcome the adverse effects of starting at a community college. These
desir-2. Kane and Rouse (1995: 607–608) recognize the self-selection issue in the context of the decision to enroll in any postsecondary educational institution. They attempt to deal with this issue by including family background and ability measures as additional regressors, although they recognize that these variables may not capture all the relevant differences between college entrants and terminal high school graduates that lead to differences in mean earnings. In addition, in work not reported, they used distance of respondent’s high school from the closest two-year and four-year college as well as public college tuition levels in the state as instruments for college attendance. They conclude that their instrumental variable estimates are without much power. Leigh and Gill (1997) approach the self-selection issue by augmenting their wage regressions with variables (family background and measures of motivation) expected to influence choices of both postsecondary school enrollment and type of postsecondary school.
able but unobserved personal characteristics are likely to be rewarded in the labor market.
III. Empirical Model and Estimation Method
To answer the three questions posed in the Introduction, we require an empirical model that (1) yields estimates of the payoffs to various degrees and educational programs by postsecondary school track, and (2) corrects for selectivity bias when individuals sort themselves between alternative tracks. The potential for selectivity bias arises when unobservable variables determining postsecondary school tracks (for example, academic motivation) are correlated with unobservable characteristics determining earnings. A simple model that meets these criteria is the two-equation framework outlined by Willis and Rosen (1979). The first equation describes the individual as choosing, among alternative postsecondary school tracks, that particular track that maximizes lifetime earnings. That is, the maximum utility attainable by individual i if he or she chooses track j is written as
(1) Vij⫽Ziγj⫹uij,j⫽1, . . . , 4
whereZiis a vector of exogenous variables, anduijis a random error term. Willis
and Rosen include in the Z vector measures of ability, financial constraints, and tastes. We add to these variables the individual’s gender and race/ethnicity. Because of our emphasis on the two distinct roles of community colleges, high school gradu-ates are presumed to choose among four alternative tracks: no college, start at a four-year college, enroll in a community college terminal training program, and enroll in a community college transfer program. Enrollment in a four-year college or in either of the community college tracks gives the individual the option of ultimately earning a college degree (typically an A.A. or B.A.).
The second equation in the Willis-Rosen framework describes the individual’s post-school labor market earnings potential. Given the choice of the jth postsecond-ary school track, the earnings of the ith worker may be written as
(2) lnWij⫽Xijβj⫹vij,j⫽1, . . . , 4
whereXijis a vector of exogenously determined variables, andvijis an error term. The
Xvector contains the ability, gender, and race/ethnicity measures that also appear in
Z. In addition, we follow Willis and Rosen by specifying the X vector to include variables that are presumably unknown at the time college enrollment decisions are made, including postsecondary school degrees earned and job characteristics.4
Willis and Rosen consider the dichotomous choice of going to college or not and estimate their selection equation using probit analysis. Since ours is a polychotomous choice model, we utilize the generalized method presented in Lee (1983). This esti-mation method is used by Trost and Lee (1984), Gyourko and Tracy (1988), and Brewer, Eide, and Ehrenberg (1999) to estimate labor market payoffs to the choices of technical school training, of labor market sector of employment, and of types of four-year colleges, respectively. Without going into the details provided by Lee, the appropriate wage regression specification, conditional on track j being chosen, can be written as
(3) lnWij ⫽Xijβj⫺σjρjλij⫹ξij,j⫽1, . . . ,4
whereσjis the standard deviation ofvij,ρjis the correlation coefficient betweenuij
andvij,λijis a selectivity correction variable, andξijis an error term. The model is
estimated in two stages. We first estimate the multinomial choice model given by Equation 1 with the maximum likelihood logit method. The resulting estimates of the fourγjvectors are used to construct a value ofλijfor each individual and each
track. In the second stage, Equation 3 is estimated to obtain selectivity-corrected estimates of the payoffs to alternative postsecondary educational outcomes.
IV. The Data
The NLSY began in 1979 with a sample of 12,686 respondents be-tween the ages of 14 and 22. Respondents were reinterviewed annually through 1994 and biannually thereafter. We follow NLSY respondents over an 18-year period be-tween 1979 and 1996 to insure that we capture the decision to go back to school, often at a community college, made by working adults.5By 1996, NLSY respondents
are in their thirties. The framework specified in Equations 1 and 2 is implemented by taking advantage of the richness of NLSY data to obtain measures of individuals’ ability and the financial constraints they face, and we use NLSY information on educational aspirations as a measure of tastes for education. These measures are summarized in Table 1.
Individuals included in our sample must satisfy three main restrictions. First, as of the 1996 interview they must not be enrolled in school. Second, they must be working but not self-employed in 1996. Third, they must report a 1996 wage rate between $2.00 and $120 in 1996 dollars. These restrictions result in a sample of 4,578 individuals.6
For this sample, we develop the four mutually exclusive postsecondary education tracks described in Section III and shown in Table 1. The following steps were followed in implementing this classification scheme:
5. Leigh and Gill (1997) emphasize that returning adult students are much more likely to return to commu-nity colleges than to four-year institutions.
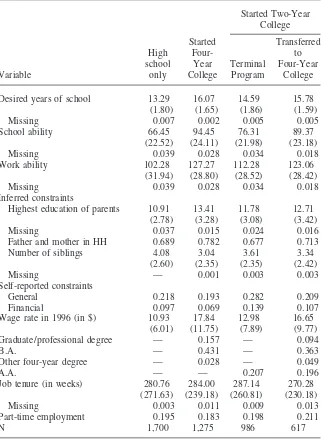
Table 1
Means of Key Explanatory Variables and Wage Rates, by Postsecondary School Track (standard deviations in parentheses)
Started Two-Year College
Started Transferred
High Four- to
school Year Terminal Four-Year
Variable only College Program College
Desired years of school 13.29 16.07 14.59 15.78
(1.80) (1.65) (1.86) (1.59)
Missing 0.007 0.002 0.005 0.005
School ability 66.45 94.45 76.31 89.37
(22.52) (24.11) (21.98) (23.18)
Missing 0.039 0.028 0.034 0.018
Work ability 102.28 127.27 112.28 123.06
(31.94) (28.80) (28.52) (28.42)
Missing 0.039 0.028 0.034 0.018
Inferred constraints
Highest education of parents 10.91 13.41 11.78 12.71
(2.78) (3.28) (3.08) (3.42)
Missing 0.037 0.015 0.024 0.016
Father and mother in HH 0.689 0.782 0.677 0.713
Number of siblings 4.08 3.04 3.61 3.34
(2.60) (2.35) (2.35) (2.42)
Missing — 0.001 0.003 0.003
Self-reported constraints
General 0.218 0.193 0.282 0.209
Financial 0.097 0.069 0.139 0.107
Wage rate in 1996 (in $) 10.93 17.84 12.98 16.65
(6.01) (11.75) (7.89) (9.77)
Graduate/professional degree — 0.157 — 0.094
B.A. — 0.431 — 0.363
Other four-year degree — 0.028 — 0.049
A.A. — — 0.207 0.196
Job tenure (in weeks) 280.76 284.00 287.14 270.28
(271.63) (239.18) (260.81) (230.18)
Missing 0.003 0.011 0.009 0.013
Part-time employment 0.195 0.183 0.198 0.211
1. Using the question posed in each wave of the data on most recent college attended, we determine if the respondent ever attended a two-year or four-year college.
2. If the respondent never attended a two-year or four-year college and his or her highest degree is a high school diploma, then we classify the respondent in the high school only category.
3. If the respondent did ever attend a four-year college but did not ever attend a two-year college, then he or she is classified in the started four-year college category.
4. Among respondents who started at a two-year college, finally, we make the transfer/terminal distinction by going back to 1979 and then working for-ward survey by survey to find the first survey in which a respondent indicated attendance at a two-year college. Then we checked subsequent surveys to see if the same respondent reported attendance at a four-year college. If attendance at a two-year college is followed by a report of attendance at a four-year college, the individual is treated as a community college transfer. If not, he or she is included in the terminal program category.
Two aspects of this classification scheme are worth noting. First, respondents who started at a four-year college and moved to a two-year college are not included in our data set. We impose this restriction because the focus of our analysis is on the transfer function of community colleges.
The second of these aspects requires more discussion.7While the conceptual
defi-nition of terminal programs sketched in the Introduction is limited to students en-rolled in vocational training and remedial education courses, our empirical definition specified in Step 4 takes in all community college students who do not transfer. To illustrate the distinction between these two definitions, consider an individual who enrolls in a community college with the intention of pursuing an academic program and transferring to a four-year college. Suppose, however, that poor grades during the first year of college lead to a downward revision of his or her educational aspira-tions and the decision to leave school and enter the labor market. Empirically, we would treat this person as completing a community college terminal program; whereas he or she actually enrolled in a transfer program. This means that we esti-mate the labor market payoffs to the alternative community college tracks ultiesti-mately selected. Hence, our estimates of the payoff to community college terminal programs may include the payoff to academic coursework for the unknown number of students who planned to transfer but finally opted not to. Likewise, our estimates of the payoff to transfer programs may include the payoff to vocational training for students who planned to complete a terminal program but wound up transferring.
This potential limitation of our data may not present a serious problem. Table 1 shows means of available measures of educational aspirations, ability, and financial constraints. Differences in these means across tracks, coupled with estimates reported
later in Table 2, suggest that our empirical measures of alternative postsecondary school tracks may indeed closely capture our conceptual definitions.
Educational aspirations are measured by years of school respondents report they would like to complete based on questions asked in the 1979, 1981, and 1982 NLSY surveys.8Levels of desired schooling are consistent with observed choices of
post-secondary education tracks in Table 1. For community college enrollees, in particu-lar, those electing a transfer program report educational aspirations that are 1.2 years higher than the desired level of those pursuing a terminal program. By comparison, desired years of schooling of four-year college starters exceeds that of community college transfer students by only 0.3 of a year.
Individual ability is measured by the Armed Services Vocational Aptitude Battery (ASVAB) test. Following Light (2001), we use scores on the 10 components of the test to construct measures of ‘‘school ability’’ and ‘‘work ability.’’ School ability is the sum of raw scores for the general science, arithmetic reasoning, word knowledge, paragraph comprehension, and mathematics knowledge tests. Work ability is the sum of raw scores for the numerical operations, coding speed, auto and shop information, mechanical comprehension, and electronics information tests. School ability levels of both categories of community college enrollees are clearly higher in Table 1 than those shown for the high school-only track, with the average score of two-year col-lege transfers falling only slightly below that of four-year colcol-lege starters. Unexpect-edly, the same ordering by postsecondary schooling track appears for work ability scores.
NLSY data permit two approaches to measuring financial constraints. The first, which we term ‘‘inferred constraints,’’ follows Willis and Rosen (1979) and the authors of many subsequent studies in utilizing measures of family background to infer the presence of a financial constraint. Our family background variables are highest grade in school completed by father or mother, presence of both parents in the home, and number of siblings in the family. Compared to individuals who started at four-year colleges, community college transfers are seen in Table 1 to have less educated parents. Transfer students are also more likely to come from larger families and from single-parent homes. Between community college transfer and terminal tracks, terminal program students are more likely to be raised in homes in which parents possess less schooling, family size is larger, and only a single parent is present.
Our second approach to measuring financial constraints compares the information respondents provide in the 1979, 1981, and 1982 surveys on years of school they would like to complete (our desired education variable) with years of school they expect to actually complete. We assume that in instances in which desired years exceed expected years a barrier is present that prevents attainment of the desired level of schooling. We define a dummy variable termed ‘‘general constraint’’ to capture the presence of such a self-reported barrier. In the 1982 survey, in addition, respondents for whom desired education exceeds expected education were asked the reason for this discrepancy. Six reasons are distinguished in the data, with ‘‘eco-nomic, financial reasons’’ being by far the most common. A dummy variable labeled
‘‘financial constraint’’ is specified to represent a self-reported desired/expected dis-crepancy in years of schooling caused by economic or financial reasons. In Table 1, community college students enrolled in terminal programs appear to face more binding self-reported constraints than community college transfer students, while transfer students report themselves as being more constrained than those who started at a four-year college.
Also shown in Table 1 are mean 1996 wage rates and postsecondary education degrees. The table indicates that wages for each of the two categories of community college students lie between those calculated for respondents in the started four-year college and high school-only categories. The $1.19 per hour differential favoring four-year college starters over community college transfer is consistent with, among other reasons, the somewhat higher incidence of B.A. and graduate/professional de-grees among four-year college starters. Community college students enrolled in a terminal program earn $2.05 per hour more than high school-only respondents, but $3.67 per hour less than community college transfers. At about 20 percent, the inci-dence of A.A. degrees for both community college tracks is consistent with Hilmer’s (2000b) finding that only about one-quarter of community college transfer students in the B&B survey completed an A.A. degree.
The final two rows of Table 1 present cross-tabulations by postsecondary school-ing track of two job characteristics—job tenure and part-time employment—in-cluded in the wage equations but omitted from the school choice equation. Job tenure displays little variation across postsecondary school tracks with means ranging be-tween 5.2 and 5.5 years. Large standard deviations indicate substantially more varia-tion in job tenure within tracks. The proporvaria-tion of respondents working part-time is essentially unchanged at about 20 percent across school tracks.
V. Results
As noted in Section III, we adopt Willis and Rosen’s (1979) empirical strategy of estimating both a postsecondary school track equation and a set of wage equations, including selectivity terms, that are differentiated by postsecondary school track chosen. We then use the wage equation estimates to calculate predicted wage levels and wage differentials that provide answers to the three questions posed in the Introduction.
A. Postsecondary School Tracks
Our first task in this section is to demonstrate that we have a useful empirical model for explaining postsecondary school choices. Reported in Table 2 are estimated mar-ginal effects of our measures of ability, educational aspirations, and financial con-straints, plus gender and race/ethnicity, on the probability of choosing each postsec-ondary school track. These marginal effects are obtained from maximum likelihood coefficient estimates of a multinomial logit model.
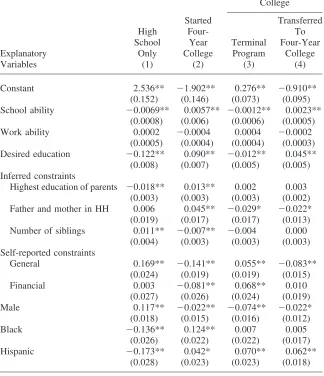
neces-Table 2
Estimated Marginal Effects of Explanatory Variables on the Probability of Alternative Postsecondary Education Tracks (standard errors in parentheses)
Started Two-Year College
Started Transferred
High Four- To
School Year Terminal Four-Year
Explanatory Only College Program College
Variables (1) (2) (3) (4)
Constant 2.536** ⫺1.902** 0.276** ⫺0.910**
(0.152) (0.146) (0.073) (0.095)
School ability ⫺0.0069** 0.0057** ⫺0.0012** 0.0023**
(0.0008) (0.006) (0.0006) (0.0005)
Work ability 0.0002 ⫺0.0004 0.0004 ⫺0.0002
(0.0005) (0.0004) (0.0004) (0.0003)
Desired education ⫺0.122** 0.090** ⫺0.012** 0.045**
(0.008) (0.007) (0.005) (0.005)
Inferred constraints
Highest education of parents ⫺0.018** 0.013** 0.002 0.003
(0.003) (0.003) (0.003) (0.002)
Father and mother in HH 0.006 0.045** ⫺0.029* ⫺0.022*
(0.019) (0.017) (0.017) (0.013)
Number of siblings 0.011** ⫺0.007** ⫺0.004 0.000
(0.004) (0.003) (0.003) (0.003)
Self-reported constraints
General 0.169** ⫺0.141** 0.055** ⫺0.083**
(0.024) (0.019) (0.019) (0.015)
Financial 0.003 ⫺0.081** 0.068** 0.010
(0.027) (0.026) (0.024) (0.019)
Male 0.117** ⫺0.022** ⫺0.074** ⫺0.022*
(0.018) (0.015) (0.016) (0.012)
Black ⫺0.136** 0.124** 0.007 0.005
(0.026) (0.022) (0.022) (0.017)
Hispanic ⫺0.173** 0.042* 0.070** 0.062**
(0.028) (0.023) (0.023) (0.018)
sarily work ability) are more likely to start at a four-year college than to attend a community college. Higher educational aspirations also increase the probability of starting at a four-year college. In addition, the presence of a financial constraint as measured by either our inferred constraint or self-reported constraint variables has a stronger negative effect on the probability of starting at a four-year college than on the probability of attending a two-year college.
We are especially interested in the ability of our model to accurately describe the sorting of community college students between the transfer and terminal training tracks. Rouse (1995) argues persuasively that information on years of desired school-ing (that is, a preference for terminal versus transfer programs) is essential to properly identify the effect of community college enrollment on ultimate educational attain-ment. Columns 3 and 4 of Table 2 show that an increase in desired years of schooling raises the probability of a community college student choosing the transfer track while decreasing the probability of selecting terminal training.
In addition, we expect school ability to be positively related to the choice of trans-fer as opposed to terminal programs; while the presence of a financial constraint is expected to increase the probability of choosing a terminal as opposed to a transfer program. Columns 3 and 4 of Table 2 indeed indicate the expected positive and negative effects, respectively, of school ability on choice of transfer and terminal tracks. Among the two sets of financial constraint variables, Table 2 suggests that the inferred constraint measures are less effective in distinguishing between community college tracks than they are in affecting the choice between starting at a two-year or four-year college. However, estimates reported in Columns 3 and 4 for the self-reported constraint measures indicate that the presence of a constraint influences the choice between community college terminal and transfer programs as well as the two-year/four-year college decision.
In summary, differences in means shown in Table 1 and the pattern of coefficients reported in Table 2 match up well with our a priori expectations regarding the effects of ability, preferences, and financial constraints on the choice between two-year ter-minal and transfer programs. This gives us confidence that the terter-minal/transfer dis-tinction allowed by our data reflects reasonably well community college students’ enrollment decisions.
B. Effects on Wages
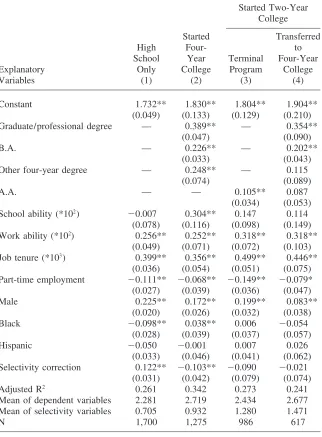
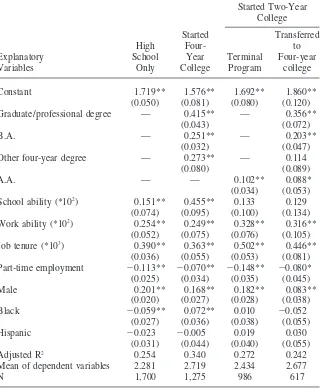
Shown in Table 3 are selectivity-corrected estimates of wage equations estimated separately for each postsecondary schooling track. Among the postsecondary educa-tion coefficients, the incremental effect of a B.A. degree is seen to be somewhat larger for individuals who started at a four-year college than for those who transferred from a community college. Selectivity-corrected estimates on B.A. degree are 0.226 and 0.202, respectively, for starters at four-year colleges and two-year college trans-fers. These estimates are close to the corresponding OLS estimates of 0.251 and 0.203 (OLS estimates are reported in an appendix table.) In general, the OLS and selectivity-corrected estimates are quite similar.
Table 3
Selectivity-Corrected Estimates of the Effect of Postsecondary Education and Selected Other Explanatory Variables on 1996 Wage Rates, by Postsecondary School Track (standard errors in parentheses)
Started Two-Year College
Started Transferred
High Four- to
School Year Terminal Four-Year
Explanatory Only College Program College
Variables (1) (2) (3) (4)
Constant 1.732** 1.830** 1.804** 1.904**
(0.049) (0.133) (0.129) (0.210)
Graduate/professional degree — 0.389** — 0.354**
(0.047) (0.090)
B.A. — 0.226** — 0.202**
(0.033) (0.043)
Other four-year degree — 0.248** — 0.115
(0.074) (0.089)
A.A. — — 0.105** 0.087
(0.034) (0.053) School ability (*102)
⫺0.007 0.304** 0.147 0.114
(0.078) (0.116) (0.098) (0.149)
Work ability (*102) 0.256** 0.252** 0.318** 0.318**
(0.049) (0.071) (0.072) (0.103)
Job tenure (*103) 0.399** 0.356** 0.499** 0.446**
(0.036) (0.054) (0.051) (0.075)
Part-time employment ⫺0.111** ⫺0.068** ⫺0.149** ⫺0.079*
(0.027) (0.039) (0.036) (0.047)
Male 0.225** 0.172** 0.199** 0.083**
(0.020) (0.026) (0.032) (0.038)
Black ⫺0.098** 0.038** 0.006 ⫺0.054
(0.028) (0.039) (0.037) (0.057)
Hispanic ⫺0.050 ⫺0.001 0.007 0.026
(0.033) (0.046) (0.041) (0.062)
Selectivity correction 0.122** ⫺0.103** ⫺0.090 ⫺0.021
(0.031) (0.042) (0.079) (0.074)
Adjusted R2 0.261 0.342 0.273 0.241
Mean of dependent variables 2.281 2.719 2.434 2.677
Mean of selectivity variables 0.705 0.932 1.280 1.471
N 1,700 1,275 986 617
is especially the case for the started four-year college and community college termi-nal program tracks. The second exception relates to school ability scores. In Columns 1 and 2 of Table 3, estimated coefficients on school ability are seen to be smaller in size and lower in statistical significance than corresponding OLS estimates. The reason is that OLS estimates confound the direct effect of school ability on wages with its indirect effect on choice of postsecondary school tracks. In contrast, selectiv-ity-corrected coefficient estimates for work ability, which is seen in Table 2 to have little impact on the selection process, are little changed from the corresponding OLS estimates.
The effect of sorting by postsecondary school tracks is indicated in Table 3 by the coefficient estimates on the selectivity variables. As described by Gyourko and Tracy (1988), the selection effect for each track is calculated by multiplying minus the selection coefficient times the mean of the selection variable. Since means of the selection variables are uniformly positive, the negative coefficient estimates ap-pearing in Columns 2–4 of Table 3 indicate that positive self-selection exists for four-year college starters and for individuals pursuing either of the two community college tracks. For example, an individual who started at a four-year college earns on average 0.0956 log points or 10.0 percent more in wages than an individual with identical observable characteristics drawn randomly from the population of high school graduates would be expected to earn, had he or she started at a four-year college.9Note that although neither of the selectivity coefficients in the community
college regressions is statistically significant at conventional levels, the coefficient estimate for terminal programs is similar in magnitude (although less precisely esti-mated) to that estimated for four-year college starters. Hence, the magnitude of the selectivity effect calculated for terminal programs (0.1151 log points) is large enough to be economically important.10 On the other hand, the selectivity coefficient for
transfer programs is small as well as being imprecisely estimated.
In contrast to the positive selectivity indicated for four-year and two-year college starters, evidence of negative selectivity is seen in Column 1 for terminal high school degree holders. Specifically, high school-only individuals are found to average 0.0860 log points or 8.2 percent less in wages than an ‘‘identical’’ randomly selected individual would be expected to earn, had he or she stopped with a high school diploma.11
9. LetdandDbe the selection effect expressed in logs and percentages, respectively. For four-year college starters, d⫽ ⫺(⫺0.1026)(0.9315) or 0.0956, where 0.9315 is the mean of the selectivity variable shown at the bottom of Column 2. ThenD⫽ed
⫺1 or 10.0 percent.
l0. Following Hamermesh (2000: 376), we use the term ‘‘economically important’’ in the sense of a large effect, albeit one that is statistically insignificant.
C. Predicted Wage Levels and Wage Differentials
Using the coefficient estimates displayed in Table 3, predicted wage levels and wage differentials appearing in Tables 4 and 5 are designed to answer the three questions posed in the Introduction. A key distinction made in these tables is between ‘‘condi-tional’’ and ‘‘uncondi‘‘condi-tional’’ predictions. In Table 4, for example, the unconditional wage level predictions correspond to the following conceptual experiment. From a sample of high school graduates, pick at random an individual with the same observ-able characteristics as those of the average sample member. Then predict the individ-ual’s wage rate as a college graduate, first as a four-year college starter and then as a community college transfer student. The predicted wage differential in this case reflects the varying returns to a given set of observed characteristics for four-year college starters compared to community college transfers.
The conditional wage level predictions correspond to a different conceptual exper-iment. In this case, we predict wages as a college graduate for two individuals, one with the mean observable characteristics of all high school graduates randomly cho-sen from the subsample of four-year college starters and the other with the same observable characteristics randomly chosen from the subsample of community col-lege transfers. The predicted wage differential in this case captures not only the varying returns to observed characteristics but also the varying returns to unobserved characteristics and/or the varying levels of unobserved characteristics, both of which can be inferred from the individuals’ choice of postsecondary school tracks. For example, if we observe an individual starting college at a four-year institution, we might infer that he or she possesses a relatively high level of or expected return to unobserved academic motivation. It is the presence of self-selection that drives a wedge between the unconditional and conditional predicted wage differentials. Gyourko and Tracy (1988) recommend reporting both unconditional and conditional differentials.
1. Returns to a B.A. Degree
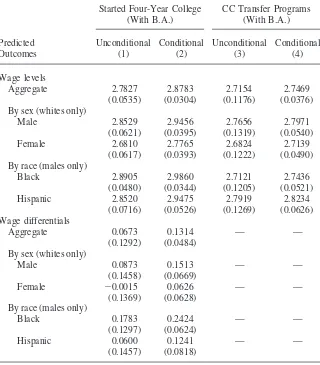
Question 1 asks whether, among B.A. degree holders, community college transfers are at an earnings disadvantage relative to those who started at a four-year college. A preponderance of positive predicted wage differentials in Table 4 suggests an affirmative answer to this question. At the same time, the table shows that the size and statistical significance of the predicted differentials depend on gender and race/ ethnicity and on the approach taken in calculating the predictions.
Table 4
Predicted Wage Levels and Wage Differentials for Holders of a B.A. Degree, Four-year College Starters Compared to Community College Transfers (standard errors in parentheses)
Started Four-Year College CC Transfer Programs
(With B.A.) (With B.A.)
Predicted Unconditional Conditional Unconditional Conditional
Outcomes (1) (2) (3) (4)
Wage levels
Aggregate 2.7827 2.8783 2.7154 2.7469
(0.0535) (0.0304) (0.1176) (0.0376)
By sex (whites only)
Male 2.8529 2.9456 2.7656 2.7971
(0.0621) (0.0395) (0.1319) (0.0540)
Female 2.6810 2.7765 2.6824 2.7139
(0.0617) (0.0393) (0.1222) (0.0490)
By race (males only)
Black 2.8905 2.9860 2.7121 2.7436
(0.0480) (0.0344) (0.1205) (0.0521)
Hispanic 2.8520 2.9475 2.7919 2.8234
(0.0716) (0.0526) (0.1269) (0.0626)
Wage differentials
Aggregate 0.0673 0.1314 — —
(0.1292) (0.0484) By sex (whites only)
Male 0.0873 0.1513 — —
(0.1458) (0.0669)
Female ⫺0.0015 0.0626 — —
(0.1369) (0.0628) By race (males only)
Black 0.1783 0.2424 — —
(0.1297) (0.0624)
Hispanic 0.0600 0.1241 — —
(0.1457) (0.0818)
The
Journal
of
Human
Resources
Table 5
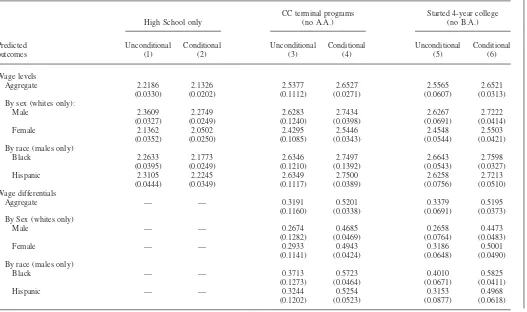
Predicted Wage Levels and Wage Differentials for Enrollees in degree Community College Terminal Programs and Non-degree Four-Year College Starters Compared to Terminal High School Graduates (standard errors in parentheses)
CC terminal programs Started 4-year college
High School only (no A.A.) (no B.A.)
Predicted Unconditional Conditional Unconditional Conditional Unconditional Conditional
outcomes (1) (2) (3) (4) (5) (6)
Wage levels
Aggregate 2.2186 2.1326 2.5377 2.6527 2.5565 2.6521
(0.0330) (0.0202) (0.1112) (0.0271) (0.0607) (0.0313)
By sex (whites only):
Male 2.3609 2.2749 2.6283 2.7434 2.6267 2.7222
(0.0327) (0.0249) (0.1240) (0.0398) (0.0691) (0.0414)
Female 2.1362 2.0502 2.4295 2.5446 2.4548 2.5503
(0.0352) (0.0250) (0.1085) (0.0343) (0.0544) (0.0421)
By race (males only)
Black 2.2633 2.1773 2.6346 2.7497 2.6643 2.7598
(0.0395) (0.0249) (0.1210) (0.1392) (0.0543) (0.0327)
Hispanic 2.3105 2.2245 2.6349 2.7500 2.6258 2.7213
(0.0444) (0.0349) (0.1117) (0.0389) (0.0756) (0.0510)
Wage differentials
Aggregate — — 0.3191 0.5201 0.3379 0.5195
(0.1160) (0.0338) (0.0691) (0.0373)
By Sex (whites only)
Male — — 0.2674 0.4685 0.2658 0.4473
(0.1282) (0.0469) (0.0764) (0.0483)
Female — — 0.2933 0.4943 0.3186 0.5001
(0.1141) (0.0424) (0.0648) (0.0490)
By race (males only)
Black — — 0.3713 0.5723 0.4010 0.5825
(0.1273) (0.0464) (0.0671) (0.0411)
Hispanic — — 0.3244 0.5254 0.3153 0.4968
(0.1202) (0.0523) (0.0877) (0.0618)
log points for black males. Only in the case of black males, however, does the uncon-ditional predicted differential exceed its estimated standard error.
As noted, conditional predicted wages include the effect of self-selection in choice of postsecondary school tracks. While positive self-selection is indicated in Table 3 for both four-year college starters and community college transfers, the coefficient on the transfer student selection variable is negligible in size. As a consequence of self-selection, the predicted wage level of four-year college starters is 0.0956 log points higher than would be expected given the observable characteristics of the average high school graduate in our sample. At the same time, the predicted wage of community college transfers is only 0.0315 log points higher than would be ex-pected. The difference of 0.0641 log points favoring four-year college starters is what makes the conditional wage differentials in Table 4 larger than the corresponding unconditional differentials. Note that larger predicted differentials and smaller stan-dard errors suggest wage differentials that are significantly different from zero for the fictional aggregate individual, white males, and black males. By way of comparison, Hilmer (2000b) reports conditional predicted wage differentials that tend to be posi-tive (typically 0.06 to 0.07 log points) but not statistically significant using data for wages on first job.
2. Payoff to Terminal Community College Programs
In response to Question 2, Table 5 provides evidence on the payoff to community college terminal training programs measured relative to the earnings prospects of terminal high school graduates. Predicted wage levels and wage differentials are again based on whole sample means, and we assume that terminal training pro-grams do not culminate in an A.A. degree. For the ‘‘aggregate’’ individual, our unconditional estimates in Column 3 suggest that enrollment in a community college terminal training program boosts earnings by 0.3191 log points, or by nearly 38 percent. Underlying this large and statistically significant differential are substantial differences, both favoring community college terminal training, in the returns to school ability and work ability. Among males, Hispanics and especially blacks ap-pear to benefit even more than whites from community college terminal training programs.
In our discussion of Table 3, we pointed to evidence of positive self-selection for community college terminal programs and of negative selectivity for the high school-only track. This evidence ensures that conditional predicted wage differentials in Column 4 will exceed corresponding unconditional wage differentials in Column 3. The wedge between the two is 0.2010 log points. Hence, the predicted wage differen-tial shown for the ‘‘aggregate’’ individual rises from an unconditional estimate of 0.3191 log points to a conditional estimate of 0.5201 log points.
wage differentials for white males increase to 0.4685 log points and 0.4473 log points, respectively, for these two postsecondary school tracks. Evidence that the payoff to community college terminal training programs is sizeable and similar in magnitude to that for attending a four-year college strongly supports earlier results, not corrected for self-selection, provided by Kane and Rouse (1995) and Leigh and Gill (1997).
3. Evidence on Sorting Among Community College Students
Evidence needed to answer Question 3 is found in our estimates of self-selection for community college terminal and transfer programs. As noted earlier, while the selectivity correction coefficients for both community college tracks are not statisti-cally significant, the magnitude of the coefficient in the terminal equation is suffi-ciently large to make the self-selection effect of economic interest. We calculate the self-selection effect to be 0.1151, log points for individuals who pursue a terminal training program as opposed to 0.0315 log points for those who enroll in transfer programs.
To put these self-selection effects in perspective, compare for the ‘‘aggregate’’ individual predicted wage levels for community college transfer programs (without B.A. degree) in Table 4 with predicted wage levels for terminal programs (without A.A. degree) in Table 5. Begin with the unconditional estimates shown in Column 3 of both tables. Standardizing for personal characteristics, the wage levels predicted for transfer and terminal programs are 2.7154 and 2.5377, respectively, yielding a predicted wage differential favoring transfers of 0.1777.12Turning to the conditional
predictions in Column 4 of both tables, predicted wage levels for the aggregate indi-vidual increase for both programs, but because of the larger self-selection effect the increase is greater for the terminal track. Hence, the predicted conditional wage differential falls to 0.0942 (⫽2.7469⫺2.6527). In other words, self-selection alone reduces by nearly one-half the predicted earnings differential favoring community college transfers over those enrolled in terminal programs.
V. Conclusions
Relatively little attention has been paid in the literature to differenti-ating the payoffs to community colleges’ terminal training programs from their tradi-tional transfer function. Using NLSY data, this paper provides new evidence on the payoffs to these two types of community college curriculums. Three specific ques-tions are posed. (1) Do four-year college graduates who begin at two-year colleges suffer a labor market disadvantage relative to those who started at a four-year col-lege? (2) How effective are community college terminal training programs in boost-ing labor market earnboost-ings? (3) Do community college students appear to sort them-selves between the terminal training and transfer tracks according to the principle
of comparative advantage? To answer these questions, we provide both uncondi-tional and condiuncondi-tional wage level and wage differential predictions calculated for 1996 when respondents are in their thirties. The unconditional predictions capture differences in returns to the same set of observable characteristics; while the condi-tional predictions include, in addition, differences in the returns to and the levels of unobservable characteristics. The influence of unobservable variables is inferred from individuals’ choice of postsecondary school tracks.
While generally positive predicted wage differentials would seem to suggest an affirmative answer to Question 1, we find that the size and statistical significance of the wage differentials favoring four-year college starters hinges on demographic characteristics and on whether we focus on the conditional or unconditional pre-dictions. Evidence of positive self-selection for four-year college starters results in conditional predicted wage differentials that are distinctly positive and statisti-cally significant, at least for males. These conditional wage differentials range between 0.0626 log points for white females and 0.2424 log points for black males. Abstracting from self-selection, however, our unconditional predicted wage differentials are substantially smaller in size and are not statistically different from zero. State policy makers might reasonably ask the question, ‘‘How would a typical high school graduate in my state fare in the labor market as a four-year college graduate if he or she started at a community college rather than at a four-year col-lege?’’ The answer to this question provided by our unconditional predicted wage differentials is that policies encouraging students to begin their college careers at a community college appear to have little negative impact on ultimate labor market opportunities.
Turning to Question 2, evidence provided by Kane and Rouse (1995) and Leigh and Gill (1997) suggests a substantial payoff to community college terminal training programs. However, these studies do not adequately control for self-selection in the decision between postsecondary school tracks. The results presented here, which do control for self-selection, strongly support these earlier studies. In particular, our unconditional estimates indicate that enrollment in a community college terminal training program increases earnings by between 0.2674 log points (or 31.1 percent) for white males and 0.3713 log points (or 45.0 percent) for black males. These statis-tically significant estimates are nearly identical to results we obtain for individuals with the same demographic characteristics who start at a four-year college but do not graduate. Even larger conditional predicted wage differentials are obtained for the community college terminal track.
Table A1
OLS Estimates of the Effect of Postsecondary Education and Selected Other Explanatory Variables on 1996 Wage Rates, by Postsecondary School Track (standard errors in parentheses)
Started Two-Year College
Started Transferred
High Four- to
Explanatory School Year Terminal Four-year
Variables Only College Program college
Constant 1.719** 1.576** 1.692** 1.860**
(0.050) (0.081) (0.080) (0.120)
Graduate/professional degree — 0.415** — 0.356**
(0.043) (0.072)
B.A. — 0.251** — 0.203**
(0.032) (0.047)
Other four-year degree — 0.273** — 0.114
(0.080) (0.089)
A.A. — — 0.102** 0.088*
(0.034) (0.053)
School ability (*102) 0.151** 0.455** 0.133 0.129
(0.074) (0.095) (0.100) (0.134)
Work ability (*102) 0.254** 0.249** 0.328** 0.316**
(0.052) (0.075) (0.076) (0.105)
Job tenure (*103) 0.390** 0.363** 0.502** 0.446**
(0.036) (0.055) (0.053) (0.081)
Part-time employment ⫺0.113** ⫺0.070** ⫺0.148** ⫺0.080*
(0.025) (0.034) (0.035) (0.045)
Male 0.201** 0.168** 0.182** 0.083**
(0.020) (0.027) (0.028) (0.038)
Black ⫺0.059** 0.072** 0.010 ⫺0.052
(0.027) (0.036) (0.038) (0.055)
Hispanic ⫺0.023 ⫺0.005 0.019 0.030
(0.031) (0.044) (0.040) (0.055)
Adjusted R2 0.254 0.340 0.272 0.242
Mean of dependent variables 2.281 2.719 2.434 2.677
N 1,700 1,275 986 617
References
Brewer, Dominic J., Eric Eide, and Ronald G. Ehrenberg. 1999. ‘‘Does It Pay to Attend an
Elite Private College?’’Journal of Human Resources34(1):104–23.
Gyourko, Joseph, and Joseph Tracy. 1988. ‘‘An Analysis of Public- and Private-Sector
Wages Allowing for Endogenous Choices of both Government and Union Status.’’
Jour-nal of Labor Economics6(2):229–53.
Hamermesh, Daniel S. 2000. ‘‘The Craft of Labormetrics.’’Industrial and Labor Relations
Review53(3):353–80.
Hilmer, Michael J. 2000a. ‘‘Does the Return to University Quality Differ for Transfer
Stu-dents and Direct Attendees?’’Economics of Education Review19(1):47–61.
———. 2000b. ‘‘Is Two-Year College Attendance a Good Initial Investment for Students Who Persist to a Baccalaureate Degree?’’ Department of Economics, Brigham Young University. Mimeo.
Kane, Thomas, and Cecilia Rouse. 1995. ‘‘Labor Market Returns to Two- and Four-Year
College.’’American Economic Review85(3):600–14.
———. 1999. ‘‘The Community College: Educating Students at the Margin Between
Col-lege and Work.’’Journal of Economic Perspectives13(1):63–84.
Lee, Lung-Fei. 1983. ‘‘Generalized Econometric Models with Selectivity.’’Econometrica
51(2):507–12.
Leigh, Duane E., and Andrew M. Gill. 1997. ‘‘Labor Market Returns to Community
Col-leges: Evidence for Returning Adults.’’Journal of Human Resources32(2):334–53.
———. Forthcoming. ‘‘Do Community Colleges Really Divert Students from Earning
Bachelor’s Degrees?’’Economics of Education Review.
Light, Audrey. 2001. ‘‘In-School Work Experience and the Returns to Schooling.’’Journal
of Labor Economics19(l):65–93.
Light, Audrey, and Wayne Strayer. 2000. ‘‘Determinants of College Completion: School
Quality or Student Ability?’’Journal of Human Resources35(2):299–332.
Manski, Charles F., and David A. Wise. 1983.College Choice in America. Cambridge,
Massachusetts: Harvard University Press.
Osterman, Paul, and Rosemary Batt. 1993. ‘‘Employer-Centered Training for International
Competitiveness: Lessons from State Programs.’’Journal of Policy Analysis and
Man-agement12(3):456–77.
Rouse, Cecilia E. 1995. ‘‘Democratization or Diversion: The Effect of Community
Col-leges on Educational Attainment.’’Journal of Business and Economic Statistics13(2):
217–24.
———. 1998. ‘‘Do Two-Year Colleges Increase Overall Educational Attainment?
Evi-dence from the States.’’Journal of Policy Analysis and Management17(4):95–620.
Trost, Robert P., and Lung-Fei Lee. 1984. ‘‘Technical Training and Earnings: A
Polychoto-mous Choice Model with Selectivity.’’Review of Economics and Statistics66(1):151–
56.
Weiss, Kenneth R. 2000. ‘‘UC Chief Offers Plan to Boost Minority Enrollment.’’The Los
Angeles Times, September 21, p.1.
White, Halbert. 1980. ‘‘A Heteroskedasticity-Consistent Covariance Matrix Estimator and a
Direct Test for Heteroskedasticity.’’Econometrica48(3):817–38.
Willis, Robert J., and Sherwin Rosen. 1979. ‘‘Education and Self-Selection.’’Journal of