on Academic Achievement
Evidence from Indonesia
David Newhouse
Kathleen Beegle
a b s t r a c t
Using Indonesian data, this paper evaluates the impact of school type on the academic achievement of junior secondary school students (grades 7-9). Public school graduates, after controlling for a wide variety of characteris-tics, score 0.17 to 0.3 standard deviations higher on the national exit exam than their privately schooled peers. This finding is robust to OLS, fixed-effects, and instrumental variable estimation strategies. Students attending Muslim private schools, including Madrassahs, fare no worse on average than students attending secular private schools. Our results provide indirect evidence that higher-quality inputs at public junior secondary schools pro-mote higher test scores.
I. Introduction
The existing evidence on how the characteristics of schools in devel-oping economies, including whether they are publicly or privately administered, affect students’ acquisition of cognitive skills is surprisingly mixed. The effect of edu-cational policies in general on learning in developing countries is poorly understood; a recent survey on the topic conceded that “most of what has been learned has been
David Newhouse is a technical assistance advisor in the Fiscal Affairs Department of the International Monetary Fund. Kathleen Beegle is a senior economist in the Development Economics Research Group at the World Bank. The material and views expressed here are those of the authors and should not be attrib-uted to the IMF or the World Bank or their member countries. The authors thank Elizabeth King, Joe Newhouse, two anonymous referees, and participants of seminars at the World Bank Resident Mission in Jakarta, Minnesota Development Economics Conference, and Cornell University for useful comments. David Newhouse will assist any scholar in seeking access to these data between January 2007 and December 2010. He may be contacted at: International Monetary Fund, 700 19thStreet NW, Washington
DC 2043 Phone: 202-623-5682; E-mail: dnewhouse@imf.org. [Submitted February 2005; accepted November 2005]
ISSN 022-166X E-ISSN 1548-8004 © 2006 by the Board of Regents of the University of Wisconsin System
methodological” rather than substantive (Glewwe 2002). Better understanding of the effect of school characteristics on learning is important because public policy can influence the availability and quality of public schools, as well as the cost of private schools through vouchers and scholarships. As the first step toward understanding the determinants of student achievement in Indonesia, this paper focuses on how the type of school attended by junior secondary school students influences their academic achievement.
This study presents evidence that Indonesian public junior secondary schools are more effective than their private counterparts at imparting cognitive skills, as mea-sured by students’ scores on the national test administered upon completion of junior secondary school. We present a model in which households select a school type based on their wealth and preference for academic achievement, which raises the prospect of selection bias in empirical estimates of the effect of school type on test scores. Our empirical results, however, suggest that after controlling for a large number of house-hold characteristics, selection bias due to parental preference for achievement is small. OLS, fixed effects, and instrumental variables estimation methods indicate that public school students have exit scores that are 0.17 to 0.3 standard deviations higher than their privately schooled peers. We find no evidence that private schools are more effective than public schools at raising test scores.
We also examine the relative performance of Madrassah, Muslim non-Madrassah, secular, and other religious schools, and find two tiers of performance. Students attending public schools and the small number of students attending non-Muslim reli-gious private schools perform equally well, while students in secular and Muslim pri-vate schools each fare worse by the same magnitude. In general, existing studies show that public junior secondary schools appear to employ higher-quality inputs. Our results therefore provide indirect evidence that the higher quality of public school inputs promotes higher test scores. Future research will hopefully lead to a better understanding of why public schools outperform their private counterparts, by identi-fying the specific characteristics of schools that explain this disparity.
II. Background
Notwithstanding the Asian crisis in 1997–98, schooling in Indonesia has been characterized by rapid development since independence in 1945. Elementary school enrollment increased steadily since the early 1970s, when it was around 76 percent, to being nearly universal by 1995 (Ahuja and Filmer 1996). This was fueled by a major expansion of the availability of elementary schools in the early 1970s. While also increasing in this period, enrollment rates at the junior secondary (grades 7–9) and senior secondary (grades 10–12) levels remain at 75 to 80 percent. More recently, despite the Asian financial crisis that hit Indonesia in late 1997 and early 1998, enrollment rates at all levels were unchanged between 1997 and 2000 (Pradhan 2001; Strauss et al. 2004).
aimed at decentralizing decision-making in the education system, devolving authority from the centralized system to the district (kabupaten) level. Policymakers at the district level, in the presence of grant money, can benefit from studies that shed light on which school types are effective. (About 40 percent of junior secondary students are enrolled in private schools, of which there are several types.) In addition, a better understanding of the determinants of junior secondary school outcomes can also inform efforts to raise senior secondary enrollment levels, since these outcomes presumably influence contin-uation to and eventual gradcontin-uation from senior secondary schools.
The Indonesia context is interesting in that it is atypical of the general consensus in the literature that private schools are superior to public schools (see evidence on aca-demic performance in, for example, Angrist et al. 2002; Cox and Jimenez 1991; Evans and Schwab 1995; Jimenez, Lockheed, and Paqueo 1992; and Neal 1997). In Indonesia, evidence on inputs, as well as limited information on per-pupil expendi-tures, is consistent with longstanding perception that public schools are better. In terms of schooling inputs, Strauss et al. (2004) and Serrato and Melnick (1995) gen-erally point to higher-quality inputs in public schools. The teacher-student ratio is an exception, as it was about 44 percent lower in private junior secondary schools than in public schools, in both 1997 and 2000. However, textbooks tend to be more avail-able in public junior secondary schools than in private ones, including textbooks that are borrowed or provided at no cost. Also, the average faculty education at the junior secondary level is higher at public schools than private. At public schools, teachers are significantly less likely to have a second job. Finally, there is limited evidence that public secular junior secondary schools have higher funding per pupil (Asian Development Bank 1997).1 Until they were abolished in 1998, public school fees
were actually higherthan private fees on average. Unfortunately, further data regard-ing school financregard-ing are unavailable, makregard-ing it impossible to evaluate the cost-effectiveness of different school types. Overall, however, the weight of the evidence from past research indicates that public schools use higher-quality inputs.2
Although public schools appear to use better inputs, there is conflicting evidence as to whether these inputs translate into higher academic performance among students. One study from the early 1990s found that junior secondary students who attended public schools scored higher than their private school peers (World Bank 1998). However, that study did not address selection bias due to the nonrandom matching of students to schools. On the other hand, two more thorough studies conclude that after controlling for selection, private schools are more effective and better managed than
1. In our data, the median ratio of private to public school expenditures is near or slightly greater than one. This omits the public sector contribution that devotes resources to bothpublic and private schools (World Bank 1998), making it difficult to assess whether per-pupil spending is higher in public schools.
public schools. James, Suryahadi, and King (1996) find that, after controlling for exit-ing test scores, private elementary schools in Indonesia incur lower costs per pupil. They conclude that private management is more efficient at achieving academic qual-ity. A more recent study goes further and claims that students schooled at private sec-ular secondary schools enjoy a wage premium of 75 percent over their publicly schooled peers (Bedi and Garg 2000).
Unfortunately, neither of the two studies that find that private schooling is superior use a plausibly exogenous source of variation to identify the private school effect. James, Suryahadi, and King (1996) identify the effect of school type on expenditure using the religious and demographic composition of its subdistrict (kecamatan), meaning they assume that these subdistrict characteristics are orthogonal to schools’ per-pupil spending. Bedi and Garg’s finding that private schooling raises future adult earnings is based on the identifying assumption that an adult’s province of birth can be excluded from the wage equation. This assumes that province of birth is only cor-related with adult earnings through its effect on the probability of attending a public or private school. This assumption is violated if province of birth is correlated with other unobserved factors determining wages, such as personal connections and human-capital accumulation not attributable to school type. In results below, we find that province of junior high school attendance has a strong effect on school test scores, conditional on numerous covariates including school type, which suggests that this assumption is flawed.3
The implication of the Bedi and Garg study, namely that private secular senior sec-ondary schools provide a more valuable education than public senior secsec-ondary schools, is puzzling for two reasons. First, as noted above, public schools in Indonesia look stronger on observed inputs and are widely perceived to be superior to secular and Muslim private schools. Indeed, studies such as Bedi and Garg find that public and private Christian secondary schools attract observably stronger students. Second, some public schools in urban areas screen applicants based on the score of their national test following elementary school. Students at these schools benefit from a higher-scoring peer group. The positive effect of private administration would have to outweigh these peer effects, which appear to be important in other contexts (Hoxby 2000; Somers, Mcewan, and Wilms 2003).
III. Model
This section presents a simple model in which two countervailing sources of selection bias may occur. Because public secondary schools appear to be superior to private secondary schools in Indonesia, past work has focused on the potential for positive selection of the best students into public secondary schools (Bedi and Garg 2000). While the perceived higher quality of public schools is one source of bias, a second source derives from wealthier households’ preference for pri-vate schools, ceteris paribus.
Consider a two-period model in which a parent selects a school in Period 1. The parent’s utility function is assumed to be concave and increasing in each period’s con-sumption. The parent’s utility is also assumed to be an increasing function of nonaca-demic features of the school (such as its safety or proximity). In the second period, the child transfers an amount of income determined by the quality of their education, which is consumed by the parent. The parent also earns direct utility in proportion to the amount of the child’s transfer, according to their personal preference for academic and professional achievement. We assume the parent’s utility from the child’s attend-ing school jtakes the following simple functional form:4
(1) Uj=lnaY1-Pjk+dlnaY2+Tjk+vTj+cOj.
Ytrepresents the household income in period t, which is exogenous with respect to
school type. Pjis the tuition of school j, and δis the parent’s discount rate. Tj
repre-sents the student’s transfer to their parents at the end of Period 1, after attending school j. The amount of the transfer enters the parent’s utility function directly if σis
nonzero, reflecting the household’s valuation of academic achievement, net of income gains associated with that achievement. Finally, Ojrepresents other, nonacademic
characteristics of the school valued by parents, such as safety, religious affiliation, convenience, and discipline.
For simplicity, the student’s transfer in the second period (school outcome) is assumed to be a positive and linear function of three factors: the quality of the school (Qj), the parent’s income in Period 1 (Y1), and the effort and ability of the student of
the student (E).
(2) Tj=Qj+aY1+bE.
We assume that parents who have higher income will provide a household envi-ronment more conducive to learning and professional achievement, meaning that the parameter a is positive. We also assume that student effort and ability is positively related to the degree to which parents directly value academic performance (σ):
(3) E=dv+~,whered> .0
Finally, we assume for simplicity that σ, which measures a parent’s taste for
edu-cation, is positive and that household income Yt is greater than tuition Pj, for all
schools j.
Because public schools are generally considered to be superior on average to pri-vate schools in Indonesia, we assume that Qpub> Qpri. However, the set of schools
which a child can attend is typically constrained by the location of the household, and in some cases, by the child’s score on the national test for elementary school gradu-ates (the Ebtanas test score). These constraints, along with other nonacademic char-acteristics of the school Oj, may lead parents to choose a private school even if
higher-quality public schools exist. The child attends public school if the maximum utility of the set of public schools they can attend, U*pub, exceeds the maximum util-ity of the set of private schools they can attend U*pri.
The difference in utilities between the best available public school and the best
This model confirms the intuition that a parent that places higher value on educa-tion is more likely to send their child to public schools, which are assumed to be of higher average quality. Meanwhile, holding other factors constant, wealthier house-holds are more likely to send their children to private school. In the United States, where private schools are generally considered to be higher quality, wealthier, and more motivated students tend to select into private schools. In Indonesia, however, where in general public schools are considered to be of higher quality, the two sources of selection bias are of opposite sign. Thus, the direction and magnitude of bias in the OLS models is unknown, and depends on the relative strength of unmeasured wealth and unmeasured motivation in determining students’ choice of school and their test score.
IV. Data
The primary data source for this study is the three full rounds of the Indonesia Family Life Survey (IFLS1, IFLS2, and IFLS3). (See Frankenberg and Karoly 1995; Frankenberg and Thomas 2000; Strauss et al. 2004.) The first round of the survey sampled 7,200 households in 1993; subsequent surveys attempted to rein-terview these households and households to which previous household members had moved. The 1993 sample was drawn from 321 randomly selected villages, spread among 13 Indonesian provinces containing 83 percent of the country’s 200 million people. The 321 villages were selected from the sample frame of the 1993 SUSENAS, the national economic survey, and are located in 149 districts. The sample captures an impressive amount of Indonesia’s remarkable ethnic and geographic diversity.
We analyze the national Ebtanas test scores of former junior secondary school stu-dents. In Indonesia, students are evaluated at the end of the three main education lev-els (elementary, junior secondary, and senior secondary) on the basis of a national test.6Data on test scores at all three levels were collected in 1997 and 2000 from all
5. The proof is given in Appendix 1.
household members between the ages of 14 and 25. The survey also ascertained the type of school attended at each level.
This study utilizes data on the presence of public and private schools at the district level to identify the effect of school type on student’s test score.7District-level data
on the presence of schools come from the 1998 round of annual census of schools conducted by the Indonesian Ministry of Education. Eighty percent of the 42,000 sec-ondary schools in Indonesia responded to this survey. Unfortunately, because of a budgetary shortfall during the 1998 financial crisis, the education census does not contain any useful information about private schools, except for their private status and location. This information is used to construct both the total number of junior sec-ondary schools and the percentage of district junior secsec-ondary schools that are public in the district.
The sample consists of all students who reported, in either 1997 or 2000, taking the junior secondary school test between 1990 and 2000.8Of the 5,437 respondents that
reported taking the national junior secondary school exam between 1990 and 2000, 605 were dropped because they did not report scores from their junior secondary school test. 335 other respondents were dropped because they not report their ele-mentary school test score, which is a highly significant determinant of junior high test score. An additional 115 respondents were not included in the sample because they did not report the district of the junior secondary school they attended. The remaining full sample consists of 4,382 respondents. The 1,055 excluded respondents are slightly less likely to have well-educated mothers and fathers, and somewhat less likely to have attended public school. This suggests that attrition bias, if anything, might lead to a slight understatement of the positive effect of public schools on test score.
V. Empirical Framework
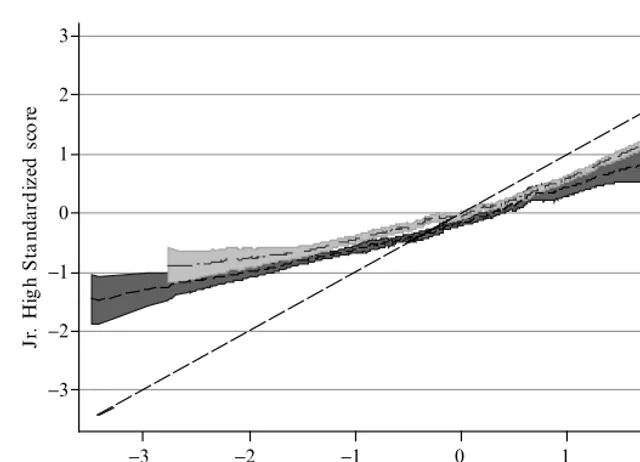
As a first step toward investigating how a student’s test score is affected by the type of junior secondary school, Figure 1 shows students’ test scores
in school leaving exams. The test items are collected nationally, and are not specific. Test items that are writ-ten by trained teachers and lecturers across the country are then reviewed and incorporated into the data bank. The junior secondary school test, which is calibrated and empirically validated, covers five subjects: Indonesia, Math, Social Studies, Science, and Moral Lessons from Pancasila (the national ideology). 7. There are 178 districts represented in the data. We chose to aggregate school availability measures at the district rather than the subdistrict level due to the small number of schools in certain subdistricts. In a previ-ous version of this paper, we also used a second measure of availability: The share of schools within 25 miles of the village center that are public. This measure was constructed from the data on the 321 original IFLS communities. For schools which were not interviewed directly in the IFLS facility survey, we inferred pub-lic or private status from the school name. The district and village level measures are moderately correlated, with a correlation coefficient of 0.33. However, the village-availability measure from the IFLS is only appli-cable to the subsample of students who were interviewed in the same subdistrict where they attended junior secondary school, which reduced the total sample by about 40 percent. Because limiting the sample to stu-dents who did not move after graduation caused selection bias, we only use the measures of access derived from the school census.
exiting junior secondary schools, smoothed against their test scores exiting elemen-tary school, separately for public and private junior secondary students. In Figure 1 and throughout the paper, students’ test scores are normalized to a mean of zero and a standard deviation of one, using the scores of other students that took the national test in the same year. The shaded regions indicate 95 percent confidence intervals. Conditional on elementary test scores, students at public junior secondary schools score higher upon exiting junior secondary school. Moreover, the difference in exit-ing test scores appears to be greatest for students at the tails of the elementary test score distribution.
To further probe this initial finding, we control for other observed child and family characteristics in a regression framework. Including control variables, however, requires making a tradeoff between the size of the sample and the availability of par-ticular household characteristics. Because test scores are provided retrospectively, many respondents first appeared in an IFLS household several years after their grad-uation from junior secondary school. For these respondents, time-varying household characteristics such as household consumption are not observed at the time they took the test. Excluding these time-varying household characteristics may confound esti-mates of the effect of junior secondary school type on test score. Therefore, we also present results for two subsamples. The junior secondary school sample consists of
Figure 1
Junior Secondary Test Score, Conditional on Elementary Test Score, for Public and Private School Students.
J
r.
H
ig
h S
ta
ndar
d
iz
ed
s
co
re
−3
−3 −2 −1 0 1 2 3
−2 −1 0 1 2 3
Elementary Standardized score
Private Public
2,733 respondents who were interviewed within a year of their junior secondary school graduation.9When this sample is used, the time-varying characteristics that are
measured within a year of taking the exam are included as control variables. The ele-mentary school sample consists of 1,948 students who are in the junior secondary school sample and were also interviewed in a previous round of the survey. For these respondents, time-varying characteristics such as household consumption are avail-able both before and after the student’s entry into junior secondary school. To obtain the OLS results, we estimate the (normalized) score, conditional on characteristics of the student and their household, as well as type of school attended at the junior sec-ondary level:
(7) Scorei=bsXi+cTi+fi
Where Xiis a vector of characteristics of student iand her household, which varies
slightly by the samples (discussed below). Tiis a vector representing school type
(public or private). For the fixed effects framework, the specification adds household-specific intercepts:
(8) Scoreh i, =bfXh i, +cTh i, +dh+fh i, ,
where a household hconsists of all students with the same mother and father. As school type is a household choice, the assumption that the error term in Equation 7 is orthogonal to school type may be violated and our OLS results will be biased. To obtain IV estimates, we jointly estimate Equation 7 with an equation for choice of school type:
(9) Ti=btXi+dWi+ui,
where Wirepresents the percentage of public schools in the district that the student
attended public school, which is excluded from Equation 7 and assumed orthogonal to the unobserved test score component ε
i.
As noted, the set of control variables varies by the three samples. For the full sample, Xicontains the following time-invariant characteristics of the respondent:
● Academic achievement in elementary school: The (normalized) student’s
reported elementary school test score and its square, and whether the student repeated a grade.
● District characteristics:The average normalized elementary school test score
of all other students that attended school in that district, and the number of total schools.10
● Family background: Parental education level, the family’s religion, and the
primary language spoken at home (as a proxy for ethnicity, which was not recorded).
● Location characteristics:The province in which the student attended junior
secondary school and whether the student at age 12 resided in a village, a small town, or a big city.
● Type of elementary school:The type of elementary school attended (public
secular, public Madrassah, private secular, private Madrassah, private Muslim non-Madrassah, or private other).
● Student characteristics:Gender of the respondent is female, working status
while attending junior secondary school, and reporting of the elementary school score from a written card or from memory.
Finally, the vector Ticontains whether the junior secondary school attended was a vocational school, and whether the school was public or private. For the OLS and fixed effects results, we also estimate specifications where school type Ticontains the
vocational dummy and indicators for six different types of junior secondary schools: public secular, public Madrassah, private secular, private Madrassah, private Muslim non-Madrassah, or private other.
For the junior secondary school sample, in addition to the time-invariant character-istics and the school type variables listed above, the set of control variables includes indicators for household income or wealth (household per-capita expenditure and type of floor in the dwelling) and student health.11For the elementary school sample, we
add these three same time-varying characteristics, measured two to four years before the completion of junior secondary school. Finally, for the household fixed effects regressions, the control variables include only those variables that vary across siblings (elementary school academic achievement variables, the type of elementary school, and the student characteristics listed above). The means and standard errors of the full set of covariates are given in Appendix Table A1.
To check the quality of the data on test scores and household characteristics, we regressed the student’s normalized test score on the variables listed above, using the junior secondary school subsample and variables. The results, which are listed in Appendix Table A2, are encouraging. The model explains nearly half of the total variation in test scores, and the signs and magnitudes of the coefficients are reasonable. Academic performance in elementary school and higher levels of parental education are associated with higher test scores in junior secondary school. Finally, there are strong provincial effects, which we do not attempt to explain here, but are consistent with the large regional variation noted in other work looking at test scores as well as enrollment rates across provinces (World Bank 1998 and 2004).
VI. Determinants of School Type
Before turning to the question of how school type affects academic performance, we first examine the relationship between a student’s characteristics and the type of school she chooses. While the determinants of school type are of interest in their own right, they also may provide some guidance to the extent and nature of selection bias due to unobserved student characteristics. Public schools, which are generally considered to be superior to private schools in Indonesia, may attract more motivated students. However, holding constant other characteristics of the household and schools, higher household wealth should raise the probability that children attend private schools. To examine the effect of household wealth and student academic abil-ity on the type of school attended, we use the junior secondary school sample to esti-mate a multinomial logit regression of school type attendance. The dependent variable is an indicator of whether the student attended public school, private secular school, private Muslim-affiliated school, private Madrassah, or a private non-Muslim reli-gious school.12
We focus on the determinants of attendance at private secular, Muslim-affiliated private schools, and Madrassahs, because there are few students attending private non-Muslim religious schools.13The Madrassah category includes both traditional
Tsaniwayah Pesantren schools, which emphasize the study of the Quran, Arabic language, and Muslim history, as well as the newer Madrassah schools which inte-grate these religious subjects with the academic curriculum of the public education system.
The entire set of household and student characteristics listed in the data section are included as control variables, but we report only the results from indicators of house-hold wealth, the student’s prior academic achievement and parental education. Table 1 reports the average marginal effects of each variable on the probability of attending a particular type of school, and whether the variable was statistically significant in the multinomial logit model.14The regression contains two measures of income or
wealth: household per-capita consumption and the floor type of the house. After con-trolling for a wide variety of other household characteristics, these indicators of income and wealth are weak determinants of the type of junior secondary school attended. The marginal effect of log household per-capita consumption for private secular schools shows that a 10 percent increase in household per-capita consump-tion lowers the probability of attendance relative to public school by one percentage
12. In this analysis, public Madrassahs are grouped with public secular schools for brevity. Only 7 percent of public school students attend public Madrassahs.
13. Three percent of the full sample and 10 percent of the private-school attendees attend non-Muslim reli-gious schools. Of these schools, about 60 percent are Catholic, while the remaining 40 percent are Christian or Buddhist, or have other religious affiliation. Christian schools are not restricted to Christian students. Private Catholic and Protestant secondary schools often enroll Muslim students. In the data used, very few students switched schools at all, let alone switched between public and private schools, during their atten-dance at the junior secondary level.
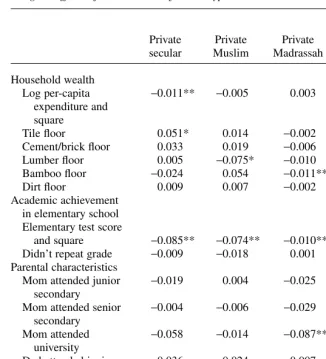
Table 1
Marginal effects of determinants of school type
Private Private Private Private religious
secular Muslim Madrassah other
Household wealth
Log per-capita −0.011** −0.005 0.003 0.003
expenditure and square
Tile floor 0.051* 0.014 −0.002 0.014
Cement/brick floor 0.033 0.019 −0.006 0.020*
Lumber floor 0.005 −0.075* −0.010 0.040
Bamboo floor −0.024 0.054 −0.011** −0.030**
Dirt floor 0.009 0.007 −0.002 0.030
Academic achievement in elementary school Elementary test score
and square −0.085** −0.074** −0.010** −0.016**
Didn’t repeat grade −0.009 −0.018 0.001 0.001
Parental characteristics
Mom attended junior −0.019 0.004 −0.025 0.014
secondary
Mom attended senior −0.004 −0.006 −0.029 0.028**
secondary
Mom attended −0.058 −0.014 −0.087** 0.059
university
Dad attended junior 0.036 −0.024 −0.007 0.004
secondary
Dad attended senior 0.003 0.005 −0.043* 0.004
secondary
Dad attended −0.013 0.035 −0.087** 0.005
university
Observations 2,733 2,733 2,733 2,733
point. Meanwhile, despite the theory that increased wealth increases the probability of private school attendance ceteris paribus, there is no consistent pattern between the quality of the floor and the probability of attending private secular or Muslim school.
The student’s past academic performance has a larger effect on the probability of attending private school. An increase in the elementary school exam score of one stan-dard deviation lowers the probability of attending private secular school by nine per-centage points; the probability of attending private Muslim school falls by seven percentage points, and the probability of attending a private Madrassah falls by one percentage point. Grade repetition in elementary school also reduces in the probabil-ity of attending a secular private school, although this effect is smaller and not statis-tically significant. Likewise, parental education is generally not a strong determinant of school type. Parental education is presumably correlated with student motivation, and, in results presented later, is shown to be a strong predictor of junior secondary school test score. The relatively small effect of parental education suggests that after controlling for lagged test scores, there may not be a large difference in student moti-vation at different types of schools.
These results confirm the widespread impression that public schools in Indonesia tend to benefit from positive selection. If elementary school test score and the lack of repetition are positively correlated with unobservable determinants of learning, like motivation, the estimated effects of public school attendance on test scores will be biased upward. The next section turns to examining estimates of the effect of public schooling on test scores.
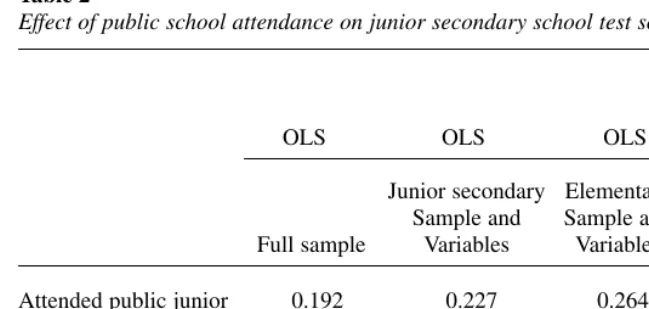
VII. The Effect of Public Schooling on Test Scores
Are public or private schools, on average, more effective at raising the test scores of Indonesian junior secondary school students? To address this question, we regressed the respondents’ normalized junior secondary test score on the control variables listed above, with school type represented by a dummy variable for public school attendance. To conserve space, only the coefficient on school type is shown. Column 1 of Table 2 indicates that public school students, in the presence of controls, score 0.19 standard deviations higher than private school students. The second speci-fication includes time-varying control variables measured within a year of junior sec-ondary graduation, which are only available for the junior secsec-ondary school subsample. The estimated public school effect, reported in Column 2, increases to 0.23 standard deviations in this specification. When time-varying variables measured around the student’s elementary school graduation are added, the magnitude of the premium rises slightly, to 0.26 standard deviations (Column 3). The final specification (Column 4) includes family-level fixed effects, which identifies the public school effect using sib-lings that attended different types of schools, and the estimated public school pre-mium is 0.24 standard deviations.15
Of course, least squares estimates of the public school effect will be biased if pub-lic school attendance is correlated with unobserved factors that determine test scores. In the Indonesian context, the direction of this endogeneity bias is unclear in theory, as described above. However, the correlation between observable characteristics and school choice suggests that public schools benefit from positive selection, which might bias the estimated public school premium upward. Moreover, because parents choose schools separately for each child within the household, partly on the basis of unobservable child characteristics, the inclusion of family-level fixed effects does not eliminate this bias.16
Least squares estimates of the public school effect also will be biased if recall error in the test score is correlated with the type of school attended. To infor-mally assess the effect of recall error, we exploit the fact that survey asked respon-dents to produce their official test report if available. Sixty-two percent of the respondents in the final sample showed their test card to the interviewer in either 1997 or 2000. We include a dummy variable in the regression for whether the respondent showed a card. In the regression determining test score in the junior high school sample, the coefficient on the card dummy is −0.09 and statistically
sig-nificant, which could reflect a mixture of respondents overstating scores recalled from memory and higher scoring students being less likely to retain their card. Omitting the card dummy from the regression has a negligible effect on the school-type coefficients, however, and coefficients on the interactions of the card dummy
16. In the sample of children for whom two siblings attended different types of schools, within-family vari-ation accounts for 39 percent of the total varivari-ation in test scores, which is consistent with intra-household selection into public schools.
Table 2
Effect of public school attendance on junior secondary school test score
Family fixed
OLS OLS OLS effects
Junior secondary Elementary
Sample and Sample and Full
Full sample Variables Variables sample
Attended public junior 0.192 0.227 0.264 0.244
secondary school (0.029)** (0.039)** (0.044)** (0.066)**
Observations 4,382 2,733 1,948 883
R-squared 0.45 0.48 0.51 0.76
and school type were not statistically significant. This suggests that recall error has a weak association with school type, and is unlikely to be a serious concern in our data.
Nonrandom sorting of students into different types of schools remains a potential source of bias. To address it, we estimate two-stage-least-squares models of test scores, employing measures of the local availability of public schools as an instrument for public school attendance.17 This approach has been used to estimate the effect of
Catholic schooling effect in the United States (see, for example, Neal 1997; Figlio and Ludwig 2000). The importance of availability of private schools in schooling choices has been demonstrated in the developing country context (see, for example, Alderman, Orazem, and Paterno 2001). Data on the presence of public and private schools are available at the district level from the school census data collected by the Ministry of Education. We measure the percentage of schools that are public in the district of ju-nior secondary school attendance.
The consistency of the two stage least squares estimate is based on the critical assumption that local private school proximity is uncorrelated with unobserved deter-minants of student test scores. This assumption has been questioned in the U.S. con-text, where evidence suggests that proximity to catholic secondary schools is correlated with unobserved determinants of 12th grade math and reading test scores (Altonji, Elders, and Taber 2002). However, that conclusion is largely based on the implausibly large differences between OLS and 2SLS estimates of the effect of Catholic schooling on scores, which we do not find in the Indonesia data. Also, the location of American Catholic secondary schools is heavily influenced by historical pattern of past Catholic migration (Hoxby 1994), implying that the positive correlation between student unob-servables and proximity to American Catholic secondary schools does not generalize to Indonesian private middle schools.
In contrast to selection bias, which likely leads to an overestimate of the public school premium, it is not clear how the location decisions of public and private schools will bias the estimated public school effect. If public schools are spread uni-formly throughout a population that is heterogeneous in its demand for education, then profit-maximizing private schools will locate in areas where demand for educa-tion, and therefore student achievement, is higher. In this case, the estimated public school premium will be biased downward. This downward bias may be mitigated or reversed by two factors. First, the national education department may maximize edu-cational achievement by locating public schools in areas with high student ability (for an example of endogenous program placement, see Pitt, Rosenzweig, and Gibbons 1993). Second, the estimated public school effect could be upwardly biased if private and/or Muslim schools are more appealing to parents living in areas with undisci-plined students. Likewise, households themselves may make location decisions based on school availability. Concerns regarding endogenous matching of households and schools are lessened to the extent that schools and households locate based on char-acteristics of the population that are included in the model, such as average district-level and student-district-level test scores. Overall, however, theory provides no clear
guidance as to whether private schools are more common in areas with unobservably stronger or weaker students.
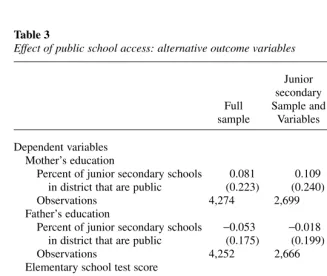
To gain insight into the validity of using the percentage of district schools that are public as an instrument for public school attendance, we regress four important determinants of test scores on the instrument, while controlling for all other control variables in the model. These results are reported in Table 3 for mother’s education, father’s education, elementary school test score, and having repeated a grade at the elementary level. The percent of junior secondary schools in the district which are public is not statistically significant in any of the specifications in Table 3. Moreover, the signs of the estimated effects are not consistent. For example, public school access is positively correlated with maternal schooling and negatively corre-lated with paternal schooling. In addition, public school access is negatively correcorre-lated
Table 3
Effect of public school access: alternative outcome variables
Junior Elementary secondary Sample
Full Sample and and
sample Variables Variables
Dependent variables Mother’s education
Percent of junior secondary schools 0.081 0.109 0.069
in district that are public (0.223) (0.240) (0.254)
Observations 4,274 2,699 1,934
Father’s education
Percent of junior secondary schools −0.053 −0.018 −0.098
in district that are public (0.175) (0.199) (0.215)
Observations 4,252 2,666 1,908
Elementary school test score
Percent of junior secondary schools −0.032 0.081 0.191
in district that are public (0.235) (0.268) (0.277)
Observations 4,382 2,733 1,948
R-squared 0.21 0.23 0.25
Repeated a grade in elementary school
Percent of junior secondary schools −0.112 −0.119 −0.294
in district that are public (0.236) (0.278) (0.318)
Observations 4,360 2,687 1,923
with elementary school test score in the full sample but positively correlated in the other two samples. The lack of a clear positive association between the instrument and observable determinants of junior high school test score provides some reas-surance that the instrumental variable estimates are not systematically biased.
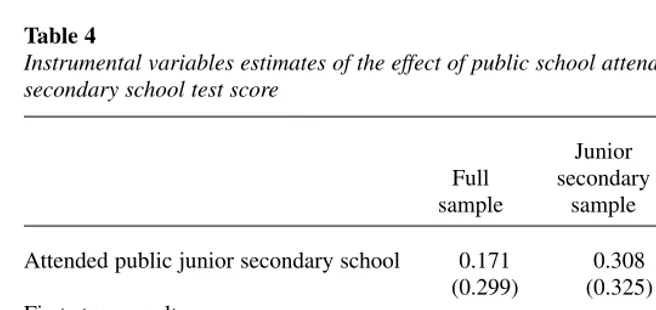
Table 4 presents the instrumental variables results of the effect of junior secondary school choice on test scores. Using a district-level measure of access to private schools, the public school premium falls slightly to 0.17 for the full sample. The esti-mated premium rises to 0.31 when the junior secondary sample is used, but falls to 0.16 in the elementary school subsample. None of the instrumental variable estimates are statistically significant. The first stage Fstatistic on these instruments ranges from 25 to 37, meaning that finite sample bias due to weak instruments is not an important concern.18
Taken as a whole, the results from regressions estimating the average effect of pub-lic schools on test scores are consistent. Least squares estimates suggest that pubpub-lic
Table 4
Instrumental variables estimates of the effect of public school attendance on junior secondary school test score
Junior
Full secondary Elementary
sample sample sample
Attended public junior secondary school 0.171 0.308 0.163
(0.299) (0.325) (0.361)
First stage results
Fstatistic 41.6 32.4 29.2
Partial R-squared 0.021 0.021 0.028
Hausman chi-squared 0.0007 0.0065 0.0184
Hausman P 0.98 0.94 0.89
Observations 4,382 2,733 1,948
R-squared 0.45 0.48 0.51
Note: Robust standard errors in parentheses. * significant at 5 percent; ** significant at 1 percent. Regression includes other control variables listed below Table 1. The instrumental variable is the percent of junior sec-ondary schools in the district that are public.
school attendance raises a student’s test score 0.19 to 0.26 standard deviations. Using district-level access instruments generally results in similar estimated effects, as the estimated effect ranges from 0.17 to 0.31. The similarity of the magnitudes of the OLS and the instrumental variable estimates suggest that in total, the endogeneity bias resulting from parent’s choice of school type does not invalidate the qualitative con-clusions drawn from the OLS and fixed-effect estimates. Furthermore, the consistent finding of a positive public school premium across all estimation strategies is strong evidence that public junior secondary schools, on average, provide superior prepara-tion for the naprepara-tional exam.
Although the focus has been on test scores, the effect of public school attendance could be extended to additional affects of attending public junior secondary school. Moreover, these outcomes may provide some insight into the channels through which public school attendance affects test scores. In 1997, the IFLS records the self-reported amount of hours a person spent studying at home per week during attendance of junior secondary school. Because information on study hours was only collected in 1997, the sample size is limited and results should be interpreted with caution. In an OLS regression, public school attendance is associated with a minor, but statistically significant, increase of 0.7 hours per week in study time. The estimated magnitude is similar for the fixed effect model, but rises to an unrealistic 9.3 extra study hours in the IV model, and neither the fixed effect nor the IV coefficient is statistically signif-icant. The results are consistent with public school attendance slightly raising study hours, but are only suggestive, as the OLS results may reflect the tendency for more motivated students to select public schools.
We also examine the effect of school type on completion of junior secondary school, though there is less variation in this variable, as more than 95 percent of all students who start junior secondary school complete the third grade in that school level. The effect of public school attendance on probability of completion is not sig-nificant in any of the samples, and the sign of the effect varies across samples.
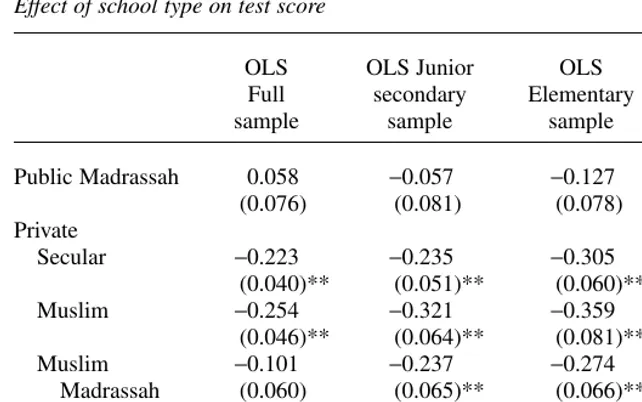
VIII. Different Types of Private Schools
slightly, to roughly 0.3 standard deviations. Overall, the results suggest that there are two tiers of schools, with private secular and Muslim schools lagging behind public schools and other private schools. The effect of school type on test score by gender shows the same pattern as that observed for the pooled sample in Table 5 (results not presented).
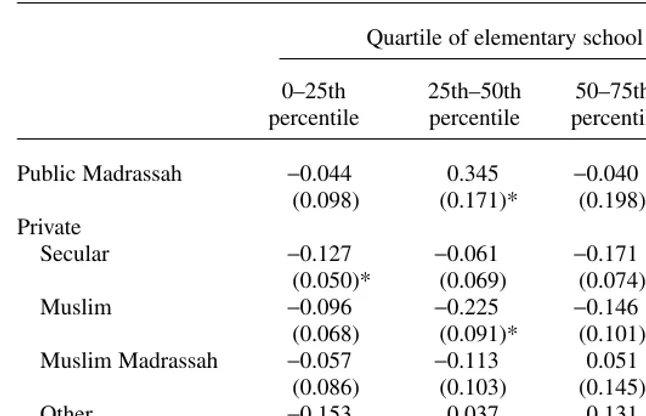
Is the positive effect of public schooling stronger for brighter students? Table 6 dis-plays the results from an OLS regression on the full sample in which junior second-ary school type is interacted with the student’s elementsecond-ary school test score quintile. For students in the highest quintile, secular and Muslim private schooling is associ-ated with a −0.40 and a −0.45 reduction test scores, which is statistically significant
at the 5 percent level. Meanwhile, for students in the second and lower quartile, the coefficients on school type are smaller. Some public schools in Indonesia, particularly in urban areas, screen students based on their elementary school test score. The results suggests that, relative to their privately schooled peers, the brightest public students benefit the most from this sorting, while less intelligent public school students are not harmed by it.
Finally, we examine a secondary methodological question: How robust is the baseline estimated effect of school type if the measures of elementary school achievement are excluded from the model? Table 7 shows the public school pre-mium for each sample and methodology, with and without two variables measur-ing academic perfor-mance in elementary school: the student’s elementary school
Table 5
Effect of school type on test score
OLS OLS Junior OLS Fixed Effects
Full secondary Elementary
sample sample sample Full sample
Public Madrassah 0.058 −0.057 −0.127 0.105
(0.076) (0.081) (0.078) (0.134)
Private
Secular −0.223 −0.235 −0.305 −0.284
(0.040)** (0.051)** (0.060)** (0.079)*
Muslim −0.254 −0.321 −0.359 −0.295
(0.046)** (0.064)** (0.081)** (0.084)*
Muslim −0.101 −0.237 −0.274 −0.083
Madrassah (0.060) (0.065)** (0.066)** (0.118)
Other −0.038 0.019 −0.010 0.115
(0.071) (0.096) (0.110) (0.132)
Observations 4,382 2,733 1,948 1,077
R-squared 0.46 0.49 0.52 0.75
test score (and its square), and whether the student repeated a grade in elementary school. Excluding these elementary school academic performance variables in a standard OLS regression generally doubles the public school premium. Because elementary school performance is strongly and positively associated with both public school attendance and subsequent junior secondary school test perfor-mance, its omission creates substantial upward bias in the estimated public school premium.
IX. Conclusion
This paper focuses on how junior secondary school students’ choice of school type influences their academic achievement. Students that attended public junior secondary schools, controlling for other characteristics, have higher test scores upon completion than those who attended private school. This finding is robust to three different estimation strategies: OLS, family-level fixed effects, and the use of regional measures of access to public schools as instruments for public school atten-dance. The OLS estimates of the public school premium are all statistically signifi-cant and in the range of 0.19 to 0.26 standard deviations. Instrumental variable estimates are not statistically significant, but the estimated public school premium is
Table 6
Effect of school type by elementary school test quartile
Quartile of elementary school test score
0–25th 25th–50th 50–75th 75th–100th
percentile percentile percentile percentile
Public Madrassah −0.044 0.345 −0.040 0.120
(0.098) (0.171)* (0.198) (0.165)
Private
Secular −0.127 −0.061 −0.171 −0.394
(0.050)* (0.069) (0.074)* (0.179)*
Muslim −0.096 −0.225 −0.146 −0.460
(0.068) (0.091)* (0.101) (0.168)**
Muslim Madrassah −0.057 −0.113 0.051 −0.061
(0.086) (0.103) (0.145) (0.238)
Other −0.153 0.037 0.131 0.257
(0.146) (0.211) (0.201) (0.196)
Observations 4,382
R-squared 0.46
Ne
whouse and Bee
gle
549
Effect of school type excluding academic achievement in elementary school
Full Sample Junior Secondary Sample Elementary Sample
Excluded Included Excluded Included Excluded Included
Public Madrassah −0.204 0.058 −0.328 −0.057 −0.402 −0.127
(0.082)* (0.076) (0.085)** (0.081) (0.090)** (0.078)
Private
Secular −0.587 −0.223 −0.561 −0.235 −0.659 −0.305
(0.040)** (0.040)** (0.051)** (0.051)** (0.058)** (0.060)**
Muslim −0.560 −0.254 −0.611 −0.321 −0.683 −0.359
(0.051)** (0.046)** (0.071)** (0.064)** (0.087)** (0.081)**
Muslim Madrassah −0.371 −0.101 −0.504 −0.237 −0.536 −0.274
(0.063)** (0.060) (0.072)** (0.065)** (0.073)** (0.066)**
Other −0.308 −0.038 −0.225 0.019 −0.227 −0.010
(0.084)** (0.071) (0.123) (0.096) (0.145) (0.110)
Observations 4,382 4,382 2,733 2,733 1,948 1948
R-squared 0.30 0.46 0.34 0.49 0.38 0.52
generally similar; it ranges from 0.17 to 0.31 standard deviations. Informal examina-tion of the effect of the public school access instrument on elementary school test score and parental education failed to uncover a systematic pattern. After examining different types of public and private schools, two tiers of performance emerge. Students in public school and non-Muslim religious private schools performed better than students in Muslim schools and secular private schools. However, students attending public Madrassahs performed no worse than those attending public secular schools, and students attending private Madrassahs performed no worse than their counterparts in private secular schools. The test score premium for public and non-Muslim religious private schools is highest for the brightest students. The estimated effects of school type pooled by gender are similar to those estimated separately for boys and girls. Finally, not surprisingly, indicators for achievement at the elementary school level are important covariates whose absence from the model substantially alters the results.
This research is a first step toward understanding the effects of school type on cognitive achievement in Indonesia. Recognizing the gaps in the existing literature, the study assesses the returns to public junior secondary schooling in terms of test scores, in light of the general finding that public schools use higher-quality inputs. It is interesting that, despite lower average returns in test scores and higher house-hold expenditures, some parents choose to send their children to private schools. Parents may choose private schools because public school enrollment is rationed, because they prefer Islamic-based moral and religious instruction, or because pri-vate schools are perceived to have other nonacademic advantages. Future research should examine the importance of these competing explanations. In addition, iden-tifying the specific aspects of quality that drive these higher scores will help in understanding how and why public school students outperform their privately edu-cated peers.
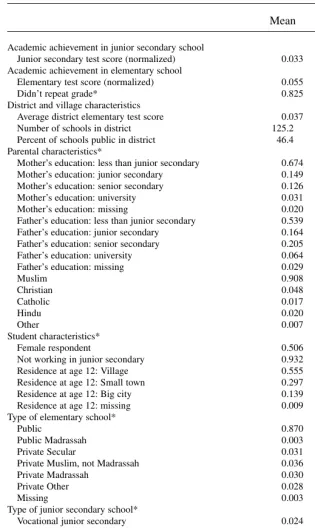
Sample means
Mean Standard Error
Academic achievement in junior secondary school
Junior secondary test score (normalized) 0.033 (0.029) Academic achievement in elementary school
Elementary test score (normalized) 0.055 (0.031)
Didn’t repeat grade* 0.825 (0.009)
District and village characteristics
Average district elementary test score 0.037 (0.023) Number of schools in district 125.2 (4.208) Percent of schools public in district 46.4 (0.906) Parental characteristics*
Mother’s education: less than junior secondary 0.674 (0.014) Mother’s education: junior secondary 0.149 (0.008) Mother’s education: senior secondary 0.126 (0.008) Mother’s education: university 0.031 (0.004) Mother’s education: missing 0.020 (0.002) Father’s education: less than junior secondary 0.539 (0.016) Father’s education: junior secondary 0.164 (0.008) Father’s education: senior secondary 0.205 (0.010) Father’s education: university 0.064 (0.006)
Not working in junior secondary 0.932 (0.006) Residence at age 12: Village 0.555 (0.020) Residence at age 12: Small town 0.297 (0.015) Residence at age 12: Big city 0.139 (0.012) Residence at age 12: missing 0.009 (0.003) Type of elementary school*
Public 0.870 (0.011)
Public Madrassah 0.003 (0.001)
Private Secular 0.031 (0.006)
Private Muslim, not Madrassah 0.036 (0.005)
Private Madrassah 0.030 (0.005)
Private Muslim, not Madrassah 0.081 (0.006)
Private Madrassah 0.075 (0.008)
Private other 0.035 (0.004)
Ebtanas score recorded from card (else by recall) 0.619 (0.012) Languages spoken at home*
Indonesia 0.254 (0.015)
Mean Standard Error
Subsamples Junior Secondary Sample Elementary Sample
Log PCE 3.306 (0.059) 5.062 (0.028)
Floor type: ceramic or stone* 0.137 (0.010) 0.064 (0.007) Floor type: tile* 0.338 (0.016) 0.316 (0.016) Floor type: cement/brick* 0.364 (0.016) 0.412 (0.018) Floor type: lumber* 0.066 (0.009) 0.074 (0.010) Floor type: bamboo* 0.004 (0.001) 0.005 (0.002) Floor type: dirt* 0.089 (0.012) 0.124 (0.015) Floor type: missing 0.001 (0.000) 0.005 (0.002) Health status: very healthy 0.120 (0.008) 0.069 (0.008) Health status: somewhat healthy 0.635 (0.012) 0.346 (0.013) Health status: somewhat unhealthy 0.051 (0.005) 0.015 (0.003) Health status: missing 0.194 (0.009) 0.570 (0.013)
Observations 2,733 1,948
Table A2
Determinants of junior secondary school test score
Academic achievement in elementary school
Elementary test score 0.44** (0.03)
Elementary test score, squared 0.08** (0.02)
Didn’t repeat grade 0.23** (0.04)
Household wealth after junior secondary school
Log PCE after junior secondary 0.003 (0.03)
Log PCE after junior secondary, squared (/1000) −0.11 (0.01)
Tile floor −0.04 (0.06)
Cement/Brick floor −0.06 (0.06)
Lumber floor −0.24* (0.10)
Bamboo floor 0.06 (0.21)
Dirt floor −0.15 (0.09)
District characteristics
Average district elementary score 0.05 (0.06)
Average district elementary score, squared −0.029 (0.07)
Number of schools in district 0.001* (0.00)
Parental characteristics
Mom attended junior secondary −0.02 (0.05)
Mom attended senior secondary 0.09 (0.06)
Mom attended university 0.26* (0.12)
Dad attended junior secondary 0.08 (0.05)
Dad attended senior secondary 0.16** (0.05)
Dad attended university 0.33** (0.10)
Christian 0.03 (0.09)
Catholic 0.04 (0.13)
Hindu 0.23 (0.14)
Other 0.00 (0.20)
Student characteristics
Female respondent −0.02 (0.03)
Not working in junior secondary 0.10 (0.06)
Somewhat healthy −0.05 (0.05)
Somewhat unhealthy −0.16* (0.08)
Residence at age 12: small town 0.026 (0.04)
Residence at age 12: big city −0.09 (0.06)
Type of elementary school
Public Madrassah −0.16 (0.17)
Private secular 0.18 (0.10)
Private Muslim, not Madrassah 0.19* (0.09)
Private Madrassah 0.21* (0.10)
Private other 0.30* (0.13)
Type of junior secondary school
Vocational junior secondary −0.48** (0.16)
Public Madrassah −0.06 (0.08)
Private secular −0.235** (0.05)
Table A2 (continued)
Private Madrassah −0.24** (0.06)
Private other 0.02 (0.10)
Ebtanas score recorded from card (else by recall) −0.09* (0.04)
Languages spoken at home
Indonesia 0.02 (0.05)
Java 0.11 (0.06)
Sunda 0.01 (0.08)
Bali 0.05 (0.12)
Batak −0.39** (0.14)
Bugis −0.06 (0.19)
Chinese 0.48* (0.20)
Madura −0.04 (0.11)
Sasak 0.05 (0.15)
Minang 0.03 (0.14)
Banjar 0.06 (0.12)
Bima 0.12 (0.22)
Makassar −0.76* (0.31)
Palembang 0.001 (0.18)
Sumbawa −0.25 (0.23)
Toraja −0.43 (0.29)
Lahat −0.39** (0.14)
Sumatra Selatan −0.05 (0.13)
Betawi 0.11 (0.14)
Lampung −0.35 (0.27)
Location of junior secondary school
North Sumatra 0.35** (0.11)
West Sumatra 0.40** (0.14)
South Sumatra 0.32 (0.17)
Lampung 0.09 (0.12)
West Java −0.04 (0.10)
Central Java 0.67** (0.10)
Yogyakarta 0.65** (0.11)
East Java 0.53** (0.09)
Bali 0.24 (0.15)
West Nusa Tenggara −0.08 (0.19)
South Kalimantan 0.29* (0.13)
South Sulawesi 1.03** (0.18)
Other province 0.27 (0.68)
Constant −0.69**
Observations 2,733
R-squared 0.49
(A5) E=dv+~.
By assumption, Ppri> Ppub, which implies that Y >Y pub pri
1 1
Taking derivatives with respect to σand Y1gives:
(A6) 2U* bd Tpub Tpri and
Substituting τinto (A6) and rearranging gives:
(A9) U* bd Tpub Tpri Y T Y T ,
We assume that band dare positive, reflecting the positive effect of parental concern on effort, and the subsequent positive relationship between effort and future transfers. Because public schools are generally considered to be superior on average to private schools in Indonesia, we assume that Qpub>Qpri, which implies that Tpub>Tpri.
Meanwhile, in this model higher-income households are more likely to send their children to private school:
Alderman, Harold, Peter Orazem, and Elizabeth Paterno. 2001. “School Quality, School Cost, and the Public/Private School Choices of Low-Income Households in Pakistan.” Journal of Human Resources36(2):304–26.
Altonji, Joseph, Todd Elder, and Christopher Taber. 2002. “An Evaluation of Instrumental Variables for Estimating the Effects of Catholic Schools.” NBER working paper 9358.
Angrist, Joshua, Eric Bettinger, Erik Bloom, Elizabeth King, and Michael Kremer. 2002. “Vouchers for Private Schooling in Colombia: Evidence from a Randomized Natural Experiment.” American Economic Review92(5):1535–58
Asian Development Bank. 1998. “Financing of Education in Indonesia,” ed. Mark Bray and R. Murray Thomas. Unpublished.
Bedi, Arjun, and Ashish Garg. 2000. “The Effectiveness of Private Versus Public Schools: the Case of Indonesia.” Journal of Development Economics61(2):463–94.
Cox, Donald, and Emmanuel Jimenez. 1991. “The Relative Effectiveness of Private and Public Schools: Evidence from Two Developing Countries.” Journal of Development Economics34(1–2):99–121.
Evans, William, and Robert Schwab. 1995. “Finishing High School and Starting College: Do Catholic Schools Make a Difference?” Quarterly Journal of Economics110(4): 947–74.
Figlio, David, and Jens Ludwig. 2000. “Sex, Drugs, and Catholic Schools: Private Schooling and Nonmarket Adolescent Behavior.” NBER working paper 7990.
Frankenberg, Elizabeth, and Lynn Karoly. 1995. “The 1993 Indonesian Family Life Survey: Overview and Field Report.” Publication No. DRU-1195/1-NICHD/AID, RAND, Santa Monica, Calif.
Frankenberg, Elizabeth, and Duncan Thomas. 2000. “The Indonesia Family Life Survey (IFLS): Study Design and Results from Waves 1 and 2.” Publication No. DRU-2238/Volume 1/NIA/NICHD, RAND, Santa Monica, Calif.
Glewwe, Paul. 2002. “Schools and Skills in Developing Countries: Education Policies and Socioeconomic Outcomes.” Journal of Economic Literature40(2):436–82.
Hoxby, Caroline M. 1994. “Do Private Schools Provide Competition for Public Schools?” NBER working paper no. 4978.
———. 2000. “Peer Effects in the Classroom: Learning from Race and Gender Variation.”
NBER working paper no.7867.
James, Estelle, Elizabeth King, and Asep Suryahadi. 1996. “Finance, Management and Costs of Public and Private Schools in Indonesia,” Economics of Education Review 15(4):387–98.
Jimenez, Emmanuel, Marlaine Lockheed, and Vicente Paqueo. 1991. “The Relative Efficiency of Private and Public Schools in Developing Countries.” The World Bank Research Observer6(2): 205–18.
Neal, Derek. 1997. “The Effects of Catholic Secondary Schooling on Educational Achievement.” Journal of Labor Economics15(1):98–123.
Pitt, Mark, Mark Rosenzweig, and Donna Gibbons. 1993. “The Determinants and Consequences of the Placement of Government Programs in Indonesia.” World Bank Economic Review7(3):319–48.
Pradhan, Menno. 2001. “Basic Education Outcomes During Crisis An analysis Using the 1998-2000 SUSENAS.” Unpublished.
Serrato, Carl, and Glen Melnick. 1995. “The Indonesian Family Life Survey: Overview and Descriptive Analyses of Population, Health and Education data.” Publication No. DRU-1191-AID, RAND, Santa Monica, Calif.
Strauss, John, Kathleen Beegle, Agus Dwiyanto, Yulia Herawati, Daan Pattinasarany, Elan Satriawan, Bondan Sikoki, Sukamdi, Firman Witoelar. 2004. Indonesian Living Standards: Before and After the Financial Crisis.Rand Corporation, USA, and Institute of Southeast Asian Studies.
World Bank. 1998. Education in Indonesia: From Crisis to Recovery. Washington, D.C.: World Bank.
———. 2004. Education in Indonesia: Managing the Transition to Decentralization.