Full Terms & Conditions of access and use can be found at
http://www.tandfonline.com/action/journalInformation?journalCode=vjeb20
Journal of Education for Business
ISSN: 0883-2323 (Print) 1940-3356 (Online) Journal homepage: http://www.tandfonline.com/loi/vjeb20
Students' Perceptions of Peer Evaluation: An
Expectancy Perspective
Yining Chen & Hao Lou
To cite this article: Yining Chen & Hao Lou (2004) Students' Perceptions of Peer Evaluation: An Expectancy Perspective, Journal of Education for Business, 79:5, 275-282, DOI: 10.3200/ JOEB.79.5.275-282
To link to this article: http://dx.doi.org/10.3200/JOEB.79.5.275-282
Published online: 07 Aug 2010.
Submit your article to this journal
Article views: 90
View related articles
he use of student groups for class projects is now a common peda-gogical practice in many business schools. Many instructors view class group projects as excellent learning exercises and training opportunities (Beatty, Hass, & Sciglimpaglia, 1996; Goldfinch & Raeside, 1990). Instruction-al methods have shifted from traditionInstruction-al lecturing to collaborative learning1based on the principle that effective learning requires students to be actively involved in social learning contexts—that is, group projects. Although most of the commentary regarding the use of student groups has been positive, one of the instructional hazards of group projects is evaluation (Gueldenzoph & May, 2002). Because of the potential of uneven effort and participation within groups, evaluating a group member’s perfor-mance is often difficult. A method is needed for evaluation and grading of students with uneven workload distribu-tions in project groups. This method also must recognize the objectives, abil-ities, motivations, and contributions of various individuals. Many researchers believe that the problem of inequitable contributions can be addressed effec-tively through a grading system that gives appropriate weight to individual contributions and to the group’s collec-tive achievement (Williams, Beard, & Rymer, 1991).
Previous research has suggested that instructors potentially can use peer assessment to improve evaluation accu-racy. This research indicates that peer assessment reflects the perspective of peer students who are in close contact and are familiar with group member behaviors and characteristics that may not otherwise be apparent to an instruc-tor (Barrett, 1996; Cederblom & Louns-bury, 1980). Research on peer evalua-tions often examines issues such as the development and validity of an evalua-tion instrument (Johnson & Smith, 1997; Levi & Cadiz, 1998; Smith, 1998), the validity (Beatty et al., 1996) and
reliabil-ity (Morahan-Martin, 1996) of peer rat-ings in measuring student performance, and the potential bias of peer ratings (Ghorpade & Lackritz, 2001; Hass, Hass, & Wotruba, 1998). Very few stud-ies, however, have examined students’ perceptions of peer evaluations and their motivation to participate in the evalua-tion. Because students’ input is the root and source of peer evaluation data, active and meaningful participation by students is essential. The peer evaluation data will not be useful unless students willingly provide quality input.
Expectancy theory has been recog-nized as one of the most promising con-ceptualizations of individual motivation (Ferris, 1977). Many researchers have proposed that expectancy theory pro-vides an appropriate theoretical research framework that examines a user’s acceptance of and intent to use a system (DeSanctis, 1983). In this study, we use expectancy theory in a student-based experiment that examines stu-dents’ acceptance of and motivation to participate in a peer evaluation system. We posed the following research ques-tions: (a) Can expectancy theory appro-priately explain the behavioral intention of students to participate in peer evalua-tions? and (b) How do the potential uses of peer evaluations affect students’ motivation to participate in the evalua-tion process?
Students’ Perceptions of
Peer Evaluation:
An Expectancy Perspective
YINING CHEN HAO LOU
Ohio University Athens, Ohio
T
ABSTRACT.Because of the difficulty of evaluating uneven performance among group members, many research-ers suggest incorporating peer evalua-tions in a grading system that permits an instructor to evaluate and grade indi-vidual performance more equitably within a group. In this study, the authors employ expectancy theory to assess key factors that may motivate students to participate in the peer eval-uation process of group projects. Results show that students generally thought that the most attractive out-come of peer evaluation is its use in the determination of peers’ grades. The second most attractive outcome is its use for reduction of conflict and uneven workload distribution among group members. The authors provide implica-tions for instructors planning to use peer evaluation in group projects.
Theoretical Background and Supporting Literature
Group projects provide opportunities for students to learn from each other (Beatty et al., 1996). In a group setting, students not only acquire the knowl-edge that other group members offer but also acquire skills in group dynamics and leadership that should prove valu-able in their future business careers. Previous research in this area points to conclusive agreement as to the value of group projects (Williams et al., 1991).
One primary problem surrounding the implementation of group projects is assigning each group member a fair grade based on that member’s contribu-tion to the group effort. Instructors need a reward system for the inequitable work done by students in project groups. One solution is to institute a peer-rating system that allows the instructor to assign individual grades for a group project, which, in turn, would encourage full participation by all group members (Cook, 1981, p. 50). The rationale behind peer ratings is that individual group members spend a substantial amount of time working with each other and, thus, are in a good position to rec-ognize and assess their peers’ efforts and contributions. Their insight can give instructors a better understanding of the dynamics that take place within individ-ual groups (Hass et al., 1998, p. 200).
Functions of Peer Evaluation
In peer evaluation, group members judge their fellow members on specific traits, behavior, and achievements (Kramer, 1990). Because peer ratings involve the perspective of individuals of the same level who are in close contact with those being assessed (Barrett, 1996; Cederblom & Lounsbury, 1980), peer evaluations have been recognized widely and adopted in both workplaces and classrooms. Research indicates that peers make finer distinctions among different aspects of performance than do supervi-sors; consequently, feedback from peers is more effective than supervisor ratings in eliciting behavior changes (DeNisi, Randolph, & Blencoe, 1982).
Peer evaluations traditionally have served two functions in measuring
group members’ performances: a forma-tive function and a summaforma-tive one. At the individual level, the formative func-tion of peer evaluafunc-tion provides infor-mation for individual group members to modify behavior as necessary to assure their grade is representative of their effort. At the group level, the formative function of peer evaluation facilitates group productivity and group dynamics (Gueldenzoph & May, 2002). It also facilitates the resolution of differences and conflict among group members (Cook, 1981). The summative function of peer evaluation provides information for instructors in assigning individual course grades. Peer rating supplies an alternative source of information on performance with a high degree of feed-back specificity. For providing informa-tion on group members that is only accessible by other group members, composites of rating scores by student peers and faculty members may yield a more accurate assessment of perfor-mance (Sherrard & Raafat, 1994, p. 44). Although peer evaluation shows promise as a valid, reliable measure of individual performance in a group set-ting, lack of participation or resistance from students can limit its effectiveness (Cederblom & Lounsbury, 1980). Because students’ input is the basis of peer evaluation data, students’ active par-ticipation and meaningful input are criti-cal to the success of such a system. Very few studies, however, have analyzed stu-dents’ attitudes toward peer evaluations and the factors that influence their atti-tudes. Likewise, few studies have exam-ined the behavioral intention of students’ participating in the peer evaluations.
Expectancy Theory
The theory of reasoned action, as pro-posed by Ajzen and Fishbein (1980), is a well-researched model that has suc-cessfully predicted behavior in a variety of contexts. Those researchers proposed that attitudes and other variables (i.e., an individual’s normative beliefs) do not directly influence actual behavior (e.g., participation) but are fully mediated through behavior intentions, or the strength of intentions, to perform a spe-cific behavior. This would imply that measurement of behavioral intentions
(motivation) to participate in a system is a strong predictor (and a more appropri-ate one than just attitudes) of the suc-cess of the system.
Expectancy theory is considered one of the most promising conceptualiza-tions of individual motivation. Original-ly developed by Vroom (1964), it has served as a theoretical foundation for a large body of studies in psychology, organizational behavior, and manage-ment accounting (Brownell & McInnes, 1986; Geiger & Cooper, 1996; Han-cock, 1995; Harrell, Caldwell, & Doty, 1985; Snead & Harrell, 1995). Expectancy models are cognitive expla-nations of human behavior that cast a person as an active, thinking, predicting creature in his or her environment. He or she continuously evaluates the out-comes of his or her behavior and sub-jectively assesses the likelihood that each of his or her possible actions will lead to various outcomes. The choice of the amount of effort exerted by the indi-vidual is based on a systematic analysis of (a) the values of the rewards from these outcomes, (b) the likelihood that rewards will result from these out-comes, and (c) the likelihood of reach-ing these outcomes through his or her actions and effort.
According to Vroom, expectancy the-ory comprises two related models: the valence model and the force model. In our application of the theory, the valence model shows that the overall attractive-ness of a peer evaluation system to a stu-dent (V) is the summation of the prod-ucts of the attractiveness of those outcomes associated with the system (Vk) and the probability that the system will produce those outcomes (Ik):
where:
V = the valence, or attractiveness, of a peer evaluation;
Vk= the valence, or attractiveness, of peer evaluation outcome k; and
Ik= the perceived probability that the peer evaluation will lead to outcome k.
In our case, the four potential out-comes (i.e., k = 1, 2, 3, 4) are the four
uses of peer evaluations described in the literature (Cook, 1981; Gueldenzoph & May, 2002; Sherrard & Raafat, 1994). They are (a) determining peers’ grades, (b) improving peers’ performance and behavior, (c) enhancing group produc-tivity and collaboration, and (d) reduc-ing conflict and uneven workload distri-bution among group members.
The second model, the force model, shows that a student’s motivation to exert effort in a peer evaluation system (F) is the product of the attractiveness of the system (V) and the probability that a certain level of effort will result in a suc-cessful contribution to the system (E):
F = E * V
where:
F = the motivational force to partici-pate in a peer evaluation;
E = the expectancy that a particular level of participation, or effort, will result in a successful contribution to the evaluation; and
V = the valence, or attractiveness, of the peer evaluation, derived in the previ-ous equation of the valence model.
In summary, each student first uses the valence model and then the force model. In the valence model, each par-ticipant in a peer evaluation system evaluates the system’s outcomes (e.g., determining peers’ grades, improving peers’ performance and behavior, enhancing group productivity and col-laboration, and reducing conflict and uneven workload distribution among group members) and subjectively assesses the likelihood that these out-comes will occur. Next, by placing his or her own intrinsic values (or weights) on the various outcomes, each student evaluates the overall attractiveness of the peer evaluation. Finally, the student uses the force model to determine the amount of effort that he or she is willing to exert in the evaluation process. This effort level is determined by the product of the attractiveness generated by the valence model (above) and the likeli-hood that his or her effort will result in a successful contribution to the evalua-tion. Following this systematic analysis, the student will determine how much effort he or she would like to exert in participating in the peer evaluation.
Research Objectives
The purpose of this study was twofold. First, using valence model of expectancy theory, we investigated the impact of the potential uses (outcomes) of peer evaluations on students’ percep-tion of the attractiveness of participapercep-tion in the evaluation process. Specifically, we tested four common uses of peer evaluations that are well documented and supported by literature. Of them, three are formative and one is summa-tive. The summative one is (a) deter-mining peers’ grades; the three forma-tive uses are (b) improving peers’ performance and behavior, (c) enhanc-ing group productivity and collabora-tion, and (d) reducing conflict and uneven workload distribution among group members. Second, using force model of expectancy theory, we exam-ined the influential factors of a student’s motivation to participate in a peer eval-uation. We specifically examined whether a student’s motivation to partic-ipate is influenced largely by the per-ceived attractiveness of the peer evalua-tion or by his or her percepevalua-tion that his or her actions will reach the expected outcomes. We formulated two research propositions based on the above research objectives:
Proposition 1: The valence model can explain a student’s perception of the attractiveness of participation in a peer evaluation.
Proposition 2: The force model can explain a student’s motivation to partici-pate in a peer evaluation.
Method
Subject Selection
In this study, we used MBA and upper-level undergraduate business classes of three medium-size (15,000 to 20,000 total enrollment) universities.2All classes used problem-based collaborative learn-ing. The students were actively involved in group projects and were familiar with peer evaluation practices, so they were considered appropriate subjects for this study. We administered the instrument in a regularly scheduled class session to all the students who were present on that particular day. We explained the use of the instrument, read the instructions to the students, and asked them to complete the instrument. The entire process took between 15 and 20 minutes. We obtained 122 usable instruments (see Table 1 for the demographic information).
Experimental Design
The within-person or individual focus of expectancy theory suggests that appropriate tests of this theory should involve comparing measurements of the same individual’s motivation under dif-ferent circumstances (Harrell et al., 1985; Murky & Frizzier, 1986). In response to this suggestion, this study
TABLE 1. Summary of Demographic Information
Gender: Male/female 67/55
Average GPA 3.39
Means
Collaborative or team-based project experiencea 2.60
Perception about peers (group members)b 2.51
Impression toward peer evaluation systemc 0.60
Level of comfort in evaluating other studentsd 2.39
Agreement with students evaluating each othere 2.82
aThe answer to the question “In general, how would you describe your collaborative or team-based
project experience from this institution?” was on a scale ranging from –5 (very bad) to 5 (very good). bThe answer to the question “In general, how would you describe the peers (group mem-bers) you have had at this institution?” was on a scale from –5 (very bad) to 5 (very good). cThe answer to the question “What is your general impression about the peer evaluation system?” was on a scale from –5 (useless) to 5 (very useful). dThe answer to the question “How comfortable are you in evaluating other students’ performance?” was on a scale ranging from –5 (very uncomfort-able) to 5 (very comfortable). eThe answer to the question “Do you agree with having students evaluate each other in a collaborative or team-based project?” was on a scale ranging from –5 (strongly disagree) to 5 (strongly agree).
incorporates a well-established within-person methodology that was originally developed by Stahl and Harrell (1981) and was later proved valid by other studies under various circumstances (Geiger & Cooper, 1996; Snead & Har-rell, 1995). This methodology uses a judgment-modeling decision exercise that provides a set of cues, which an individual uses in arriving at a particular judgment or decision. Multiple sets of these cues are presented, each repre-senting a unique combination of strengths or values associated with the cues. A separate judgment is required from the individual for each unique combination of cues presented.
We employed a one-half fractional factorial design3 using the four out-comes of peer evaluations shown prior to the making of Decision A. This resulted in eight different combinations of the outcomes (24 x 1/2 = 8 combinations). We then presented each of the resulting eight combinations at two levels (10% and 90%) of expectancy to obtain 16 unique cases (8 combinations x 2 levels of expectancy = 16 cases). This fur-nished each participant with multiple cases that, in turn, provided multiple measures of each individual’s behavioral intentions under varied circumstances.4 This is a prerequisite for the within-person application of expectancy theory (Snead & Harrell, 1995).
In each of the 16 cases, we asked the participants to make two decisions. The first decision, Decision A, corresponded to the V in the valence model and repre-sented the overall attractiveness of par-ticipating in the peer evaluation, given the likelihood (Ik = 10% or 90%) that the four outcomes (Vk) would result from their participation. (The instructions and a sample case are provided in the Appen-dix). As mentioned earlier, the four out-comes are (a) determining peers’ grades, (b) improving peers’ performance and behavior, (c) enhancing group produc-tivity and collaboration, and (d) reduc-ing conflict and uneven workload distri-bution among group members. The second decision, Decision B, corre-sponded to F in the force model and reflected the strength of a participant’s motivation (or the level of effort a par-ticipant is willing to exert) to participate in the peer evaluation, using (a) the
attractiveness of the evaluation (V) obtained from Decision A and (b) the expectancy (E = 10% or 90%) that if the participant exerted a great deal of effort, he or she would be successful in provid-ing meanprovid-ingful or useful input to the evaluation process. We used an 11-point response scale with a range of -5 to 5 for Decision A and a range of 0 to 10 for Decision B. For Decision A, -5 sented “very unattractive” and 5 repre-sented “very attractive.” For Decision B, 0 represented “zero effort” and 10 repre-sented a “great deal of effort.”5
We used “Further Information” in the instrument to introduce the expectancy (E) factor of the experiment. In peer evaluations, it is quite common for open-ended questions to be enclosed to allow students to express an uncon-strained opinion about a particular aspect of a group member (peer) and/or the group in which they are involved. Such questions usually provide impor-tant diagnostic information and insight for the formative evaluation about the group member or the group. Although important, open-ended questions are more difficult to summarize and report. In “Further Information,” we explained to the participating student that despite his or her best effort, his or her feedback might not be helpful to the readers. Likewise, the data from multiple-choice questions could be difficult to interpret or meaningless if the questionnaire is designed poorly, the questions are ambiguous, or the evaluation is adminis-tered inappropriately. Therefore, despite making an effort, the student may not be successful in contributing meaningfully to the evaluation process. The students were reminded further that their participation in the evaluation was vol-untary and that they were free to decide to what extent they would participate. This added the necessary uncertainty (expectancy) about the reward of effort, as well as providing a feeling that the required effort could be considerable.
Results
Valence Model
Through the use of multiple regres-sion analysis, we sought to determine each student’s perception of the
attrac-tiveness of participating in the peer eval-uation. Decision A (V) served as the dependent variable, and the four second-level outcome instruments (Ik) served as the independent variables. The resulting standardized regression coefficients rep-resented the relative importance (attrac-tiveness) of each of the outcomes to each participant in arriving at Decision A. In Table 2, we present the mean adjusted R2 of the regressions and the mean stan-dardized betas of each outcome. We do not present detailed regression results for each participant, but these are avail-able from the authors.6
As indicated in Table 2, the mean R2 of the individual regression models was .7103. The mean R2represents the per-centage of total variation in responses, which is explained by the multiple regression. The relatively high mean R2 indicates that the valence model of expectancy theory explained much of the variation in students’ perception of the attractiveness of participating in a peer evaluation and thus supports Proposition 1.
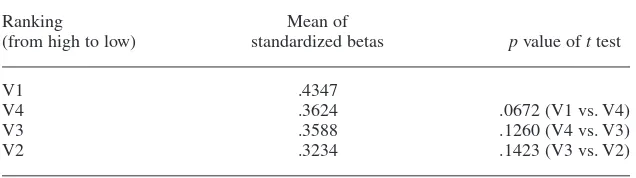
The standardized betas of V1, V2, V3, and V4 were all significant at the level of .05 for more than half of the students. This implies that all four of the outcomes tested were important factors to a majority of the students in their determination of the attractiveness of a peer evaluation system. Although all four factors were important, some factors were more important than oth-ers. It is the meanof these standardized betas that explains how students, on average, assess the attractiveness of potential outcomes resulting from a peer evaluation system. The partici-pants, on average, placed the highest valence on the outcome V1 and the sec-ond highest valance on the outcome V4. The other outcomes, in descending order of valence, were V3 and V2. These results imply that peer evaluation being used in determining peers’ grades (V1) is the most attractive outcome to students. Using peer evaluation in reducing conflict and uneven workload distribution among group members (V4) is the second most attractive out-come. Students, however, consider the use of peer evaluation results by stu-dents to enhance group productivity and collaboration (V3) and to improve
peers’ performance and behavior (V2) to be less important outcomes.
Force Model
We then used multiple regression analysis to examine the force model (Decision B) in the experiment. The dependent variable is the individual’s level of effort in participation in the peer evaluation (F). The two independent variables were (a) each student’s percep-tion about the attractiveness of the peer evaluation (V) from Decision A and (b) the expectancy information (E = 10% or 90%), which is provided by the “Further Information” sentence of the test instru-ment (see Appendix). We summarize the force model results in Table 3.
The mean R2(.7240) indicates that the force model sufficiently explains the stu-dents’ motivation for participating in the peer evaluation; therefore, it supports Proposition 2. The mean standardized regression coefficient F1 (.6136) indi-cates the impact of the overall attractive-ness of the evaluation (V), whereas F2 (.4808) indicates the impact of the expec-tation that a certain level of effort leads to successful contribution to the peer evalu-ation. Our results found a significant dif-ference between the mean standardized betas of F1 and F2. The pvalue of ttest was .0075. This result implies that the attractiveness of the peer evaluation sys-tem (F1) was more important to the stu-dent’s motivation than the likelihood that the student’s efforts would lead to suc-cessful contribution (F2). Students apparently are willing to exert effort if they find the peer evaluations (or out-comes of the peer evaluation) attractive to them. Their motivation, however, is less influenced by an inappropriately designed evaluation, even though it hin-ders students from providing valid or meaningful contribution and fails to bring about the expected outcomes.
Internal Validity Tests
We used Pearson’s Correlations between R2 values of valence and force models and selected demographic infor-mation (gender, GPA, impression toward collaborative learning, impression toward peers, perception about the peer evalua-tion system, the level of comfort in
eval-We asked the participants to evaluate the 16 hypothetical cases (peer evalua-tions) presented to them instead of the peer evaluations that they had experi-enced before. Therefore, the partici-pants’ backgrounds should not have affected their responses to these individ-ual cases. Nonsignificant correlations
TABLE 2. Valence Model Regression Resultsa
Panel A. Regression statistics
Frequency of significance
N M SD Range at .05 level
Adjusted R2 122 .7103 .1429 .2266 to .9720 119/122 (98%)
Standardized beta weight
V1 122 .4347 .3523 –.8510 to .9826 99/122 (81%) V2 122 .3234 .2063 .4440 to .7624 76/122 (62%) V3 122 .3588 .1907 –.0917 to .8578 78/122 (64%) V4 122 .3624 .1883 .2374 to .9019 78/122 (64%)
Panel B. Ranking of outcomes and equality tests on standardized betas
Ranking Mean of
(from high to low) standardized betas pvalue of ttest
V1 .4347
V4 .3624 .0672 (V1 vs. V4)
V3 .3588 .1260 (V4 vs. V3)
V2 .3234 .1423 (V3 vs. V2)
aResults (i.e., mean, standard deviation, range, and frequency of significant at .05) of individual
within-person regression models are reported in this table. V1 = valence of determining peers’ grades.
V2 = valence of improving peers’ performances and behaviors. V3 = valence of enhancing group productivity and collaboration.
V4 = valence of reducing conflict and uneven workload distribution among group members.
TABLE 3. Force Model Regression Resultsa
Frequency of significance
n M SD Range at .05 level
Adjusted R2 122 .7340 .1776 .0484 to .9823 119/122 (98%)
Standardized beta weight
F1 122 .6136 .2574 –.1333 to .9848 106/122 (87%) F2 122 .4808 .3063 –.1487 to .9912 81/122 (66%)
aResults (i.e., mean, standard deviation, range, and frequency of significance at .05) of individual
within-person regression models are reported in this table. F1 = weight placed on attractiveness of the peer evaluation.
F2 = weight placed on the expectancy of successfully participating in the peer evaluation.
uating peers, and the extent to which they agree with students evaluating each other) to test the associations between the empirical results and participants’ background. We measured the demo-graphic backgrounds, except for gender and GPA, by 11-point scale questions. The questions can be found in Table 1.
between participants’ background (i.e., gender, GPA, impression toward peers, perception about the peer evaluation system, etc.) and R2 values of valence and force models would indicate that the subjects are able to evaluate the pro-posed systems objectively without bias and thus would support our argument that the subjects that we used were appropriate for this study.
The last two columns of Table 4 pre-sent Pearson’s Correlations between R2 values of valence and force models and the participants’ demographic informa-tion. Of the 14 correlation coefficients, only one was significant (at the .05 sig-nificance level). This result supports our argument that the subjects were appro-priate for this study because neither their backgrounds nor their prior experi-ences with peer evaluations affected their perceptions of the evaluation sys-tems tested in the questionnaire.7
In Table 4, we also present correla-tions between demographic background measures. An interesting finding was that students who had more favorable collaborative learning experiences had more positive perceptions toward peers and toward peer evaluations. This result implies that students who consider peer evaluation to be more useful and
valu-able generally have more positive com-ments about their peers and have more favorable collaborative learning experi-ence. In addition, students who consid-ered peer evaluation to be more useful and valuable were more comfortable in evaluating other students’ perfor-mances, and more of those students agreed that having students evaluate each other in a collaborative learning environment was a beneficial process.
Limitations and Conclusions
Limitations
Our study had some limitations. First, the selection of subjects was not ran-dom. Students became subjects by virtue of being present on the day that their class was surveyed. The selection of classes was arbitrary. Consequently, caution should be used in the generaliza-tion of results to other groups and set-tings. Second, we used an experimental task in this study, gathering the subjects’ responses in a controlled environment rather than a real-world setting. Never-theless, completing a peer evaluation in a classroom and completing an instru-ment about peer evaluations in a class-room are similar activities. Third,
stu-dents were not given the opportunity for input on the outcomes that motivated them to participate in a peer evaluation. In the instrument, four possible out-comes were given to the students. It is possible that other possible outcomes of peer evaluations may have had a stronger impact on students’ motivations than the four outcomes used. Future research can solicit input from college students on what specifically they see or would like to see as the outcomes of an evaluation system. Fourth, we used the extreme levels of instrumentality and expectancy (10% and 90%) in the cases. This did not allow us to test for the full range within the extremes. In another sense, such extremes may not exist in actual practice. Fifth, subjects came from only one institution, which may limit the applicability of the results to other academic environments. Exten-sions can be made by future studies to examine the effect of academic environ-ments on the results of this study.
Concluding Remarks
The expectancy model used in this study provided a good overall explana-tion of a student’s motivaexplana-tion to partici-pate in the evaluation of peer
effective-TABLE 4. Pearson’s Correlation Coefficients (pvalues)
Adjusted R2 Adjusted R2
GPA EXP PER IMP COM AGR force valence
Gender .0259 .0561 .1096 –.0327 .0556 –.1672 –.0601 –.1497
(.7890) (.5392) (.2294) (.7205) (.5428) (.0656) (.5110) (.0999)
GPA .0374 –.0338 –.0414 –.0778 .0487 .0067 .0977
(.6892) (.7177) (.6573) (.4046) (.6024) (.9426) (.2326)
EXP .4801 .2759 .0398 .0778 .1181 .0898
(.0001) (.0021) (.6638) (.3947) (.1951) (.3255)
PER .2272 –.0068 –.1204 –.0128 –.0046
(.0119) (.9412) (.1865) (.8885) (.9604)
IMP .2913 .4147 .0449 .0892
(.0011) (.0001) (.6231) (.3287)
COM .4606 .0558 .1029
(.0001) (.5413) (.2250)
AGR –.0148 .2273
(.8714) (.0118)
GPA: grade point average.
EXP: collaborative or team-based project experience. PER: perception about peers (group members). IMP: impression toward peer evaluation system.
COM: level of comfort in evaluating other students’ performances. AGR: agreement with students evaluating each other.
ness. The valence model significantly explained student assessment of the attractiveness of a peer evaluation sys-tem. Further, the force model provided a good explanation of student motivation to participate in the peer evaluation. By the successful application of expectancy theory, this study provides a better understanding of the behavioral inten-tion (motivainten-tion) of students’ participa-tion in the peer evaluaparticipa-tion process.
Our empirical results show that the students have apparent preferences for the uses of peer evaluations. Because quality student participation is an essen-tial antecedent of the success of peer evaluations, this knowledge of student motivation must be considered thought-fully when the system is implemented. However, if students are kept ignorant of the use of peer evaluations, if peer evalu-ations are used for purposes that students do not value, or if they see no visible results from their participatory efforts, they will cease to give meaningful input. This research shows that students per-ceive determining peers’ grades as the most attractive outcome for the use of peer evaluation; reducing conflict and uneven workload distribution was the second most attractive outcome. Thus, students who believe that their feedback on peer evaluations will be considered in determining peers’ grades and will result in reduced conflict, uneven workload, or both should be highly motivated to pro-vide such feedback.
With the goal of motivating students to participate in the peer evaluation process, we make the following practi-cal suggestions. First, consider listing prominently the uses of the peer evalua-tion on the evaluaevalua-tion instrument. This will inform the students of its uses. If these uses are consistent with the uses that students prefer (and they believe that the evaluations will truly be used for these purposes), the students will assign a high valence to the evaluation system. The next step is to show stu-dents that their feedback really will be used. This will increase their tendency to perceive that the expected outcomes are likely on the evaluation. It would also increase their tendency to perceive that they will be successful in providing meaningful feedback, because they see that previous feedback has been used
successfully. Thus, their force or moti-vation to participate will be high. One way of showing students that their feed-back has been used successfully is to encourage instructors to cite on the course syllabus recent examples of how peer evaluations have helped enhance group productivity, improve peer per-formance and behavior, reduce conflict and uneven workload, and determine grades. This approach provides a low-cost but highly visible way to show stu-dents the benefits of peer evaluations. It may also have the salutary effect of encouraging faculty members to ponder the information contained in student evaluations and act on it.
NOTES
1. Collaborative learning refers to an instruc-tion method in which students at various perfor-mance levels work together in small groups toward a common goal. The students are responsi-ble for one another’s learning as well as their own (Gokhale, 1995).
2. We ran analyses for the MBA and upper-level undergraduate business classes separately and found no significant differences between the two groups. Thus, we presented only combined results in the results section.
3. According to Montgomery (1984, p. 325), “if the experimenter can reasonably assume that certain high-order interactions are negligible, then information on main effects and low-order inter-actions may be obtained by running only a frac-tion of the complete factorial experiment.” A one-half fraction of the 24 design can be found in Montgomery (pp. 331–334). Prior expectancy the-ory studies (Burton, Chen, Grover, & Stewart, 1992; Snead & Harrell, 1995) also used one-half fractional factorial design.
4. In a pilot test, we created two different instruments; each had the order of the cases deter-mined at random. We distributed the two instru-ments to every other student. We compared the average R2s from the two random order versions and found no significant differences between them. This result implies that there is no order effect in our experimental design.
5. The level of effort a student will apply in completing the peer evaluation could indicate the amount of thought given to responses, the desire to provide meaningful written comments to the open-ended questions, and the willingness to complete the evaluation form thoroughly. The expectancy theory models an individual’s motivation. The model uses each individual’s responses to measure or assess how that individual values the possible outcomes and how much effort the individual will exert toward achieving those outcomes. Conse-quently, all students do not need to have the same definition of what participation and effort mean.
6. We can be contacted at cheny@ohio.edu (Yining Chen) or lou@ohio.edu (Hao Lou).
7. It is reasonable to expect an association between someone’s prior experience with an evalu-ation system and his or her motivevalu-ation to participate in that particular system. However, the participants were asked to evaluate the 16 proposed cases (eval-uation systems) but not the system that they
experi-enced. Therefore, the insignificant correlations indicate that the subjects were able to evaluate the proposed systems objectively without bias, thus supporting our argument that the subjects whom we used were appropriate for this study.
REFERENCES
Ajzen, I., & Fishbein, M. (1980). Understanding attitudes and predicting social behavior. Engle-wood Cliffs, NJ: Prentice-Hall.
Barrett, R. S. (1996). Performance rating. Chica-go: Science Research Associates.
Beatty, J. R., Haas, R. W., & Sciglimpaglia, D. (1996). Using peer evaluations to assess indi-vidual performances in group class projects. Journal of Marketing Education, 18(2), 17–27. Brownell, P., & McInnes, M. (1986). Budgetary participation, motivation, and managerial per-formance. Accounting Review, 61(4), 587–600. Burton, F. G., Chen, Y., Grover, V., & Stewart, K. A. (1992). An application of expectancy theory for assessing user motivation to utilize an expert system. Journal of Management Infor-mation Systems, 9(3), 183–198.
Cederblom, D., & Lounsbury, J. W. (1980). An investigation of user acceptance of peer evalua-tions. Personnel Psychology, 33(3), 567–579. Cook, R. W. (1981). An investigation of student
peer evaluation on group project performance. Journal of Marketing Education, 3(1), 50–52. DeNisi, A. S., Randolph, W. A., & Blencoe, A. G.
(1982). Level and source of feedback as deter-minants of feedback effectiveness. Proceedings of the Academy of Management 42nd Annual Meeting (pp. 175–179), New York.
DeSanctis, G. (1983). Expectancy theory as expla-nation of voluntary use of a decision support sys-tem. Psychological Reports, 52(1), 247–260. Ferris, K. R. (1977). A test of the expectancy
the-ory as motivation in an accounting environ-ment. Accounting Review, 52(3), 605–614. Geiger, M. A., & Cooper, E. A. (1996). Using
expectancy theory to assess student motivation. Issues in Accounting Education, 11(1), 113–129. Ghorpade, J., & Lackritz, J. R. (2001). Peer eval-uation in the classroom: A check for sex and race/ethnicity effects. Journal of Education for Business, 76(5), 274–281.
Gokhale, A. A. (1995). Collaborative learning enhances critical thinking. Journal of Technolo-gy Education, 7(1), 22–30.
Goldfinch, J., & Raeside, R. (1990). Development of a peer assessment technique for obtaining individual marks on a group project. Assess-ment and Evaluation in Higher Education, 15(3), 210–231.
Gueldenzoph, L. E., & May, G. L. (2002). Collab-orative peer evaluation: Best practices for group
member assessments. Business Communication
Quarterly, 65(1), 9–20.
Haas, A. L., Hass, R. W., & Wotruba, T. R. (1998). The use of self-ratings and peer ratings to eval-uate performances of student group members.
Journal of Marketing Education, 20(3),
200–209.
Hancock, D. R. (1995). What teachers may do to influence student motivation: An application of
expectancy theory. The Journal of General
Education, 44(3), 171–179.
Harrell, A. M., Caldwell, C., & Doty, E. (1985). Within-person expectancy theory predictions of accounting students’ motivation to achieve
aca-demic success. Accounting Review, 60(4),
724–735.
Johnson, C. B., & Smith, F. I. (1997). Assessment of a complex peer evaluation instrument for
team learning and group processes. Accounting Education, 2(1), 21–40.
Kramer, J. F. (1990). Perceived similarity and accuracy of peer ratings. Journal of Education-al Psychology, 82(2), 213–218.
Levi, D., & Cadiz, D. (1998). Evaluating team work on student projects: The use of behav-iorally anchored scales to evaluate student per-formance. ERIC Document Reproduction Ser-vice, ED 424250.
Montgomery, D. C. (1984). Design and analysis
of experiments. New York: Wiley.
Morahan-Martin, J. (1996). Should peers’ evalua-tions be used in class projects? Quesevalua-tions
regarding reliability, leniency, and acceptance. Psychological Reports, 78(3), 1243–1250. Murky, D., & Frizzier, K. B. (1986). A
within-sub-jects test of expectancy theory in a public accounting environment. Journal of Accounting Research, 24(2), 400–404.
Sherrard, W. R., & Raafat, F. (1994). An empirical study of peer bias in evaluations: Students rat-ing students. Journal of Education for Business, 70(1), 43–47.
Smith, K. A. (1998). Grading cooperative projects. New Directions for Teaching and Learning, 74(2), 59–67.
Snead, K. C., & Harrell, A. M. (1995). An
appli-cation of expectancy theory to explain a man-ager’s intention to use a decision support sys-tem. Decision Sciences, 25(4), 499–513. Stahl, M. J., & Harrell, A. M. (1981). Modeling
effort decisions with behavioral decision theo-ry: Toward an individual differences model of
expectancy theory. Organizational Behavior
and Human Performance, 27(3), 303–325. Vroom, V. C. (1964). Work and motivation. New
York: Wiley.
Williams, D. L., Beard, J. D., & Rymer, J. (1991). Team projects: Achieving their full
potential. Journal of Marketing Education,
13(2), 45–53.
APPENDIX Instructions
As a student involved in collaborative or team-based projects, you are asked to evalu-ate the performance of your peers (group members). These peer evaluations may be used in various ways, such as determining peers’ grades, improving peers’ perfor-mance and behavior, enhancing group productivity and collaboration, and reducing conflict and uneven workload distribution.
This exercise presents 16 situations. Each situation is different with respect to how the peer evaluation is likely to be used. We would like to know how attractive participa-tion in such peer evaluaparticipa-tion is to you in each given situaparticipa-tion.
You are asked to make two decisions. You must first decide how attractive it would be for you to participate in the peer evaluation (Decision A). Next you must decide how much effort you would exert in completing the peer evaluation (Decision B). Use the information provided in each situation to reach your decisions. There are no “right” or “wrong” responses, so express your opinions freely. A sample situation is provided below. The 16 different situations start on the next page.
EXAMPLE QUESTIONNAIRE
The likelihood that your peer evaluation feedback: will be taken into consideration in determining
peers’ grades is ………...…………...……….…...… HIGH (90%) will be provided to individual group member in
improving his or her performance and behavior is ...………..…...… HIGH (90%) will be used to enhance productivity and collaboration
of the group in meeting its goal is ...…………...…...…...…...…...… HIGH (90%) will be used to reduce conflict and uneven workload
distribution among group members is ..…...…...…...…...…...…...…... LOW (10%) DECISION A:With the above outcomes and associated likelihood levels in mind, indicate the attractiveness to you of participating in the peer evaluation.
–5 –4 –3 –2 –1 0 +1 +2 +3 +4 +5
Very unattractive Very attractive
FURTHER INFORMATION:The peer evaluation contains several open-ended essay questions, which will require a great deal of effort for you to complete. (As you know, your participation in peer evaluations is voluntary. Thus you can choose to exert much effort in the hopes of providing meaningful feedback or at the other extreme you can do nothing.) If you exert a great deal of effort, the likelihood that the readers will find your feedback helpful is ………... LOW (10%) * DECISION B:Keeping in mind your attractiveness decision (DECISION A) and the FURTHER INFORMATION, indicate the level of effort you would exert to partici-pate in the peer evaluation.
0 1 2 3 4 5 6 7 8 9 10
Zero effort Great deal of effort
* Despite your best effort to articulate your feelings, the peers may misinterpret your feedback. Even the responses to multiple-choice questions are difficult to interpret when the questions are designed poorly.