Full Terms & Conditions of access and use can be found at
http://www.tandfonline.com/action/journalInformation?journalCode=cbie20
Bulletin of Indonesian Economic Studies
ISSN: 0007-4918 (Print) 1472-7234 (Online) Journal homepage: http://www.tandfonline.com/loi/cbie20
Indonesia's missing multinationals: business
groups and outward direct investment
Michael Carney & Marleen Dieleman
To cite this article: Michael Carney & Marleen Dieleman (2011) Indonesia's missing multinationals: business groups and outward direct investment, Bulletin of Indonesian Economic Studies, 47:1, 105-126
To link to this article: http://dx.doi.org/10.1080/00074918.2011.556058
Published online: 15 Mar 2011.
Submit your article to this journal
Article views: 557
View related articles
ISSN 0007-4918 print/ISSN 1472-7234 online/11/010105-22 © 2011 Indonesia Project ANU DOI: 10.1080/00074918.2011.556058
* mcarney@jmsb.concordia.ca; marleen@nus.edu.sg. We thank the editor and two anony-mous reviewers for their constructive and insightful comments on an earlier version of this manuscript. Michael Carney acknowledges the inancial support of the Canadian Social Science and Humanities Research Council, and Marleen Dieleman that of the Singapore Ministry of Education‘s Tier 1 Grant R-313-000-079-112.
INDONESIA’S MISSING MULTINATIONALS:
BUSINESS GROUPS AND OUTWARD DIRECT INVESTMENT
Michael Carney* Marleen Dieleman*
Concordia University, Montreal National University of Singapore
Some countries produce more multinational enterprises (MNEs) than others. India and China, in particular, have produced a number of dynamic MNEs whose success abroad generates important economic beneits for the home economy. Motivated by this observation, we describe the internationalisation record of Indonesia’s ma-jor business groups. Using an archival analysis method, we ind that, with a few exceptions, Indonesia’s largest business groupings focus predominantly upon the domestic market. We advance two explanations for this investment pattern. The irst suggests that the apparent absence of Indonesian MNEs is an accounting er -ror, because irms’ outward investment is under-reported in oficial statistics. The second suggests that Indonesian outward foreign direct investment is impeded by a combination of institutional and irm-level factors that arrest the internationalisa -tion of all but the largest irms. We discuss the policy implica-tions of these indings and relect on their theoretical implications.
INTRODUCTION
Multinational enterprises (MNEs) from Asian countries such as India and China are becoming major players in the globalised world economy, and their recent dynamism has attracted much attention from scholars (for example, Buckley et al. 2007). Economists and management scholars agree that outward direct invest-ment (ODI) by emerging market MNEs strengthens their competitive advantage
and provides their countries of origin with a number of economic beneits, includ -ing improved export performance and access to foreign technology (UNCTAD 2006). Low ODI may signal lagging international competitiveness, and is there-fore of potential concern to policy makers. Research to date has focused almost exclusively on emerging markets that produce successful MNEs; scant attention has been given to explaining why some emerging markets engender relatively
few multinational irms.
Indonesia’s record is somewhat unclear in this regard. Research suggests
especially those owned and controlled by Chinese Indonesians (Liu 2001; Sato
1993). Yet oficial statistics show that Indonesia has produced few substantial MNEs. In the past ive years, it did not have a single irm in the top 100 non-inancial transnational corporations from developing countries, according to an
annual ranking published by the United Nations Conference on Trade and Devel-opment (UNCTAD).1 The latest list, released in 2010, shows Singapore as having seven representatives, Malaysia six and both Thailand and the Philippines one
irm each. In irm-level data on the number of new overseas greenield invest
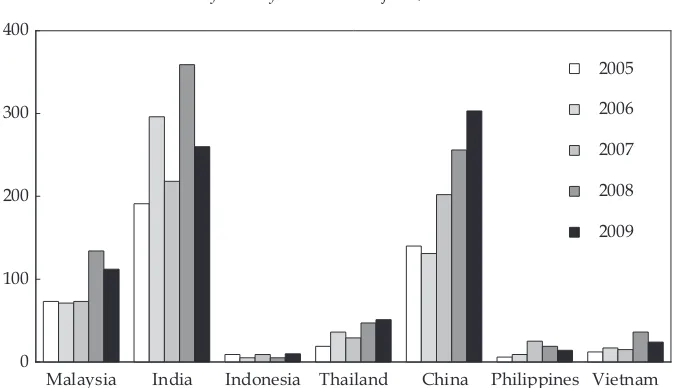
-ments undertaken in the past ive years, Indonesia almost fails to register, its score
dwarfed by those of the big players in the region – India, China and Malaysia –
and well below the scores of Thailand, Vietnam and the Philippines (igure 1).2 In short, these metrics point to a relatively modest international investment record on Indonesia’s part.
Opinion is divided on how to interpret Indonesia’s ODI statistics. Indonesian
oficials often point to the idiosyncrasies of their economy and stress disadvan
-tages of ODI such as capital light and tax evasion. Oficials also assume that ODI
metrics under-estimate actual outward investment because some Indonesian
irms are thought to misreport or understate their foreign investments. Conse
-quently, the international performance of Indonesian irms is dificult to measure,
1 This list (‘Largest Transnational Corporations’, published as an annex table to the an-nual World Investment Report) is available at <http://www.unctad.org/Templates/Page. asp?intItemID=2443&lang=1>. It identiies the world’s largest multinational irms on the basis of their foreign assets, sales and employment, derived from annual reports.
2 The city-states of Singapore and Hong Kong are excluded from igure 1 (and igure 2, below) because their ODI data are inlated by pass-through investments that originate in other countries.
FIGURE 1 Number of Greenield ODI Projects, Selected Countries in Asia
Malaysia India Indonesia Thailand China Philippines Vietnam 0
100 200 300 400
2005
2006
2007
2008
2009
and the appropriate stance of the Indonesian government on ODI policy remains
unresolved. Improved understanding of Indonesian irms’ ODI performance can
inform the policy debate on whether the governments of Indonesia and other emerging market countries should implement policies to accelerate or otherwise
inluence their ODI.
We contribute to this debate by documenting the internationalisation patterns of Indonesia’s largest business groups and developing plausible explanations for
them. To do so we use an archival analysis method that identiies ODI activi -ties (hereafter ‘occurrences’ or ‘cases’) undertaken by Indonesia’s largest
busi-ness groups over a 13-year period. Whereas oficial statistics give an aggregated overview of ODI, the contribution of our methodology is to provide ine-grained insight into the international investment record of speciic irms. We focus upon the ODI of irms afiliated with 25 of Indonesia’s largest business groups, because
we expect them to be the best endowed with the resources necessary for inter-national expansion. We begin with a brief review of evidence and theory on emerging economy ODI. We then outline some shortcomings of ODI accounting
in Asia’s emerging markets. We report our internationalisation indings on Indo -nesian business groups and suggest two explanations. Our conclusion discusses implications for policy and theory.
FDI AND ODI IN ASIA
In recent decades Asia’s industrialising states have embraced inward foreign direct investment (FDI) as part of their industrial policy programs. States such as China, South Korea, Malaysia, Thailand and Singapore have offered generous investment incentives to foreign MNEs to boost economic development. Since the early 1970s Indonesia too has made its foreign investment rules more accommo-dating, albeit with occasional back-tracking (Hofman, Zhao and Ishihara 2007). On the other hand, industrialising states have been more circumspect about the promotion of outward direct investment by domestic irms, because of concerns
about capital light and tax evasion, and the fear that ODI ‘hollows out’ domestic
industry by transferring jobs to other countries.
ODI can beneit the originating country’s economy only if it has a positive impact on the performance of the parent irm undertaking a foreign project. There are both risks and beneits associated with ODI. The risks include unfavourable
movements in exchange rates, failure to understand foreign business practice and cultures, and additional managerial costs associated with coordinating
geograph-ically dispersed operations. Realisation of ODI’s potential beneits will depend upon the parent irm’s objectives and its organisational capabilities. Scholars and
policy analysts typically distinguish three possible motives for undertaking ODI:
to increase eficiency, to acquire assets or to gain new markets. Eficiency-seeking
ODI is directed at accessing low-cost inputs such as cheap labour and materials. Asset-seeking ODI is directed at the acquisition of technology, marketing skills, research and development (R&D) laboratories and distribution facilities that are
unavailable in the home market but can improve the parent irm’s competitive
capabilities. Market-seeking ODI is aimed at generating revenues in foreign
mar-kets; its occurrence assumes that the parent irm possesses a proprietary capabil
can improve the irm’s performance by lowering its costs, increasing its competi -tiveness or providing additional revenues.
There has been something of a sea change in the importance that states attach to having their own MNEs. Recent statistics report a surge in ODI from emerg-ing economies, most of it originatemerg-ing in Asia (UNCTAD 2006). States increasemerg-ingly recognise ODI’s potential to enhance the international competitiveness of domestic
irms. They also perceive that accelerating the development of local MNEs can
improve competitiveness within the domestic market, because knowledge of international best practice and technological know-how can spill over and be dif-fused through linkages with local suppliers and competitive imitation by rivals. Foreign technology and practice are often more valuable in the hands of domestic
irms, whose superior local knowledge allows modiication to it domestic condi -tions (Szulanski 1996). Market-seeking ODI is critical to consolidating export sales
and market expansion. It helps irms to develop international networks and rela -tionships through which they can initiate activities, rather than serving merely as dependent sub-contractors at the periphery of international value chains. Lecraw
(1993) suggests that Indonesian irms engaging in ODI improved both their man
-agement expertise and their export performance to a greater extent than irms that
did not make such investments.
Concern that ODI results in the loss of domestic employment may not be
justi-ied. Evidence from emerging markets in fact suggests that ODI has a marginally
positive impact upon aggregate employment levels (UNCTAD 2006: 189). Lost
jobs are more closely associated with eficiency-seeking ODI, such as occurs when parent irms seek cheaper labour abroad. Emerging market MNEs are unlikely to undertake eficiency-seeking ODI because of the continuing availability of
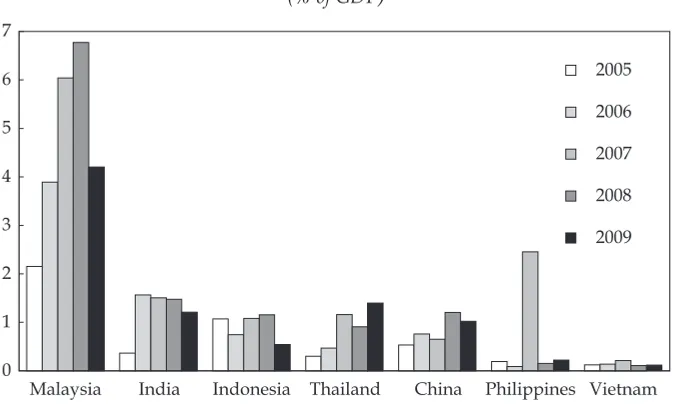
FIGURE 2 Outward Direct Investment, Selected Countries in Asia (% of GDP)
Malaysia India Indonesia Thailand China Philippines Vietnam 0
1 2 3 4 5 6 7
2005
2006
2007
2008
2009
low-cost domestic labour. They are more likely to undertake asset-seeking ODI projects, which generally have a positive impact on employment levels at home.
While Indonesia’s inward FDI performance is not particularly strong (Lipsey and Sjoholm 2011, in this issue), its ODI record appears even less so from the data presented above. Nevertheless, if we look at aggregate ODI scaled by GDP,
Indonesia seems to be on a par with other emerging Asian economies (igure 2).
When ODI is measured relative to economy size, Malaysia emerges as a clear front-runner during the years 2005–09. There is little to differentiate India, Indo-nesia, Thailand and China, although this group is well in front of the Philippines (in most years) and Vietnam.
THEORETICAL APPROACHES TO ODI FROM EMERGING MARKETS Research on emerging market MNEs has been under way for several decades. More recently, the emergence of Chinese and Indian multinational enterprises has given new impetus to this research stream. One point of consensus in the research is that the international activity of MNEs from advanced countries is attributable to the creation and leverage of proprietary technological and organisational capabilities that drive their market-seeking ODI. By contrast, scholars believe that irms from
emerging markets typically lack the irm-speciic advantages required to compete
successfully in international markets. This is because economic and competitive
conditions in the home country provide few country-speciic advantages conducive
to the development of world-class organisational and technological competence.
The consensus of research on emerging market MNEs is that many irms inter -nationalise for asset-seeking reasons – that is, to acquire resources and competen-cies that are unavailable locally (Luo and Tung 2007). Child and Rodrigues (2005)
suggest, for example, that Chinese irms’ international strategies seek to address competitive disadvantage. To bring their skills up to par, irms must invest con -siderable resources in learning, either through the formation of strategic partner-ships or through the gradual accumulation of skills, information and technologies
(Hobday 1995). To the extent that emerging market irms can leverage their com -petencies in foreign markets, scholars think that these skills are derived from the capacity to manage in harsh or corrupt environments (Cuervo-Cazzura and Genc 2008). Such capacities are of less value in more advanced markets, however.
Aside from irm-speciic factors, external factors such as home-country insti
-tutions also inluence ODI (Peng, Wang and Jiang 2008). Advanced economies typically beneit from a functioning matrix of institutions, comprising enforceable contracts, government regulation and eficient capital markets. They also possess a
diverse array of specialised institutions, such as standards committees,
accredita-tion agencies, consumer watchdogs, market research irms, executive recruitment
agencies, business schools and vocational training institutes, that facilitate market transactions. Niskanen (1991: 233) has described these institutions as the ‘soft infra-structure of the market economy’. In contrast, many emerging markets are charac-terised by extensive institutional and market failures – conditions that management
and inance scholars refer to as ‘institutional voids’ (Khanna and Palepu 1997).
However, scholars disagree about whether institutional voids are an asset or
a liability for the internationalisation of irms. On the one hand, institutional
create negative perceptions of a country’s enterprises that inhibit their foreign
expansion, while institutional voids in capital markets can deprive irms of the
resources needed to pursue international opportunities.
On the other hand, institutional voids can stimulate the formation of MNEs if
they facilitate the emergence of large diversiied business groups. Diversiied busi -ness groups can arise and thrive in emerging markets because of their capacity to
ill institutional voids and correct market failures. Business groups that attain suf
-icient scale can do this by substituting for missing soft market infrastructure, and can provide their afiliates with resources such as capital, experienced manage
-ment, inance, technology, and marketing and political lobbying services (Khanna and Palepu 1997). Compared with free-standing irms, the afiliates of large busi -ness groups enjoy considerable advantages in assembling the resources needed to pursue international opportunities.
Institutional voids can also stimulate foreign expansion if they cause domestic
irms to lee home-country conditions. For instance, weak intellectual property protection and a lack of venture capital may drive small high-technology irms to
internationalise in order to gain access to foreign capital markets and better legal protection for their intellectual property (Yamakawa, Peng and Deeds 2008). Simi-larly, political risks and the threat of expropriation in volatile emerging markets
may drive irms to invest abroad (Witt and Lewin 2007). In summary, much exist
-ing research suggests that emerg-ing market irms internationalise both because of
and in spite of home-country conditions.
Both institutional voids and business groups are a feature of Indonesia’s
busi-ness environment, and there are incentives for Indonesian irms to engage in ‘insti -tutional escape’. World Bank indicators of government effectiveness, regulatory quality, rule of law and ability to control corruption reveal Indonesia to have
sig-niicantly negative coeficients of state governance capacity (Kaufmann, Kraay and
Mastruzzi 2007). World Economic Forum indices show that Indonesia ranks low
on factors such as goods market eficiency, inancial market sophistication, techno -logical readiness and protection of property rights. For instance, on a measure of intellectual property protection, Indonesia ranks 102nd in a survey of 134 countries (Schwab and Porter 2008). In both Indonesia and Malaysia, government discrimina-tion against business people of Chinese descent may also spur internadiscrimina-tionalisadiscrimina-tion.
In view of the rise in ODI from emerging markets in the last decade, the
litera-ture tends to focus primarily on why irms internationalise (drivers) rather than
on what obstacles might prevent them from competing in global markets (inhibi-tors). Our contribution is to complement existing literature by looking at the interplay between institutional and organisational factors that enable and inhibit
internationalisation, and at how these factors affect different irms. In doing this we help to explain why some irms fail to internationalise. In combination, theo -ries of institutional drivers and institutional obstacles promise to offer a more
bal-anced account of the globalisation of irms from emerging markets.
ACCOUNTING FOR ODI IN EMERGING MARKETS
Scholars typically use aggregate statistics such as the volume of annual inward
and outward FDI lows to assess a country’s international investment perfor
sales derived from overseas or the percentage of assets located outside the home
country. However, oficial statistics on ODI collected by organisations such as the OECD and the United Nations, and used to construct country-level and irm-level
indices of internationalisation, do not necessarily provide an accurate picture of
ODI from emerging markets. These statistics may signiicantly over- or
under-estimate the true level of ODI, because they fail to take account of institutional
factors and irm practices in such markets.
One indication of over-estimation is that a small number of emerging
econo-mies are responsible for a very high share of ODI outlows. For example, in 2005
just four economies (Hong Kong, the British Virgin Islands, Russia and Singa-pore) accounted for 60% of the stock of ODI from developing and transition econ-omies (UNCTAD 2006). Much of this presumed investment may be statistically
inlated by the phenomenon of ‘round tripping’ – a term that refers to capital out
-lows channelled offshore into special-purpose entities that subsequently return
the funds to the economy of origin, usually to take advantage of inward foreign investment incentives.
Oficial statistics may also understate the extent of emerging economy ODI. Oficial statistics on ODI are founded on the assumption of direct or indirect
ownership of subsidiaries, associate companies and branches by a common
par-ent (OECD 1999). This assumption may be invalid if irms display fragmpar-ented ownership or if they achieve control over foreign irms by non-ownership means.
Firms in emerging markets are often organised as business groups whose inter-organisational linkages are not necessarily characterised by legal ownership, but whose members are integrated through a variety of other social and
infor-mal mechanisms (Khanna and Palepu 1997). Business group afiliates located in different national jurisdictions may transfer resources to other afiliates through
devices such as related-party transactions (Cheung, Rau and Stouraitis 2006). In addition, investment and trade are often conducted through ethnic and family
networks in a manner that blurs the origin and destination of capital lows (Rauch 2001). To the extent that ODI statistics relect ownership assumptions that are not apposite in Asia, they may under-estimate the true extent of irms’ international
activities.
In much of Asia, a substantial proportion of a country’s largest publicly listed
irms are afiliated with a business group (La Porta, Lopez-de-Silanes and Shleifer 1999). In Indonesia the igure is almost 70% (Claessens, Djankov and Lang 2000). This fact poses a considerable empirical challenge, because capital lows among afiliates are often non-transparent. In emerging markets, institutional voids such as weak property rights and ineficient contract enforcement result in little sup
-port for transactions, and irms come to rely on informal arrangements such as
family ties, government connections and business group structures to support transactions with their business partners. As in other emerging markets, many
Indonesian irms have become afiliated to business groups with pyramidal and
opaque corporate governance structures that are believed to facilitate and obscure
inter-irm resource exchanges (Morck and Yeung 2003). Pyramidal structures and weak disclosure standards suggest that the inancial data disclosed by individual
companies may paint a misleading picture of the disposition of their assets. This
means that irm-based measures of internationalisation, such as those used to
may not accurately relect the true international scope of irms afiliated with
Indonesian business groups. Moreover, many Indonesian outward foreign invest-ments might not be initiated by publicly listed companies. Families have an incen-tive to maximise control over foreign currency management within the group, because transactions would be subject to restrictions if a listed company were involved.
It is generally believed that oficial statistics on Indonesia’s FDI and ODI suffer from several shortcomings (Hattari and Rajan 2008). Most experts consider oficial ODI igures to be understated. Indeed, our interviews suggest that Indonesia’s
large business groups face incentives to ‘hide’ their foreign investments. Because the owners of most of the large business groups are of Chinese descent, ODI car-ries the stigma of disloyalty to Indonesia, and is often portrayed negatively in the Indonesian press. To avoid problems, large business group owners often set up platforms in Hong Kong or Singapore from which internationalisation is pursued.
Such activities prevent the foreign investments from being reported in oficial
Indonesian statistics.
ARCHIVAL ANALYSIS METHODOLOGY
We used a qualitative archival analysis method to obtain data that complement
oficial macro-level and irm-level statistics – namely, the systematic collection
and coding of published news sources. We focused on business groups because
most Indonesian irms operate as part of a group. In addition, UNCTAD’s annual
list of the world’s largest transnational companies from developing countries (see footnote 1) shows that many of the emerging market MNEs are business groups. We began by identifying the largest business groups in Indonesia, and then docu-mented cases of their internationalisation using a database of worldwide news articles. To contextualise our results and facilitate explanation, we conducted background interviews with several bankers and executives from the Jakarta business community.
First, we identiied Indonesia’s top 25 domestic privately owned business
groups. Because most such groups are owned by families, we were able to esti-mate the approxiesti-mate size of the business groups from reports of family wealth. We constructed a list of the largest groups in the country using the following four sources: a report on Indonesia’s largest business groups developed by the global
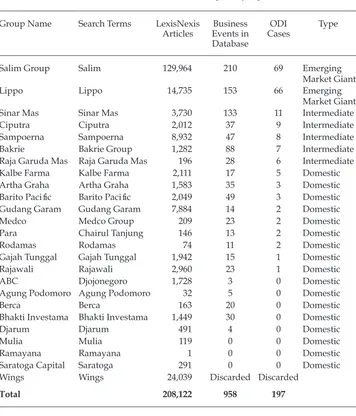
inancial services irm UBS (UBS Investment Research 2006); a report on Indo -nesia’s 40 richest families in the Forbes international business magazine; the Sep-tember 2007 issue of the Indonesian business magazine Globe Asia, which included a list of the top business groups (pp. 32–128); and the August 2007 issue of Globe Asia, which contained a list of Indonesia’s richest individuals (pp. 29–136). We limited ourselves to the top 40 from each source. (The UBS report did not rank the groups.) The sources agreed on the 15–20 main groups, diverging more in relation to the smaller groups. On the basis of size and inclusion in multiple sources, we selected 25 business groups. Table 1 presents our list of business groups and gives details of their treatment in the Forbes and Globe Asia lists.
TABLE 1 Indonesia’s Largest Business Groupsa
Group Namea Family/CEO Name Globe Asia (G) Forbes (F)
People
Raja Garuda Mas Sukanto Tanoto & family
6 11 2.00 1.30 2.80 1
Sampoerna Putera Sampoerna & sons
5 6 3.30 2.20 2.10 2
Sinar Mas Widjaja family 3 3 4.50 3.10 2.00 3 Gudang Garam Wonowidjojo family 2 7 2.90 3.50 1.80 4 Djarum Hartono family 1 5 3.50 4.20 1.40 5 Wings Kattuari family/ Bakrieb Bakrie family 8 8 2.80 1.05 1.20 6
Agung Podomoro Haliman family 20 27 0.60 0.51 0.90 8 Medcob Ariin Panigoro 9 22 0.81 0.90 0.82 9
Salim Salim family 4 2 6.95 2.80 0.80 10 Lippo Riady family 14 9 2.50 0.59 0.57 11 Rajawali Peter Sondakh 19 25 0.72 0.51 0.53 12 Barito Paciic Prajogo Pangestu
& family
17 20 1.10 0.53 0.51 13
Ramayanac Tumewu family 24 34 0.50 0.40 0.44 14
Bercac Murdaya Po
& family
27 n.a. n.a. 0.35 0.43 16
ABC Djojonegoro family 16 12 1.90 0.56 0.36 17 Parab Chairul Tanjung
& family
15 31 0.53 0.57 0.31 18
Gajah Tunggal Sjamsul Nursalim & family
21 21 1.10 0.45 0.30 21
Saratoga Capitalc Edwin Soeryadjaja 18 13 1.60 0.52 0.23 23
Rodamas Tan family 25 39 0.42 0.38 0.20 27 Ciputra Ciputra family 30 57 0.24 0.34 0.15 30 Kalbe Farma Benjamin Setiawan/
F.B. Aryanto
11 24 0.73 0.65 0.12 34
Artha Graha Tomy Winata (F)/ Sugianto Kusuma (G)d
38 70 0.18 0.28 0.11 35
Mulia Gunawan Tjandra 37 48 0.31 0.28 0.08 40 Bhakti Investama Harry
Tanoe-soedibyo
10 29 0.57 0.82 n.a. n.a.
a ‘n.a.’ = not available. Group order (col. 1) is based on family worth as reported in Forbes magazine.
The list excludes state-owned groups, foreign multinationals, and domestic groups majority-owned by
foreign irms. See text for further explanation of the method and sources used in compiling this table.
b Non-ethnic Chinese ownership. c Not on UBS list. d F: Forbes; G: Globe Asia (people ranking).
Indonesia and/or in the country receiving the investment. The use of each group’s name as a keyword elicited a considerable number of articles for each of the top 25 groups (table 2). To deepen the pool of articles on each group’s activities, we per-formed complementary searches using the names of group owners and of
promi-nent group-afiliated companies.
Third, we conducted a content analysis using a coding procedure recom-mended by Boyatzis (1998) and used in an Indonesian context by Dieleman and
Sachs (2008). We irst condensed the raw data into ‘business events’ – discrete
strategic decisions taken by a focal company. Examples of such events include starting a new line of business; forming a strategic alliance; exiting a business; initiating a merger; and expanding production capacity (either in Indonesia or abroad). Events that were a continuation of an already existing line of business, such as the introduction of a new brand or the upgrading of an existing manu-facturing plant, were not taken into account. Between 1994 and 2006 – a period
of some 13 years – we identiied a total of 958 business events for our sample. We
selected 1994 as a starting point because before that year our database contained too few events for most of the top 25 companies in the list.
Fourth, to determine a business group’s international activities we employed a simple count of occurrences of ODI in the reported business events, using
pres-ence/non-presence coding (Boyatzis 1998), and identiied 197 unique ODI cases
and their destinations. In this way we created a 13-year inventory of outward foreign investments by large Indonesian business groups. The use of presence/
non-presence coding does not enable us to assess the importance of any speciic
ODI occurrence, but this can be done by going back to the original rich data about each event and interpreting a series of separate events as an emergent pattern. The richer underlying data were used to formulate explanations for our results, which now follow.
Our archival analysis methodology has some shortcomings. Not all foreign investments are reported in news media articles, which typically show a bias toward the reporting of large investments. As with all sources, news articles can only partially resolve the problem of non-disclosure of foreign investments. For example, conversations with members of the Jakarta business community suggest the existence of substantial foreign investments that have gone unreported in the news media. Consequently, we suspect that our data could be biased, because some groups have adopted non-disclosure policies in their corporate communications. Despite these evident shortcomings, we propose that our data, in combination with
existing macro-level and irm-level statistics, provide a fuller and more accurate
depiction of Indonesian business groups’ ODI activities than has existed hitherto.
RESULTS
Limited internationalisation
The data in table 2 suggest that Indonesian business groups have little appetite for international activity. Of the 24 largest groups, most have hardly ventured abroad in the past 13 years. Our results (column 5) show that eight groups (33%) display no internationalisation at all – at least in a manner that is captured by our methodology. A similar proportion display only a very limited degree of international activity. In general, groups with no foreign investments tend to be relatively small.
We labelled groups with more than 30 cases of ODI over the 13 years ‘emerging market giants’; those with 6–30 ODI cases ‘intermediate’ (intermediately
inter-nationalised) groups; and those with ive ODI occurrences or fewer ‘domestic’
TABLE 2 ODI Occurrences by Company
Group Name Search Terms LexisNexis Articles
Business Events in Database
ODI Cases
Type
Salim Group Salim 129,964 210 69 Emerging Market Giant
Lippo Lippo 14,735 153 66 Emerging
Market Giant Sinar Mas Sinar Mas 3,730 133 11 Intermediate
Ciputra Ciputra 2,012 37 9 Intermediate
Sampoerna Sampoerna 8,932 47 8 Intermediate Bakrie Bakrie Group 1,282 88 7 Intermediate Raja Garuda Mas Raja Garuda Mas 196 28 6 Intermediate Kalbe Farma Kalbe Farma 2,111 17 5 Domestic Artha Graha Artha Graha 1,583 35 3 Domestic
Barito Paciic Barito Paciic 2,049 49 3 Domestic
Gudang Garam Gudang Garam 7,884 14 2 Domestic
Medco Medco Group 209 23 2 Domestic
Para Chairul Tanjung 146 13 2 Domestic
Rodamas Rodamas 74 11 2 Domestic
Gajah Tunggal Gajah Tunggal 1,942 15 1 Domestic
Rajawali Rajawali 2,960 23 1 Domestic
ABC Djojonegoro 1,728 3 0 Domestic
Agung Podomoro Agung Podomoro 32 5 0 Domestic
Berca Berca 163 20 0 Domestic
Bhakti Investama Bhakti Investama 1,449 30 0 Domestic
Djarum Djarum 491 4 0 Domestic
Mulia Mulia 119 0 0 Domestic
Ramayana Ramayana 1 0 0 Domestic
Saratoga Capital Saratoga 291 0 0 Domestic Wings Wings 24,039 Discarded Discarded
Total 208,122 958 197
groups. This classiication is arbitrary, but table 2 shows that two groups are
clearly outliers, with over 60 ODI occurrences each; there is a small cluster of intermediately internationalised companies, and a large group of companies
with hardly any ODI occurrences. Based on this classiication, only two groups
(Salim and Lippo) can be considered as emerging market MNEs, and these two groups are in fact closely related (historically, at least): the founder of the Lippo Group (Mochtar Riady) worked for the founder of the Salim Group (Liem Sioe
Liong) before striking out on his own. Only seven groups had more than ive ODI
occurrences over the 13-year period. This low level of internationalisation is in
marked contrast with what is revealed by the literature on ethnic Chinese irms
from Southeast Asia: they are typically portrayed as transnational empires that invest extensively in the region and in China (Yeung 2004). Given that all but three
groups in our sample (identiied in table 1, note b) are controlled by families of
Chinese descent, with two notable exceptions our research does not support the notion of these families running ‘transnational’ enterprises in the Indonesian case. Rather, table 2 suggests that a substantial category of large Indonesian business groups is focused almost exclusively on the domestic market.
If we compare our results with ODI statistics on Indonesia, there are evident discrepancies. In 2006 alone we recorded 18 foreign investments for the Lippo
group. Returning to the original news articles to assess the signiicance of these
investments, we found that Lippo’s media-reported investments summed to
almost $2 billion, whereas Indonesia posted total oficial ODI of $2.7 billion in
2006. While Lippo is a large group, it seems unlikely that it alone accounted for almost all of Indonesia’s ODI in that year. This example suggests that errors in
either or both igures are likely, because oficial statistics under-estimate ODI and
because reported investments may not match actual investments.
Notwithstand-ing these discrepancies, our data appear to point in the same direction as the ofi -cial statistics, in the sense that we found relatively limited ODI among Indonesia’s largest business groups.
Distribution of ODI occurrences
The ifth column of table 2 shows the distribution of the 197 cases of ODI by com -pany. Salim and Lippo account for almost 70% of the reported ODI occurrences, suggesting that these are by far the most internationally active of the Indonesian business groups (with the caveat that we are focusing on events, and not on money amounts). The news reports show that these groups have established footholds in Hong Kong and Singapore, diversifying internationally from there. In fact, one
Salim Group irm, First Paciic Company, even made it into the UNCTAD top 100 non-inancial transnational companies from developing countries (see footnote 1), listed as a irm from Hong Kong. A third group, Sinar Mas, displays a similar pat -tern, albeit on a much smaller scale. All three groups control listed companies in Singapore, and have appointed second-generation family members as executives responsible for directing the internationalisation of their group’s activities. By locating their international activities in a foreign jurisdiction, these groups can to some extent disguise their ODI activities so as to avoid charges of taking capital out of Indonesia. Consequently, their foreign investments are unlikely to turn up
ODI destinations
Figure 3 provides the destinations of Indonesian business groups’ ODI. The pat-tern of investments shows that most groups are primarily regional rather than
global players – a phenomenon that has been documented for other Asian irms
(Collinson and Rugman 2007).
The primary destinations of Indonesian ODI are China, Singapore, Australia, India, the Philippines, Malaysia and Vietnam – Australia being the only devel-oped country destination of any importance. The high levels of investment in China and India are not surprising, given the size of these economies and their rapid rates of growth. The literature on ethnic Chinese family groups suggests that Chinese Indonesians may be inclined to invest in their ancestral country – another factor that may also play a role.
Much of Indonesia’s ODI is destined for other emerging markets,
includ-ing those in East and Southeast Asia. Some irms have invested in more distant
markets in Latin America (Raja Garuda Mas), Africa (Kalbe Farma), the Middle East (Bakrie, Salim) and Central Asia (Bakrie, Salim). These trends are consistent
with the suggestion that emerging market irms are more likely to invest in other
emerging markets, because of their common institutional characteristics
(Cuervo-Cazurra and Genc 2008). For example, Buckley et al. (2007) ind that Chinese irms invest heavily in countries characterised by high political risk, suggesting that Chinese MNEs may enjoy an advantage in managing dificult institutional
contexts.
China
Singapore Other/unknown
EU & US Australia Philippines
India Malaysia
Vietnam
FIGURE 3 Indonesia’s ODI Destinations (cumulative, 1994–2006)
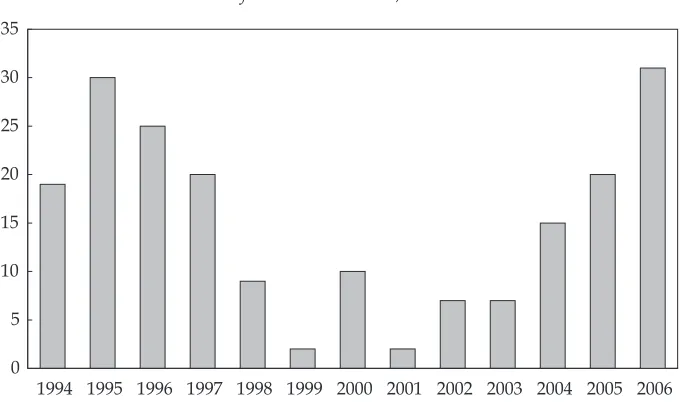
Time trends
Our data show that signiicant luctuations in ODI are likely to be related to the business cycle (igure 4). The decline in 1996 may have been a harbinger of the Asian inancial crisis of 1997–98, during which ODI fell to very low levels. More
recently, ODI has shown a strong positive trend. However, given the results dis-cussed above, this may be driven primarily by a small number of increasingly
global irms. It obscures the prevailing reality that ODI is limited in the majority of
Indonesia’s large business groups.
EXPLAINING INDONESIA’S MISSING MNEs
Relative to its regional neighbours Indonesia generates a limited number of
prom-inent multinational irms. Our analysis inds that ODI is driven by a very small
number of internationally active business groups, and that the majority of Indo-nesian business groups are focused on domestic activities. To the extent that ODI is directed at seeking strategic assets, Indonesia’s economic development may be impeded by the absence of a larger number of home-grown MNEs. Given the
uncertain reliability of accounting for international capital outlows from emerg
-ing markets, we now consider whether both oficial statistics and our method
-ology have under-estimated the true extent of Indonesian irms’ international
activities. In addition, we ask whether our methodology accurately depicts the limited internationalisation of Indonesia’s business groups, and discuss the extent to which institutional voids explain the patterns documented above.
Hidden dragons?
The irst explanation for the apparently limited internationalisation of Indonesian irms is a ‘hidden dragons’ explanation. It suggests that domestic factors cause irms to internationalise in a manner that is not readily identiied by our methods.
FIGURE 4 Number of ODI Occurrences, Selected Indonesian Firms
1994 1995 1996 1997 1998 1999 2000 2001 2002 2003 2004 2005 2006 0
5 10 15 20 25 30 35
This explanation suggests that Indonesia’s missing MNEs represent a ‘type two
error’ or false negative: their ODI is signiicant but not readily apparent. Possible
sources of a type two error are of two kinds.
It may be that our sample of Indonesia’s largest 24 business groups is biased. If the large business groups in the sample are more locally oriented than the
popu-lation of free-standing irms or the afiliates of smaller groups, then the missing
MNEs might be found among the latter. Our method is unlikely to capture ODI
in smaller irms, because their international activities do not draw the attention of
the international media.
A second possibility is that domestic considerations may encourage business groups to conceal their ODI activities in an informal international economy. The informal economy consists of a range of activities that are unreported, unrecorded or informally organised (Portes and Haller 2005). We cannot say with certainty that the groups in our sample are engaged in any or all of the three forms of informal activity, but we enumerate them as a guide to further research.
First, it is well established that high tax rates can stimulate an increase in
vis-ible ODI as irms seek to shift activities to lower tax jurisdictions offshore. Equally, high tax rates can stimulate tax evasion through invisible intra-irm transfers
such as the use of special purpose entities registered in tax havens (OECD 1999).
More generally, opaque business group governance structures allow cash to low upwards into privately held family irms that may seek to preserve family wealth
and evade home-country taxes by channelling resources into unreported foreign investments. While our archival data cannot detect such activity, our interviews with analysts and bankers suggest that it is widespread among Indonesian groups. One source with experience of Indonesian business groups explained in an inter-view that, in his inter-view, tax reduction was the main rationale for the complex legal structure of these groups, which tend to span multiple jurisdictions.
Second, it is well known that ethnic diasporas constitute important networks that facilitate international trade (Tung and Chung 2010). Chinese Indonesian business groups may participate in ventures with fellow ethnic Chinese through minority investments, but if investments in such projects constitute less than 10% of the share capital, they are recorded as portfolio investments. Morck, Wolfenzon and Yeung (2005) document how family business groups exercise de facto con-trol over great swathes of the corporate sector through pyramidal structures with equity ownership stakes of less than 10%. Similarly, other capital arrangements, such as loans made through a group’s in-house private bank, may not be recorded
as direct investment, even though a core irm may exercise de facto control of the invested irm. To the extent that these investments cross borders they constitute
an important source of ODI, but they go unrecorded. If Indonesian business groups
make extensive use of such inancial instruments, then their participation in ODI
may be understated.
Third, ODI may go undetected because it occurs within an informal setting. Productive foreign investment may be informally organised in an intra-family wealth transfer (Tung and Chung 2010). Saxenian (2002) describes the importance of this phenomenon for foreign-born Silicon Valley entrepreneurs who raise funds
through family networks. In other cases, trading companies afiliated with busi
of foreign assets without actually owning them. Large segments of these chains are organised into informal sub-contract networks so as to avoid burdensome
regulations. Each of these cross-border capital lows represents signiicant activ -ity, but is unreported as ODI. This contributes to the understating of the scope of international activity.
The above discussion suggests that processes of globalisation have engen-dered ethnic and relational communities that straddle geographic boundaries and are ‘neither here nor there’. Entrepreneurs embedded in these communi-ties adopt a form of transnational organisation in which ODI has little
mean-ing, because irms cannot easily be identiied with a speciic national home base
(Yeung 2004).
Missing dragons?
The second explanation is a ‘missing dragons’ explanation, suggesting that a com-plex interplay of family ownership and management and institutional voids may
leave irms with structural characteristics that impede ODI. First, family owned and controlled irms typically prefer domestic rather than international diversii -cation (Gomez-Mejia, Makri and Kintana 2010). Risk aversion and a desire among
family management to retain close control constrain family irms’ international
opportunities because of the high costs associated with coordinating
geographi-cally dispersed operations. Some family irms limit participation in the senior
management team to a small cadre of trusted insiders, and are not inclined to recruit professional managers with detailed knowledge of international markets.
Moreover, the irms’ most important social and political networks are based on local connections. Such networks are unlikely to be helpful when the irm ven -tures across international borders.
An established body of research suggests that diversiied irms are less likely to engage in international expansion than more focused irms (Hitt, Hoskisson and
Ireland 1994) and that business groups are more likely to concentrate on domestic opportunities because they are so well embedded in the local economy (Carney et al., in press; Colpan 2006). Many large Southeast Asian business groups attained prominence before the widespread implementation of liberal market policies and growing globalisation (Yoshihara 1988). These groups became especially attuned to the conditions of a pre-liberalisation phase of economic growth, and aligned their structures and business practices with them. With liberalisation and
globali-sation, these irms became increasingly out of tune with emerging business condi -tions, because they continued to rely on their connections instead of developing organisational capabilities that may have facilitated their international growth (Carney and Gedajlovic 2002; Dieleman and Sachs 2008).
This is especially evident in Indonesia, where many business groups emerged in the late 1960s and early 1970s, when Indonesia relied heavily on import-substitution policies. Consequently, most groups developed business models focusing on the local market. The Soeharto era (1966–98) was one of growth, but also one of corruption and cronyism, in which ample opportunities were available inside the country for the well connected. Entrepreneurs often formed alliances with politicians to secure sector monopolies, permissions and licences (Robison
1986), and effectively organised their diversiied business groups in response
mobilise resources for repeated entry into multiple domestic industrial and commercial projects, but they developed little international experience. Instead, these large enterprises were able to convert their economic strength into
politi-cal power, inluencing policy and entrenching both market and politipoliti-cal power
(Morck, Wolfenzon and Yeung 2005).
In subsequent decades the ASEAN economies grew rapidly, and business groups were seemingly well positioned to expand beyond their domestic
strong-holds (McVey 1992). However, global capital lows created incentives to remain domestically focused. Established business groups mediated, and beneited from, the entry of foreign irms into the region (Yoshihara 1988), and served as a major conduit for a lood of portfolio investment during the ‘emerging economy fever’
of the early 1990s. These continuities illustrate the way dominant organisational forms and the institutional arrangements that engender them evolve along path-dependent trajectories. After working so well for so long, the strategies became ‘locked in’, creating an administrative heritage (Carney and Gedajlovic 2003) that may have left all but the largest groups ill equipped to engage in
internation-alisation. Management structures that were eficiently aligned with the domestic
challenges of early-stage industrialisation are now misaligned with the tasks of
developing irm-speciic capabilities that could fuel the irms’ internationalisa -tion. In this path-dependent explanation, very few domestically focused business groups are able to abandon their deeply rooted business practices and acquire the capabilities needed to succeed in global competition.
IMPLICATIONS OF THE FINDINGS Policy implications
Should Indonesian governments pursue policies aimed at accelerating or
other-wise inluencing their ODI? While we have been unable to furnish deinitive evi -dence in support of either a ‘hidden dragons’ or a ‘missing dragons’ hypothesis, we speculate that both concepts play some part in the explanation of Indonesian ODI patterns. First, our interview data lead us to suspect that at least some ODI goes unreported. However, unreported ODI is unlikely to be associated with asset-seeking investments that could contribute to the development of
domes-tic irms’ competitive capabilities. Rather, we suspect that most unreported ODI
represents a form of institutional escape, perhaps to avoid taxation or to shelter accumulated family wealth from the risks of political instability and expropria-tion. Second, apart from the very largest, we suspect that Indonesia’s business groups are too small to compensate effectively for institutional voids. Because of their relatively small scale they may lack the managerial, organisational and
inancial resources for effective pursuit of asset-seeking international opportuni
-ties that might strengthen their competitive capabili-ties. The irms afiliated with
smaller groups may prefer instead to avoid the risks associated with ODI, or may see the domestic environment as continuing to provide plentiful lucrative opportunities.
If business groups are too small to assemble the resources needed for
asset-seeking ODI, a more active role for the state may be justiied. Many of Indonesia’s
industrial strategy aimed at producing internationally competitive irms. While many Singaporean irms are engaging in ODI for eficiency-seeking purposes,
Singapore’s sovereign wealth funds are engaged in ODI to secure access to stra-tegic technologies. Malaysia too has recently become more active in promoting ODI, by offering tax exemptions on income derived from foreign earnings. It has also attempted to streamline a range of agencies involved in promoting national industrial competitiveness, and gives particular emphasis to investment in other developing countries. This may explain why Malaysia’s ODI levels are higher than those of other ASEAN countries.
A signiicant constraint for the development of Indonesian MNEs is a short -age of professional man-agement and technical personnel. World Economic Forum data show that Indonesia is a middle-ranking country with respect to ‘reliance on professional management’. It is ranked 54th among 134 countries, close to China (ranked 53rd), but signiicantly below Malaysia (22nd) and Singapore (8th). Simi-larly, Indonesia ranks 43rd in the local availability of research and training services, well below Singapore (13th) and Malaysia (27th) (Schwab and Porter 2008). The development of high-quality executive and technical talent is often the product of
experience and irst-hand learning through exposure to international projects. For
example, research on Japanese and South Korean business groups suggests that their successful international performance was aided by the systematic develop-ment of managedevelop-ment talent that could be deployed across a range of industries (Ungson, Steers and Park 1997). Researchers observe that family-controlled busi-ness groups are sometimes reluctant to make comparable investments in human resources, and often rely upon family members for senior executive talent
(Car-ney 1998). The existence of a corporate elite dominated by family irms, combined
with an absence of opportunities for managers to learn on the job, may create a self-reinforcing dynamic in which a supply of high-quality professional man-agement fails to materialise. Consequently, in addition to pro-active and direct ODI policies, states such as Indonesia may also wish to consider indirect policies aimed at developing skilled professional managers.
Theoretical implications
We believe that our results also have more general theoretical implications for
the study of internationalisation in emerging-market irms. As our literature
review showed, existing research emphasises drivers rather than inhibitors of globalisation. This is not surprising, given that UNCTAD statistics show a surge in ODI from emerging economies, and that newspapers report frequently on
high-proile cases. However, these indicators alone do not necessarily suggest
a general trend in a wider population. Instead, our limited study of Indonesian
groups suggests that they could relect a Pareto-type (rather than a normal)
distribution, with a few ‘extreme’ cases of internationalisation and a long tail
of irms focusing on the domestic market. Pareto-science is being applied to
an expanding set of social phenomena, and is thought to be appropriate in a context of interdependent actors, complex tensions and self-organising effects. Such a setting is common in international management research (Andriani and McKelvey 2007).
various events in which a medium-sized group (for example, the Ciputra Group) teamed up with a larger group (such as the Salim Group) when investing abroad, because the latter was better endowed with resources and foreign contacts. The Lippo Group frequently teamed up with business groups from other emerging economies (Malaysia, China), which presumably were drawn into the partner-ship because of Lippo’s international capabilities. In this manner, the most inter-national groups perceive more business opportunities than other groups and become increasingly experienced and successful, so a ‘positive feedback
mecha-nism’ produces an accelerated internationalisation pattern in these irms. In other words, a few irst-mover irms can overcome obstacles to internationalisation
and become ‘extremes’ (Baum and McKelvey 2006) that tend to skew aggregate statistics on ODI. If the pattern of internationalisation found among Indonesia’s
largest irms is representative of other emerging economies, this suggests that a
promising new approach lies in redirecting research away from assumptions of normal distribution towards a focus on the differential dynamics that generate
both extreme cases of emerging economy giants and a long tail of irms focused
on domestic markets.
CONCLUSION
We ind that very few large Indonesian business groups can be characterised as
MNEs, and that most either are active only in the domestic market or display
lim-ited internationalisation. We suggest two explanations for our indings, which we call ‘hidden dragons’ and ‘missing dragons’. The irst explanation suggests that more Indonesian MNEs exist than have been identiied to date, but that some go unnoticed in oficial statistics and in our data. The second suggests that few Indo -nesian MNEs have emerged because, with a very small number of exceptions,
Indonesia’s business groups are too small to ill institutional voids and correct
market failures. Which of our explanations is the more persuasive? At present we do not know how much ODI goes undetected, and we assume that we have overlooked some ODI events. Yet our understanding of business groups
accu-mulated from past research tells us that while our data and oficial statistics may not be very accurate, they do relect a general pattern of limited internationalisa
-tion in Indonesian irms. We contend that both the small size of most Indonesian
business groups and the familial structure of Indonesia’s corporate sector play a role in inhibiting Indonesian ODI, with possibly worrying consequences for Indo-nesia’s economic development.
REFERENCES
Andriani, P. and McKelvey, B. (2007) ‘Beyond Gaussian averages: redirecting organization science toward extreme events and power laws’, Journal of International Business Studies 38 (7): 1,212–30.
Baum, J.A.C. and McKelvey, B. (2006) ‘Analysis of extremes in management studies’, Research Methodology in Strategy and Management, Vol. 3, eds D.J. Ketchen and D.D. Bergh, Elsevier, Oxford: 123–97.
Buckley, P.J., Clegg, J., Cross, A.R., Liu, X., Voss, H. and Zheng, P. (2007) ‘The determinants of Chinese outward foreign direct investment’, Journal of International Business Studies 38: 499–518.
Carney, M. (1998) ‘A management capacity constraint? Barriers to the development of the Chinese family business’, Asia Paciic Journal of Management 15 (2): 1–25.
Carney, M. and Gedajlovic, E. (2002) ‘The co-evolution of institutional environments and organizational strategies: the rise of family business groups in the ASEAN region’, Organization Studies 23 (1): 1–29.
Carney, M. and Gedajlovic, E. (2003) ‘Strategic innovation and the administrative heritage of East Asian Chinese family business groups’, Asia Paciic Journal of Management 20 (1): 5–26.
Carney, M., Gedajlovic, E., Heugens, P.P.M.A.R., Van Essen, M. and Van Oosterhout, J. (in press) ‘Business group afiliation, performance, context, and strategy: a meta-analysis’, Academy of Management Journal.
Cheung, Y.L., Rau, P.R. and Stouraitis, A. (2006) ‘Tunneling, propping and expropriation: evidence from connected party transactions in Hong Kong’, Journal of Financial Econom-ics 82: 343–86.
Child, J. and Rodrigues, S.B. (2005) ‘The internationalization of Chinese irms: a case for theoretical extension?’ Management and Organization Review 1 (3): 381–410.
Claessens, S., Djankov, S. and Lang, L.H.P. (2000) ‘The separation of ownership and control in East Asian corporations’, Journal of Financial Economics 58: 81–112.
Collinson, S. and Rugman, A. (2007) ‘The regional character of Asian multinational enter-prises’, Asia Paciic Journal of Management 24 (4): 429–46.
Colpan, A.M. (2006) ‘Dynamic effects of product diversity, international scope and keiretsu membership on the performance of Japan’s textile irms in the 1990s’, Asian Business and Management 5 (3): 419–45.
Cuervo-Cazzura, A. and Genc, M. (2008) ‘Transforming disadvantages into advantages: developing-country MNEs in the least developed countries’, Journal of International Business Studies 39: 957–79.
Dieleman, M. and Sachs, W. (2008) ‘Coevolution of institutions and corporations in emerg-ing economies: how the Salim Group morphed into an institution of Suharto’s crony regime’, Journal of Management Studies 45 (7): 1,274–300.
Gerefi, G. (1994) ‘The organization of buyer-driven global commodity chains: how US retailers shape overseas production networks’, in Commodity Chains and Global Capital-ism, eds G. Gerefi and M. Korzeniewicz, Praeger, Westport CT: 95–122.
Gomez-Mejia, L., Makri, M. and Kintana, M. (2010) ‘Diversiication decisions in family controlled irms’, Journal of Management Studies 47 (2): 223–53.
Hattari, R. and Rajan, R.S. (2008) ‘Intra-Asian FDI lows: trends, patterns, and determi -nants’, in New Dimensions of Economic Globalization: Surge of Outward Foreign Direct Investment from Asia, eds R.S. Rajan, R. Kumar and N. Virgill, World Scientiic, Singa -pore: 49–84.
Hitt, M.A., Hoskisson, R.E. and Ireland, R.D. (1994) ‘A mid-range theory of the interactive effects of international and product diversiication on innovation and performance’, Journal of Management 20 (2): 297–326.
Hobday, M. (1995) ‘East Asian latecomer irms: learning the technology of electronics’, World Development 23: 1,171–93.
Hofman, B., Zhao, M. and Ishihara, Y. (2007) ‘Asian development strategies: China and Indonesia compared’, Bulletin of Indonesian Economic Studies 43 (2): 171–200.
Khanna, T. and Palepu, K. (1997) ‘Why focused strategies may be wrong for emerging mar-kets’, Harvard Business Review 75 (4): 41–51.
La Porta, R., Lopez-de-Silanes, F. and Shleifer, A. (1999) ‘Corporate ownership around the world’, Journal of Finance 54 (2): 471–517.
Lecraw, D.J. (1993) ‘Outward investment by Indonesian irms: motivation and effects’, Jour-nal of InternatioJour-nal Business Studies 24 (3): 589–600.
Lipsey, Robert E. and Sjöholm, Fredrik (2011) ‘Foreign direct investment and growth in East Asia: lessons for Indonesia’, Bulletin of Indonesian Economic Studies 47 (1): 35–63, in this issue.
Liu, H. (2001) ‘Social capital and business networking: a case study of modern Chinese transnationalism’, Southeast Asian Studies 39 (3): 358–83.
Luo, Y. and Tung, R.L. (2007) ‘International expansion of emerging market enterprises: a springboard perspective’, Journal of International Business Studies 38 (4): 481–98.
McVey, R. (1992) ‘The materialisation of the Southeast Asian entrepreneur’, in Southeast Asian Capitalism, ed. R. McVey, Cornell University Southeast Asia Program, Ithaca NY: 7–34.
Morck, R. and Yeung, B. (2003) ‘Agency problems in large family business groups’, Entre-preneurship Theory and Practice 27 (4): 367–83.
Morck, R., Wolfenzon, D. and Yeung, B. (2005) ‘Corporate governance, economic entrench-ment, and growth’, Journal of Economic Literature 43 (3): 655–720.
Niskanen, W. (1991) ‘The soft infrastructure of a market economy’, Cato Journal 11 (2): 233–7. OECD (Organisation for Economic Co-operation and Development) (1999) OECD
Bench-mark Deinition of Foreign Direct Investment, 3rd ed., OECD, Paris.
Peng, M.W., Wang, D.Y.L. and Jiang, Y. (2008) ‘An institution-based view of international business strategy: a focus on emerging economies’, Journal of International Business Stud-ies 39 (5): 920–36.
Portes, A. and Haller, W. (2005) ‘The informal economy’, in The Handbook of Economic Sociol-ogy, eds N.J. Smelser and R. Swedburg, Princeton University Press, Princeton NJ: 403–28. Rauch, J.E. (2001) ‘Business and social networks in international trade’, Journal of Economic
Literature 39 (4): 1,177–203.
Robison, R. (1986) Indonesia: The Rise of Capital, Allen and Unwin, Sydney.
Saxenian, A. (2002) ‘Silicon valley’s new high-growth immigrant entrepreneurs’, Economic Development Quarterly 16 (1): 20–31.
Sato, Y. (1993) ‘The Salim Group in Indonesia: the development and behavior of the largest conglomerate in Southeast Asia’, The Developing Economies 31 (4): 408–41.
Schwab, K. and Porter, M.E. (2008) Global Competitiveness Report 2008, World Economic Forum, Geneva.
Szulanski, G. (1996) ‘Exploring internal stickiness: impediments to the transfer of best prac-tice within the irm’, Strategic Management Journal 17: 27–43.
Tung, R. and Chung, F. (2010) ‘Diaspora and trade facilitation: the case of ethnic Chinese in Australia’, Asia Paciic Journal of Management 27 (3): 371–92.
UBS Investment Research (2006) Indonesia Connections, UBS, Jakarta, 23 May.
UNCTAD (United Nations Conference on Trade and Development) (2006) World Invest-ment Report – FDI from Developing and Transition Economies: Implications for DevelopInvest-ment, United Nations, Geneva.
Ungson, G., Steers, R.M. and Park, S.H. (1997) Korean Enterprise: The Quest for Globalization, Harvard Business School Press, Boston MA.
Yamakawa, Y., Peng, M. and Deeds, D.L. (2008) ‘What drives new ventures to interna-tionalize from emerging to developed economies?’, Entrepreneurship Theory and Practice 32 (1): 59–82.
Yeung, H.W.C. (2004) Chinese Capitalism in a Global Era: Toward Hybrid Capitalism, Rout-ledge, London.