Analysis of Capital Buffer in Indonesian Banking
Isfenti Sadalia
Department Management, Faculty of Economic and Business
University of Sumatera Utara Medan, Indonesia isfentisadalia@gmail.com
Hartika Ichtiani
Department management, Faculty of Economic and Business
University of Sumatera Utara Medan, Indonesia hartikaich.hi@gmail.com
Novi Andrani Butar-Butar
Department management, Faculty of Economic and Business
University of Sumatera Utara Medan, Indonesia novibb94@gmail.com
Abstract—
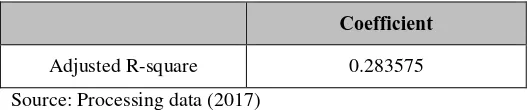
Capital buffer place a role as to anticipate the increasing of future lost. Basel Committee on Banking Supervision implements a Basel accord which required all banks to have capital adequacy ratio at 13% in order to strengthen the capital position. Moreover capital buffer also act to reduce the likelihood of banks having trouble during economic crisis. The purpose of this research is to know and analyze the effect of Non-Performing Loan (NPL), Bank Size (Size), Return on Asset (ROA), Return on Equity (ROE), Loans to Total Assets (LOTA), Lag of Capital Buffer (BUFFt-1), and dummy variable to capital buffer in Indonesia banking. This research used 30 samples of conventional banking which listed in Indonesia Stock Exchange for period 2012-2015. The result found the negative effect between Size, LOTA an BUFFt-1 to Capital Buffer. While NPL, ROA, ROE has no effect to Capital Buffer. This research also found that government bank and private bank has no different on capital buffer. NPL, Size, ROA, ROE, LOTA, BUFFt-1 and dummy variable have simultaneous effect on capital buffer. Independent variables in this research can explain capital buffer about 28.3575%.Keywords: Capital Buffer, ROA, ROE, NPL, Lag of Capital Buffer, Loans to Total Assets, Bank Size, Dummy Variable.
I. Introduction
Banking industry is one of the essential industries, having key role in economic system of a country. One of the main functions of banking is as an intermediary, collecting public funding in the form of saving and distributing to the public in the form of credit/ lending.
In 1998, Indonesia faced economic crisis, whereas a large number of banks had failure. It indicates the mediocre of banking infrastructure in Indonesia. Hence, it is needed a solution to encounter the weakness of banking regulation in order to support the expected economic level. The bass of regulation which is applied by the central bank is from Basel Committee on Banking Supervision (BCBS).
The global financial crisis in 2008-2009 have force BCBS released global financial reformation package, namely Basel III, to strengthen both micro and macro position. The strange enhancing in micro side was executed by upgrading the quality and quantity of capital banking, as well as the availability of capital buffer owned by bank. It is compulsory to establish the conservation buffer at 2.5% all of risk-weighted assets (RWA) owned by bank, to absorb the lost in crisis period. Therefore, wear of capital buffer is very important for banking to anticipate the future risk.
Capital buffer is CAR deducted by required minimum CAR (8%). The function of capital buffer is to anticipate the increasing of future risk. The average CAR (Capital Adequacy Ratio) of conventional banks in 2010 was 18.8%, while the minimum of capital required by the regulator was 8%, it is mean that capital buffer was 10.8%. That is excessive capital that acts as capital buffer. This capital buffer will protect the bank if there will be a future risk. However, the higher capital buffer it mean the higher CAR, while the higher value of CAR means the lesser capital that can be distributed for lending. Meaning that the lesser return that can be achieved by the bank.
lead to the anticipation of various problems. It makes the capital buffer has countercyclical characteristic.
The tendency of smaller bank size have backward-looking characteristic, and the larger bank size have forward-looking characteristic. Therefore, it can be stated that capital buffer in larger bank size tend to have countercyclical characteristic, meanwhile smaller bank size is pro-cyclical (Ayuso et al., 2004); Jokipii and Milne, 2008). This research has to know is bank with higher profit encouraging the increasing of capital buffer.
Furfine (2000) and Estrella (2004) stated there is a positive relationship between the higher risks with the capital buffer. This theory explain the relationship of two variables supposed to have positive relationship because the higher the risk so that the higher probability of capital constraints, as well as the presents of various costs like market discipline and supervisory intervention.
II.Literature Review A. Capital Buffer
A bank’s capital buffer is given by the capital banks hold in excess of the regulatory minimum capital requirement. Hence, we define banks’ capital buffer (CBUF) as the Basel capital to risk-weighted assets ratio minus the nine percent regulatory minimum (imposed by the Reserve Bank of India). With respect to business cycle fluctuations (BCYCLE), we use two main indicators. Following the previous banking literature, our first indicator is the real gross domestic product (GDP) growth rate (RGDP) for India (Ayuso et al., 2004; Lindquist, 2004; Mahakud and Dash, 2013).
B. Non-Performing Loan (NPL)
A non-performing loan (NPL) is defined as a sum of borrowed money upon which the debtor has not made his or her scheduled payments for at least 90 days. A non-performing loan is either in default or close to being in default. Once a loan is nonperforming, the odds that it will be repaid in full are considered to be substantially lower. If the debtor starts making payments again on a nonperforming loan, it becomes a re-performing loan, even if the debtor has not caught up on all the missed payments (Saba et al, 2012). According to Ayuso et al (2004); Jokipii and Milne (2008); Fonseca and Gonzales (2010) use NPL ratio as a proxy for credit risk.
Refer to the central bank regulation BI No. 3/30DPNP on december,14 2001), non-performing loan (NPL), measured by the non-performing loan divided by the total loans. The higher number of NPL will increase the cost, and it will lead the high potential of lost. Coherence with the central bank regulation, the threshold of NPL should by lower that 5%.
C. Bank Size
Bank size measured with log of bank total assets (Jokipii and Milne, 2011). In parallel, some papers examine the determinants of bank’s capital buffer instead of analyzing pro-cyclicality issues. The clearest prediction is related to bank size. A consensus has been reached, where larger banks tend to be irrespective with regulation, such as holding lower
capital ratio, due to their “Too Big To Fail” (TBTF) nature or “Too-Big-To-Discipline-Adequately” (TBTDA) (Kane 2000; Mishkin 2006). Besides TBTF, larger banks have comparative advantage to overcome asymmetric information by increasing screening and monitoring efforts which induce them to balance between monitoring cost and equity cost. In turn, economies of scale in monitoring and screening activities enjoyed by banks imply less capital relative to the loans size.
D. Return on Assets (ROA)
Return on assets (ROA) is an indicator of how profitable a company is relative to its total assets. ROA gives an idea as to how efficient management is at using its assets to generate earnings. Calculated by dividing a company's annual earnings by its total assets, ROA is displayed as a percentage (www.investopedia.com).
E. Return on Equity (ROE)
Return on equity (ROE) is the amount of net income returned as a percentage of shareholders equity. Return on equity measures a corporation's profitability by revealing how much profit a company generates with the money shareholders have invested (www.investopedia.com).
Equity also is a form of capital for which monitoring costs are high, and the bank has an informational advantage over public investors as to the value of its own equity, which would increase the cost of the desired adjustment (Myers and Majluf, 1984).
Ayuso et al. (2000); Jokipii and Milne (2007) used ROE as a proxy from cost of holding capital. Jokipii and Milne (2007) mentioned ROE can surpass the remuneration requested by shareholder, used to measure the income over cost. The higher profit can be a replacement as a buffer to withstand any unexpected problem. Frequently capital holding is used to increase the capital buffer.
F. Loan to Total Assets (LOTA)
Loan to Total Assets (LOTA) is a measure of bank risk (Ayuso et al, 2004; Jokipii and Milne, 2008; Fonseca and Gonzales, 2010; Atici and Gursoy, 2013) and points out a potential risk (Azeem, 2015). LOTA can measured by compare total of credits bank with total assets of banks.
Banks which provide more loans are expected to be more efficient in profit as they take more risks (Maudos et al. 2002). However, in the case of Chinese banks, Ariff and Can (2008) find an inverse relationship between this variable and efficiency. They argue that banks which have a higher ratio of loan to total assets incur higher credit risk, and thus higher loan-loss provision, and are less efficient. Moreover, these banks provide a large proportion of loans to some inefficient state owned firms.
G. Lag of Capital Buffer (BUFFt-1)
H. Dummy Variable
Dummy variable is nominal variable which is used in multiple regression analysis, and coded with 0 and 1 (Cooper and Schindler, 2000). In this research dummy variable is added as independent variable. Dummy variable is used to see the influence of governance banks which is given code 1, and other banks coded 0 on capital buffer.
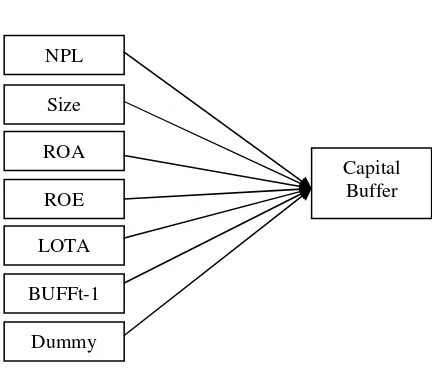
I. Framework
Figure 1. Conceptual framework
The Figure 1 shows the conceptual framework of this research. It is shows the effect of independent variable to dependent variable which researcher will analyze.
III.Method
This research is an associative research, which aim to analyze and explain the effect of independent variable to dependent variable. This research is to describe the effect of Non-Performing Loan (NPL), Bank Size (Size), Return on Assets (ROA), Return on Equity (ROE), Loans to Total Assets ((LOTA), Lag of Capital Buffer (BUFFt-1) and dummy variable to Capital Buffer on 30 (thirty) conventional banks listed in Indonesia Stock Exchange in 2012 until 2015. The sample method used purposive sampling method.
Sample collecting uses purposive sampling method. The purposive sampling technique, also called judgment sampling, is the deliberate choice of an informant due to the qualities the informant possesses. It is a nonrandom technique that does not need underlying theories or a set number of informants. Simply put, the researcher decides what needs to be known and sets out to find people who can and are willing to provide the information by virtue of knowledge or experience (Bernard, 2002; Lewis and Sheppard, 2006). The analysis data use multiple regression panel data, by using EViews software.
IV.Result
Descriptive statistics are used to describe the basic features of the data in a study. They provide simple summaries about the sample and the measures. The result of descriptive statistic from this research can be summary in Table 1.
Table 1. Descriptive Statistic was high in 2015, 25.57%. Meanwhile, the minimum value is 3.56% was owned by Bank Pundi Indonesia in 2013. In spite of the low capital buffer value, the CAR value of bank is still in the threshold required of central bank bigger than 8%. It was indicate that capital of banks in Indonesia still in a good level. The mean value of capital buffer is 9.18 and the standard deviation about 2.79.
Based on Table 1, it is noticeable that the maximum value of ROE is 28.80% owned by Bank Rakyat Indonesia Tbk in 2012. This is because the capability of management bank in manages the equity capital to get income. While the minimum value -10.65% owned by Bank MNC International Tbk in 2013. It is because MNC Bank has lost about IDR 81.74 billion in 2013 as a result of winding down on credit cards. Knowing the mean of ROE is 11.87% and the standard deviation is 6.91.
It can be seen from Table 1 that the maximum amount of NPL is 9.95% owned by Bank Pundi Indonesia Tbk in 2012, because in that year Pundi Bank had increasing of bad credit as a result of the highest credits which distributed to micro sector. Pundi Bank is also still doing revamping since the acquisition. Meanwhile, the minimum value of NPL is 0.31%, caused by Pundi Bank can guard the quality of their credits. Noted that the mean value of NPL is 2.28% and the standard deviation is 1.62.
Refer to the Table 1 the maximum value of BUFFt-1 is 19.91% owned by Bank Woori Saudara Indonesia 1960 Tbk in 2014. Meanwhile, the minimum value is 2.93% owned by Bank Mayapada International Tbk in 2013. The mean value of BUFFt-1 is 8.69% and the standard deviation is 3.16.
According to Table 1, it can be seen that the maximum value of LOTA is 89.84% owned by Bank CIMB Niaga Tbk in 2012, caused by along 2012 invest of credit CIMB Niaga booked about IDR30.18 trillion, increase 11% from the previous year because the added of foreign fund in Indonesia. Mining sector, property and manufacture become the dominant sector in contributed to increasing invests of credit banking corporation of CIMB Niaga. Meanwhile, the minimum value of LOTA is 49.97% owned by Bank Capital Indonesia Tbk in 2012. Knowing that the mean value of LOTA is 67.89% and the standard deviation is 7.20.
From Table 1 it can be seen that the maximum amount of Size is 22.84% owned by Bank Rakyat Indonesia Agro Niaga Tbk in 2015. As a subsidiary of BRI Bank, BRI Agro gets additional funds from BRI so that BRI Agro has increased their total assets. Meanwhile, the minimum value of size is 11.09% owned by Bank Bukopin in 2012. Although has the lowest size, Bukopin Bank still tried to increasing their assets. The mean value of Size is 16.06% and the standard deviation is 2.94 the dependent variable are called the independent variables (or sometimes, the predictor, explanatory or regression variables).
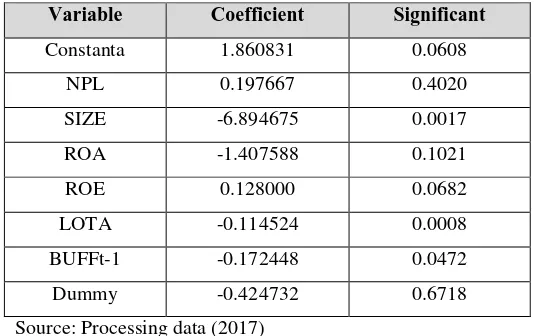
The regression analyze from this research can be summary in Table 2.
Table 2. The Influence of Independent Variables to Dependent Variable. Performing Loan (NPL) has positive insignificant effect to capital buffer. It is found that NPL has no effect to capital reason why the condition of NPL ratio cannot be demonstrated capital buffer of a bank.
Size has negative significant to Capital Buffer. This result supported by (Ayuso et al., 2004; Jokipii and Milne, 2008; Azeem, 2015). This result not only facilitate the fact that the strong banks have lower capital ratios but also remind economies of scale, diversification effects & advantages in terms of access to capital (Azeem, 2015).
Return on Assets (ROA) has negative insignificant effect to Capital Buffer. This is means that ROA didn’t affect capital
buffer, the fluctuation of ROA did not affect the fluctuation of capital buffer.
In contradiction with earlier finding (d’Avack and Levasseur, 2007) which found the positive effect, we found that Return on Equity (ROE) has positive insignificant effect to Capital Buffer. This is means that the result did not show the effect of ROE to Capital buffer. This is show that banks in Indonesia would rather share dividend to shareholder than keep it for retained profit to enhance the company’s capital. It will make the profitability condition has no effect on capital buffer. Since the capital cannot be utilized to enlarge the company’s capital.
From the test we know that Loans to Total Assets (LOTA) has negative significant effect to Capital Buffer. It is explain that the increasing value of LOTA will reduce capital buffer. Azeem, (2015) noted that LOTA has positive distributed credit is high, it will decrease the bank capacity in increasing the capital buffer. Bank would rather distributed credits than add the capital amount to reserve ass the risk anticipation. Fonseca and Gonzales (2010) said that a negative sign would suggest that, banks choose to take greater risks with their assets by holding smaller capital buffers.
Table 4. Coefficient Determinant 71.6425% effected by the other variable which didn’t include in this research.
V. Conclusion
The results of this study indicated that Size, LOTA and BUFFt-1 have negative significant effect to Capital Buffer. NPL and ROE have positive insignificant effect to Capital Buffer. ROA has negative insignificant effect to Capital Buffer. Furthermore, dummy variable showed there is no
Suggestion to future research, it would be better if others variables are added to analyze the capital buffer. Moreover, in order to increase the accuracy of the research, research period should be complemented in the research.
References
[1] A. Estrella. “The cyclical behaviour of optimal bank capital,” Journal of Banking & Finance 28, 2004, pp.1469-1498.
[2] A. R. Fonseca and F. Gonzalez. “How Bank Capital Buffers Vary Across Countries: The Influence of Cost of Deposits, Market Power and Bank Regulation”. Journal of Banking and Finance. 2010.
[3] B. M. Tabak and A. C. B. T. F. Noronha. “Bank Capital Buffers, Lending Growth and Economic Cycle: Empirical Evidence from Brazil. BIS CCA-004-2011, 2011, pp.1-25.
[4] C. Borio, C. Furfine, and P. Lowe. “Procyclicality f the Financial System and Financial Stability: Issues and Policy Option in Marrying the Macro-prudential Dimensions of Financial Stability”. BIS Papers, 2001, no.1, pp.1-57.
[5] C. Furfine. “Evidence on the response of US banks to changes in capital requirements”, BIS Working Paper 88, 2000.
[6] D. R. Cooper and P. S. Schindler. “Business Research Methods, Seventh Editions”. Mcgraw-Hill College. 2000.
[7] E. J. Kane. “Incentives for banking megamergers: What motives might regulators infer from event-study
evidence?”.Journal of Money, Credit and Banking, 32, Journal of Ecnomic Literature, 2006, no.44, pp.988-1004.
[10] G. Atici and G. Gursoy. “The Determinants of Capital Buffer in The Turkish Banking System”. International Business Research, 2012, pp.224-234.
[11] H. R. Bernard. “Research Methods in Anthropology: Qualitative and quantitative methods. 3rd edition”. AltaMira Press, Walnut Creek, California. 2002.
[12] I. Saba, R. Kouser, and M. Azeem. “Determinants of Non Performing Loans: Case of US Banking Sector”. The Romanian Economic Journal. 2012, vol. XV, no.44, pp. 141-152.
[13] J. Ayuso, D. Perez, and J. Saurina. “Are Capital Buffers Pro-Cyclical? Evidence from Spanish Panel Data”. Journal of Finance Intermesiation, 2004, pp.249-64.
[14] J. L. Lewis and S.R.J. Sheppard. “Culture and communication: can landscape visualization improve forest management consultation with indigenous communities?” Landscape and Urban Planning,. 2006, 77:291–313.
[15] J. Mahakud and S. R. Dash. “Impact of Business Cycle on Bank Capital Buffers: Evidence from India. Economics, Management and Financial Markets”. 2013, vol. 8, No. 2. pp 110-127.
[16] J. Maudos, J. M. Pastor, F. Perez and J. Quesada. “Cost and profit efficiency in European banks,” Journal of International Financial Markets Institutions and Money. 2002, vol. 12, no.1, pp.33-58.
[17] K. Lindquist. “Banks’ Buffer Capital: How Important Is Risk?” Journal of International Money and Finance 2004, vol.23, no.3, pp. 493–513
[18] M. Ariff and L. Can, “Cost and profit officiency of chinese banks: A non-parametric analysis,” China Economic Review, 2008, vol. 19, no.2, pp.260-273.
[19] M. M. Azeem. “Influence of Capital Buffer in Turkish Banking System”. International Research Journal in York University, 2015, vol. 2, no.2, pp.208-237.
[20] S. C. Myers and N. S, Majluf. “Corporate financing and investment decisions when firms have information that investors do not have,” J. Finance Economi, 1984, vol. 13, pp.187-221.
[21] T. Jokipii and A. Milne. “The Cyclical Behaviour of Eropean Bank Capital Buffers”. Journal of Banking & Finance 32, 2008, vol. 3, no.8, pp.1440-1451.
[22] www.bi.go.id (access, 31 October 2016).
[24] www.investopedia.com (access, 15 February 2017)