ANALYSIS OF SYMMETRIC AND ASYMMETRIC
NONLINEAR CAUSAL RELATIONSHIP BETWEEN STOCK
PRICES AND EXCHANGE RATES FOR SELECTED
EMERGING MARKET ECONOMIES
SEÇİLMİŞ GELİŞMEKTE OLAN ÜLKELER İÇİN HİSSE SENEDİ FİYATLARI VE DÖVİZ KURLARI ARASINDAKİ DOĞRUSAL OLMAYAN
SİMETRİK VE ASİMETRİK NEDENSELLİK İLİŞKİSİNİN ANALİZİ
Veli YILANCI
(1), Şeref BOZOKLU
(2) (1) Sakarya Üniversitesi, SBF, Finansal Ekonometri Bölümü(2) İstanbul Üniversitesi, İktisat Fakültesi, İktisat Bölümü (1) yilanci@sakarya.edu.tr; (2) sbozoklu@istanbul.edu.tr
ABSTRACT: This study investigates the symmetric and asymmetric nonlinear causal relationship between exchange rates and stock prices in BRICS and Turkey. To this end, the Mackey-Glass model allowing to test the symmetric and asymmetric nonlinear causality by identifying the types of feedbacks of the related variables has been employed. While the results of the symmetric form of the test present little evidence, the results of asymmetric counterpart indicates strong evidence for the causal relationship. In conclusion, these findings imply the existence of the noisy tradings and speculative behaviours in both exchange rate and stock markets. Keywords: Mackey-Glass Model; Symmetric and Asymmetric Causality; Stock Prices; Exchange Rates; Nonlinear Causality
JEL Classifications: C32; F31; G15
ÖZET: Bu çalışma BRICS ülkelerinde ve Türkiye'de hisse senedi fiyatları ve döviz kurları arasındaki doğrusal olmayan simetrik ve asimetrik nedensellik ilişkisini araştırmaktadır. Bu amaçla, ilgili değişkenlerin geri bildirimlerinin türlerini saptayarak doğrusal olmayan simetrik ve asimetrik nedensellik ilişkisinin test edilmesine imkân sağlayan Mackey-Glass modeli kullanılmıştır. Doğrusal olmayan simetrik nedensellik testinin sonuçları ilişkinin varlığına ilişkin zayıf kanıtlar sunarken, testin asimetrik biçimi güçlü bir nedensellik ilişkisi olduğunu göstermektedir. Sonuç olarak, bu bulgular döviz ve hisse senedi piyasısında gürültülü işlemlerin ve spekülatif davranışların olduğunu ifade etmektedir.
Anahtar Kelimeler: Mackey-Glass Modeli; Simetrik ve Asimetrik Nedensellik; Hisse Senedi Fiyatları; Döviz Kurları; Doğrusal Olmayan Nedensellik
1. Introduction
Internationalization of the capital markets, disappearing of controls on capital flows and adopting flexible exchange rate systems in both developed and developing economies help to form a link among asset markets. The volume of studies on the relationship between the stock and the foreign exchange markets have remarkably increased in the literature since examining this relationship offers meaningful insights to the academicians, policy makers and practitioners. The policy makers, for example, may perform their policy implementations in the light of this relationship. The investors and multinational corporations, on the other hand, may utilize the link
between the two markets to make profitable investments and manage exchange rate risk. The relationship is also a crucial input for open economy macroeconomics as well as for hedging models, and therefore an important research area for the academicians.
The theoretical approaches linking stock price and exchange rate have taken two major forms1, namely, flow- and stock-oriented models. The flow oriented models (Dornbusch and Fischer, 1980) suggest that changes in exchange rates affect international competitiveness and trade balances of the national economy, and also have impacts on the real macroeconomic variables, such as real income and output. Through changes in these macroeconomic aggregates, variations in exchange rates affect the values of the earnings and costs of funds of firms, and hence their stock prices interpreted as the present value of future cash flows of firms. In a nutshell, according to the flow oriented models, exchange rate causes the stock prices to move.
The stock oriented models suggest that exchange rates equate the supply of and demand for financial assets, such as stocks, and that the capital account dynamics have an important role in determining the exchange rate. Since the values of financial assets are determined by the present values of their future cash flows, expectations for relative values of currencies play a considerable role in their price movements, especially for internationally held financial assets. Two types of stock-oriented models can be identified in the literature: the portfolio balance model and the monetary model. The portfolio balance model (Branson vd., 1979; Frankel, 1983) posits that international investors will probably buy more domestic assets by selling foreign ones to obtain domestic currency when returns of domestic stocks rise, so increase in demand for domestic currency will lead to appreciation of domestic currency. Furthermore, increases in returns of domestic assets lead to increasing in wealth, which in turn increase the demand for domestic money and the interest rates. In this case, more foreign capital will be attracted into the economy, which will increase foreign demand for domestic currency, and the ultimate result will be appreciation of domestic currency again. Consequently, the stock prices inversely lead the exchange rates in the portfolio balance model. According to the monetary model (Gavin, 1989), the present value of an asset is thought to be largely influenced by its expected rate of return and all relevant macroeconomic factors. Since the exchange rate is seen as a relative asset price, in case there are common factors affecting the two assests, stock price innovations may have an impact, or be influenced, by the exchange rate's behavior. This model consists essentially of the purchasing power parity (PPP), uncovered interest rate parity (URP) and an equilibrium condition for the money market in which the demand for money is negatively related to the stock return. An increase in domestic output will be most probably accompanied by a rise in stock prices and a fall in the interest rate due to the reduced demand for money. As a result, domestic currency depreciates via URP, and furthermore the reduction in the demand for money increases the price level via PPP. In contrast to this substitution (interest rate) effect, wealth (income) effect states that a rise in stock prices reflects an
1The exchange rate is defined as the price of one unit of foreign currency in terms of local currency.
increased level of financial transactions and cash flows of future inc ome, thus an increase in wealth, which leads domestic money demand to rise and exchange rate will appreciate. As a result, the sign of the relation between stock prices and exchange rates depends on the relative strengths of the wealth and substitution effects.
Over several years, the prominent tendency in the global economy has been rise of the many developing countries swiftly converging with those of their more developed peers. In this context, the term “BRICS” encompasses the five large emerging markets; Brazil, Russia, India, China and South Africa. The group, firstly introduced by Goldman Sachs economists in 2003, was originally known as “BRIC” before the inclusion of South Africa in 2010. BRICS and Turkey seems to have a rapid catch-up process, which encourages us to investigate the relationship between stock and exchange rate markets. The aim of this paper is to investigate the symmetric and asymmetric nonlinear causal relationship between stock prices and exchange rates for BRICS and Turkey by identifying the types of feedbacks; to that end, we utilize nonlinear noisy Mackey-Glass (MG) model. Our study is organized as follows: Section 2 presents a review of selected literature, Section 3 describes data and econometric methodology, and finally Section 4 concludes.
2. Literature Review
Early empirical studies examining the relation between stock returns and exchange rates use generally US data (Franck and Young, 1972; Aggarwal, 1981; Giovannini and Jorion, 1987) and utilize regression and/or correlation techniques (Soenen and Hennigar, 1988; Solnik, 1987; Jorion, 1990); however, omit the fact that most financial variables are non-stationary. After the concept of stationarity dominates the empirical literature, newly developed techniques become popular. Bahmani-Oskooee and Sohrabian (1992), for example, analyse the relation between stock prices and exchange rates in the US economy via cointegration and causality tests. Their study reveals no long-run relationship between these variables, but rather a bicausal relationship in the short run. Donnelly and Sheehy (1996) document a significant contemporaneous relation between exchange rate and market value of large U.K. exporters. Abdalla and Murinde (1997) investigate stock price-exchange rate relationships in the emerging financial markets of India, Korea, Pakistan and the Philippines and find unidirectional causality from exchange rate to stock price in India, Korea and Pakistan. On the contrary, the reverse causation is found for the Philippines. Ajayi et al. (1998) provide evidence to indicate unidirectional causality from the stock to the currency markets for advanced economies and no consistent causal relations in emerging markets. In a recent study, Granger et al. (2000) study East Asian countries using recent ‘Asian flu’ data, and combine it with impulse response functions. They find that while data from Japan and Thailand are in agreement with the flow approach, meaning that exchange rates to lead stock prices with positive correlation, data from Taiwan suggests the result predicted by the portfolio approach, meaning that stock prices to lead exchange rates with negative correlation. Data from Indonesia, Korea, Malaysia, and the Philippines indicate strong feedback relations, but the data from Singapore fails to reveal any recognizable pattern. Muradoglu et al. (2001) try to find out the relation between stock returns and some macroeconomic variables. They conclude that there is a one way causal relationship from exchange
rates to stock returns in Nigeria, Mexico, Korea, Greece, Colombia and Brazil while there is a bidirectional causal relationship between the variables in case of Mexico. Tabak (2006) employs both linear and nonlinear causality tests and finds that there is a linear Granger causality from stock prices to exchange rates with a negative correlation and evidence of nonlinear Granger causality from exchange rates to stock prices that is lined with the flow approach for Brazil. Kumar (2009) examines the dynamic relation between stock prices and exchange rate for India, employing noisy MG model and suggests that there is bidirectional linear and nonlinear Granger causality between stock prices and exchange rates. Rahman and Uddin (2009) investigate the interactions between stock prices and exchange rates for Bangladesh, India and Pakistan and suggest that there is no way causal relationship between stock prices and exchange rates in these countries. Aydemir and Demirhan (2009) examine the causal relationship between stock prices and exchange rates for Turkey and suggest that there is a bidirectional causal relationship between exchange rate and all stock market indices.
The empirical literature on the stock market and exchange rate relationship suffers from several drawbacks. Most studies employ a combination of cointegration and Granger causality tests. However, absence of common stochastic trends, a typical finding in cointegration tests with exchange rates and stock indices, does not mean absence of co-dependence (Morley and Pentecost, 2000). In other words, cointegration tests may fail to capture strong instantaneous relationships. Many papers employed Granger causality tests only report
2 and/orF-test statistics, omitting sign information related to the variables. In this context, Ülkü and Demirci (2012) emphasises that the most effective way of analyzing stock market and exchange rate relationship is to study impulse response functions from a (cointegrating) SVAR model, which provides information on the sign of the relationship and net cumulative effects. However, similar to the previous literature, this approach is based on traditional causality test and does not take into consideration nonlinearity and asymmetry. Eventually, we can state that the literature investigating the relationship between exchange rates and stock prices is far from conclusive.
3. Methodology and Empirical Results
Granger et al. (2000) point out that using monthly or quarterly data may not be adequate in describing the effects of nonlinearities, so we employ daily data of the emerging markets in the hope that it will capture such effects. Six emerging-market economies are selected for the empirical analysis: Brazil, China, India, Russia, South Africa and Turkey. The data is obtained from Reuters and includes daily observations of stock market indices expressed in domestic currency and exchange rates expressed in domestic currency per U.S. dolar. The coverage of sample period runs from January 2000 to September 2011. We use the natural logarithms of the series in the analysis.
As a first step of the analysis, we test the stationarity characteristics of the series using the Augmented Dickey Fuller (ADF) test since spurious causality would result, if the data are treated as non-stationary erroneously and the causality tests are applied to the first differences as pointed out by Lu et al. (2010). The results of the ADF unit root test are presented in Table 1 and show that both series are
first-difference stationary. So, we use the first-differenced data, that is, the returns of the exchange rates and stock prices will be employed in the causality analyses.
Table 1. Results of the ADF unit root test
Exchange Rates Stock Prices Exchange Rates Stock Prices
Level First Differences
Brazil -2.1637 -2.6235 -41.5813* -8.0313* China -1.4092 -1.9141 -55.1754* -7.6888* India -1.6007 -2.4781 -54.3511* -50.2827* Russia -1.4044 -1.5455 -44.7488* -51.7955* South Africa -2.4915 -2.0456 -8.8947* -51.2490* Turkey -2.9534 -29.3008 -28.4978* -10.0585*
Note: * denotes the significance at the 1% level.
The linear approach to causality testing has a disadvantage: it fails to explore the nonlinear relationship between the variables. The investigation of nonlinear causal relationships between exchange rates and stock prices has more importance for having the better understanding of the true impacts of shocks. For that purpose, we employ the bivariate MG model with noise terms which enrich the obtained dynamics and produce characteristic structures of financial and economic data as stated by Kyrtsou and Terraza (2003). The general form of the model is presented as follows:
1 2 1 2 1 2 1 2 1 2 1 2 11 11 1 12 12 1 21 21 1 22 22 1 , ~ 0,1 (1) 1 1 , ~ 0,1 (2) 1 1 t t t c t c t t t t t t t t c t c t t t t t X Y X X Y N X Y X Y Y X Y u u N X Y where
ij (MG terms) and ij are parameters to be estimated,
j and cj are integer delays and constants respectively. Since the different values of delays can cause to change the dynamic behaviour of the process, we choose the best delay using the Schwarz Information Criteria. The Equation 1 and Equation 2 are similar to the linear Granger counterpart, except that the two equations are fitted to the series using MG terms which can filter difficult dynamics in the time series. The existence of nonlinear causality between variables can be examined by testing the significance of MG terms using F test, which indicates that small variation in one variable can have multiplicative and nonporportional effects on the others. In their studies, Kyrtsou and Labys (2006, 2007) demonstrate that the type of the nonlinear dependence (positive or negative) can be identified by calculating respective sums of coefficients in Equation 1 and Equation 2. When the sum of
ij and (-)
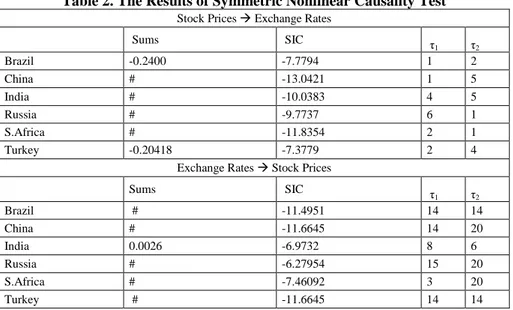
ij is positive, it is expected to observe positive feedback. On the contrary, when the sum is negative, we observe negative feedback behavior.We report the results of symmetric nonlinear causality test in Table 2 by identifying the type of the nonlinear dependence. The results show that there is a significant negative nonlinear feedback from the returns of stock indices to exchange rates in Brazil and Turkey, which confirms the arguments of portfolio balance model and
verifies the results of Tabak (2006). On the other hand, the returns of exchange rates positively cause the returns of the stock prices only in India, which confirms the validity of flow approach and contradicts the results of Rahman and Uddin (2009)
Table 2. The Results of Symmetric Nonlinear Causality Test
Stock Prices Exchange Rates
Sums SIC τ 1 τ2 Brazil -0.2400 -7.7794 1 2 China # -13.0421 1 5 India # -10.0383 4 5 Russia # -9.7737 6 1 S.Africa # -11.8354 2 1 Turkey -0.20418 -7.3779 2 4
Exchange Rates Stock Prices
Sums SIC τ 1 τ2 Brazil # -11.4951 14 14 China # -11.6645 14 20 India 0.0026 -6.9732 8 6 Russia # -6.27954 15 20 S.Africa # -7.46092 3 20 Turkey # -11.6645 14 14
Note: # and show the insignificance of the relevant sums and the causality direction, respectively.
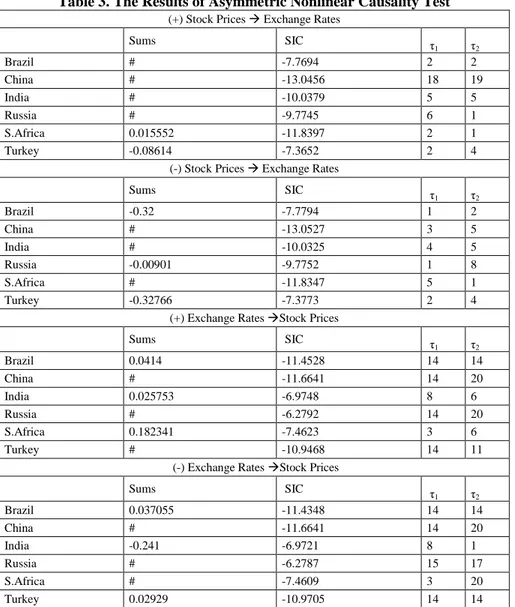
By considering asymmetry in the causality analysis, we can expose hidden information between the pair of series. Hristu-Varsakelis and Kyrtsou (2008) introduce an asymmetric version of the MG causality test which allows testing the existence of asymmetric causal relationship for the pairs of variables and depends on samples of the causing variable being positive or negative. The main difference of this test over the symmetric version is that we calculate the best MG model using only observations satisfy the appropriate conditions. For example, if we want to investigate whether nonnegative samples in the series Y cause the series X, we must include the observations for regression only if Y(t2)0. By this means, we can identify the type of feedback by calculating respective sums of coefficients in Equations 1 and Equation 2. The results of asymmetric nonlinear MG causality test with the type of feedback is presented in Table 3.
Table 3 shows that while positive returns of stock prices positively cause exchange rates in South Africa, and negatively cause in Turkey, which verifies the monetary and the portfolio balance approaches, respectively; there is no causal effects in the remaining countries. In addition, negative returns of stock prices have negative effect on the returns of exchange rates in Brazil, Russia and Turkey, which verifies the monetary approach, but have no effect in China, India, South Africa. In regards to the causality from exchange rate returns to the stock price returns, positive returns positively cause the returns of exchange rates in Brazil, India, South Africa, which confirms both the monetary and the flow approaches, but have no effect in the remaining countries. On the other hand, while there exists a positive causality from the negative returns of exchange rates to the returns of stock prices in Brazil and
Turkey, negative causality exists in India, which confirms both the monetary and the flow approaches and no causality exists in the remaining countries2.
Table 3. The Results of Asymmetric Nonlinear Causality Test
(+) Stock Prices Exchange Rates
Sums SIC τ 1 τ2 Brazil # -7.7694 2 2 China # -13.0456 18 19 India # -10.0379 5 5 Russia # -9.7745 6 1 S.Africa 0.015552 -11.8397 2 1 Turkey -0.08614 -7.3652 2 4
(-) Stock Prices Exchange Rates
Sums SIC τ 1 τ2 Brazil -0.32 -7.7794 1 2 China # -13.0527 3 5 India # -10.0325 4 5 Russia -0.00901 -9.7752 1 8 S.Africa # -11.8347 5 1 Turkey -0.32766 -7.3773 2 4
(+) Exchange Rates Stock Prices
Sums SIC τ 1 τ2 Brazil 0.0414 -11.4528 14 14 China # -11.6641 14 20 India 0.025753 -6.9748 8 6 Russia # -6.2792 14 20 S.Africa 0.182341 -7.4623 3 6 Turkey # -10.9468 14 11
(-) Exchange Rates Stock Prices
Sums SIC τ 1 τ2 Brazil 0.037055 -11.4348 14 14 China # -11.6641 14 20 India -0.241 -6.9721 8 1 Russia # -6.2787 15 17 S.Africa # -7.4609 3 20 Turkey 0.02929 -10.9705 14 14
Note: # and show the insignificance of the relevant sums and the causality direction, respectively. (-) and (+) indicate that we include the relevant observations for regression only when they satisfy the condition that they are non-positive and non-negative respectively.
The evidence for nonlinearity and asymmetry implicitly signals probable regime change(s) in the relationship between stock market and exchange rate. This asymmetric nonlinear relationship in emerging markets may be due to financial
2 In the empirical literature, the relationship between stock prices and exchange rates generally has not
considered the asymmetric effects of the related variables. Therefore, we prefer not to compare our results with other empirical studies for the asymmetric case.
crises, (intrinsic) bubbles, changes in transaction costs and market microstructure, noisy trading, and the regime shifts in the basis (Flood and Marion, 1998).
4. Conclusion
This study investigates the nonlinear causality between exchange rates and stock prices in BRICS and Turkey over the period from January 2000 to September 2011. Considering positive and negative innovations for both variables, we conclude that there are generally significant asymmetric causalities between stock and foreign exchange markets.
Our findings may have several implications. First, the investors may be better able to understand the dynamic linkages between foreign exchange and stock markets. Specifically, they may more easily adopt appropriate hedging strategies to better avoid against currency risk, especially during financial crises. The results may also be used as an indicator for the technical analysis and to evaluate the market efficiency, and therefore, the market participants may predict the future movement of stock prices and exchange rate. Second, the results may be helpful for policy makers with regard to a financial stability perspective, providing central banks with insights into risk transmission between foreign exchange and stock ma rkets. The policy makers may also understand the structure of the financial market in a better way, which facilitates the policy design. In this regard, they should be more careful and attentive in conducting exchange rate and capital market policies due to their impacts on the development of the financial markets. Finally, the results may also allow assessing the level of informational efficiency of the emerging markets. In this context; an existence of nonlinear causal relation may imply market inefficiencies if an investor use them to systematically improve forecasts of returns of stocks and exchange rates, and the performance of a simple trading rule.
Our study brings to the fore some empirical design issues that provide the foundation for further investigation. Future researches between exchange rates and stock market prices can be implemented, for example, by considering the volatility structure, and periodical and cyclical fluctuations, which will help to understand the turning points of the financial markets. Moreover, the market microstructure and the origin of nonlinearities may be considered and examined in the causality testing. It is also possible to employ the use of longer than daily sampling intervals, and test contagion effects among different countries.
5. References
ABDALLA, I.S.A., MURINDE, V. (1997). Exchange rate and stock price interactions in emerging financial markets: Evidence on India, Korea, Pakistan, and Philippines. Applied Financial Economics, 7, pp.25-35.
AGGARWAL, R. (1981). Exchange rates and stock Prices: a study of the U.S. capital markets under floating exchange rates. Akron Business and Economic Review, 12, pp.7-12.
AJAYI, R.A., FRIEDMAN, J., MEHDIAN, S.M. (1998). On the relationship between stock returns and exchange rates: test of Granger causality. Global Finance Journal, 9(2),
AYDEMIR, O., DEMIRHAN, E. (2009). The relationship between stock prices and exchange rates: Evidence from Turkey. International Research Journal of Finance and Economics, 23, pp.207-215.
BAHMANI-OSKOOEE, M., SOHRABIAN, A. (1992). Stock prices and the effective exchange rate of the dollar. Applied Economics, 24(4), pp.459-464.
BRANSON, W., HALTTUNEN, H., MASSON, P. (1977). Exchange rates in the short run: The dollar-deutschemark rate. European Economic Review, 10, pp.303-24.
DONNELLY, R., SHEEHY, E. (1996). The share price reaction of U.K. exporters to exchange rate movements: An empirical study. Journal of International Business Studies, 27, pp.157-165.
DORNBUSCH, R., FISCHER, S. (1980). Exchange rates and current account. American Economic Review, 70, pp.960-971.
FLOOD, R.P., MARION, N. P. (1998). Perspectives on the recent currency crisis literature. NBER Working Paper 6380.
FRANCK, P., YOUNG, A. (1972). Stock price reaction of multinational firms to exchange realignments. Financial Management, 1, pp.66-73.
FRANKEL, J.A. (1983). Monetary and portfolio-balance models of exchange rate determination. BHANDARI, J. S., PUTNAM, B. H.,LEVIN, J. H. (ed.), economic ınterdependence and flexible exchange rates İçinde MIT Press, Cambridge.
GAVIN, M. (1989). The stock market and exchange rate dynamics. Journal of International Money and Finance, 8(2), pp.181-200.
GIOVANNINI, A., JORION, P. (1987). Interest rates and risk premia in the stock market and in the foreign exchange market. Journal of International Money and Finance, 6(1), pp.107-123.
GRANGER, C.W.J., HUANG, B.N., YANG, C.W. (2000). A Bivariate causality between stock prices and exchange rates:Evidence from Recent Asian Flu. Quarterly Review of Economics and Finance, 40, pp.337-354.
HRISTU-VARSAKELIS, D., KYRTSOU, C. (2008). Evidence for nonlinear asymmetric causality in us ınflation, metal, and stock returns. Discrete Dynamics in Nature and Society, pp.1-7.
JORION, P. (1990). The Exchange rate exposure of U.S. multinationals. Journal of Business, 63(3), pp.331-345.
KUMAR, M. (2009). A bivariate linear and nonlinear causality between stock prices and exchange rates. Economics Bulletin, 29(4), pp.2884-2895.
KYRTSOU, C., LABYS, W. C. (2006). Evidence for chaotic dependence between US inflation and commodity prices. Journal of Macroeconomics, 28(1), pp.256-266.
KYRTSOU, C., LABYS, W. C. (2007). Detecting positive feedback in multivariate time series: The case of metal prices and US ınflation. Physica A, 377(1), pp.227-229. KYRTSOU, C., TERRAZA, M. (2003). Is it possible to study chaotic and ARCH behaviour
jointly? Application of a noisy mackey–glass equation with heteroskedastic errors to the Paris stock exchange returns series. Computational Economics, 21(3), pp.257-276. LU, Y. C., CHANG, T., HUNG, K., LIU, W. C. (2010). Mean reversion in G-7 stock prices:
Further evidence from a panel stationary test with multiple structural breaks. Mathematics and Computers in Simulation, 80, pp.2019-2025.
MORLEY, B., PENTECOST, E.J. (2000). Common trends and cycles in G-7 countries exchange rates and stock prices. Applied Economics Letters, 7(1), pp.7-10.
MURADOĞLU, G., TAŞKIN, F., BİGAN, I. (2001). Causality between stock returns and macroeconomic variables in emerging markets. Russian and East European Finance and Trade, 36, pp.33-53.
RAHMAN. L., UDDIN, J. (2009). Dynamic relationship between stock prices and exchange rates: Evidence from three South Asian countries. International Business Research, 2(2),
SOENEN, L. A., HENNIGAR, E. S. (1988). An analysis of exchange rates and stock prices: The U.S. experience between 1980 and 1986. Akron Business and Economic Review, 19, pp.7-16.
SOLNIK, B. (1987). Using financial prices to test exchange rate models: A note. Journal of Finance, 42(1), pp.141-149.
TABAK, B.M. (2006). The dynamic relationship between stock prices and exchange rates: Evidence for Brazil. International Journal of Theoretical and Applied Finance, 9(8),
pp.1377-1396.
ÜLKÜ, N., DEMİRCİ, E. (2012). Joint dynamics of foreign exchange and stock markets in emerging Europe. Journal of International Financial Markets, Institutions and Money, 22(1), pp.55-86.