Asosiasi 2 peubah
X
Y
Sering dibahas
Confounding
• In statistics, a confounding variable (also confounding factor, a
confound, or confounder) is an extraneous variable in a statistical
model that correlates (directly or inversely) with both the
dependent variable and the independent variable.
• Confounding variables are variables that the researcher fail to
control, or eliminate, damaging the internal validity of an
experiment.
Usia
Tingkat
Prestasi
Jenis
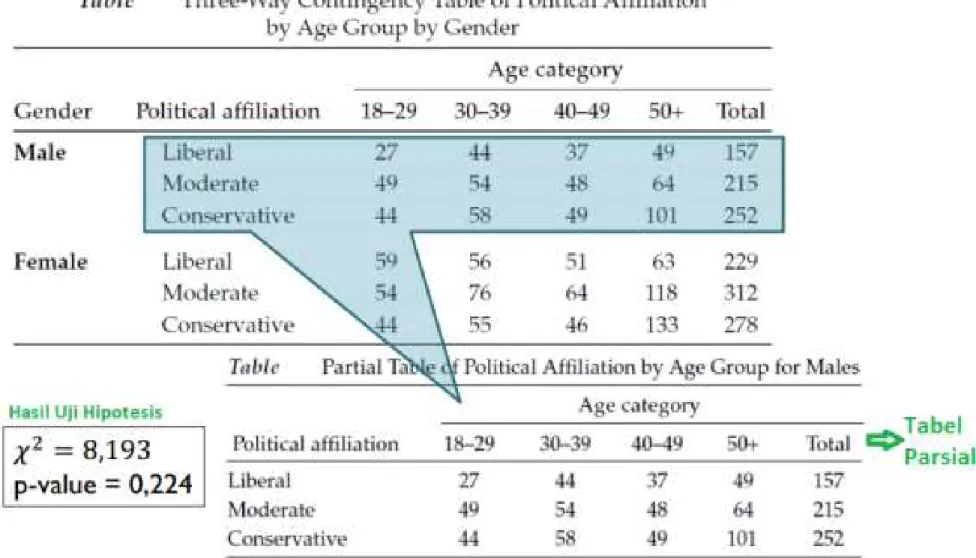
Analisis dengan tabel yang lebih sederhana:
1. Tabel Parsial ( Partial Table) : tabel yang lebih
sederhana yang diperoleh dengan hanya
melihat pada salah satu kategori peubah lain
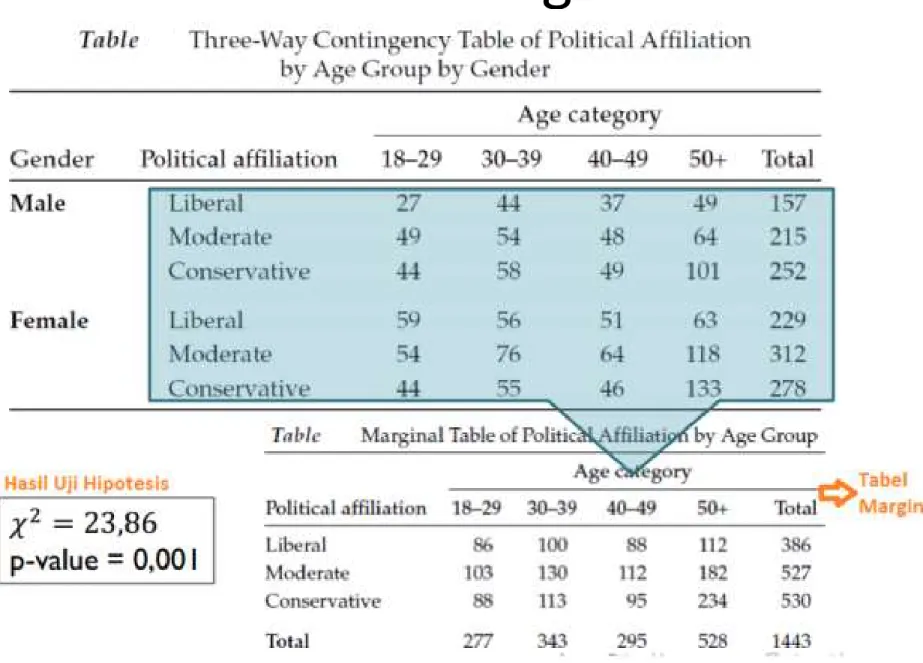
2. Tabel Marginal (Marginal Table) : adalah tabel
yang lebih sederhana yang diperoleh tanpa
melihat kategori peubah lain (kategori peubah
lain digabungkan).
Tabel Parsial (lanjutan)
• Pengujian hipotesis tentang ada/tidaknya
hubungan antar variabel kategorik dapat
dilakukan pada tabel parsial seperti dengan
uji
chi-square
.
• Ukuran asosiasi pada tabel parsial disebut
dengan conditional association. Ukuran
asosiasi disini bisa seperti
odds ratio
,
relative
risk
atau
koefisien gamma
Tabel Marginal (lanjutan)
• Pengujian hipotesis tentang ada/tidaknya
hubungan antar variabel kategorik dapat
dilakukan pada tabel marginal seperti dengan
uji chi-square. Ukuran asosiasi pada tabel
parsial disebut dengan marginal
association. Ukuran asosiasi disini bisa seperti
odds ratio, relative risk atau koefisien gamma.
• Uji Breslow-Day digunakan untuk menguji
ada/tidaknya terdapat hubungan yang
homogen antar 3 variabel pada tabel 3 arah
dengan hopotesis awal adanya asosiasi
homogen.
• UjiCochran–Mantel–Haenszel (CMH) untuk
menguji ada/tidaknya conditional associatian
pada tabel 3 arah dengan hipotesis awal
EPI 809/Spring 2008 14
Ilustrasi
• The data set Migraine contains hypothetical
data for a clinical trial of migraine treatment.
Subjects of both genders receive either a new
drug therapy or a placebo. Assess the effect of
new drug adjusting for gender.
EPI 809/Spring 2008 15
Example - Migraine
Response
Treatment
Better
Same Total
Active
28
27
55
Placebo
12
39
51
Total
40
66
106
Pearson Chi-squares test p = 0.0037
EPI 809/Spring 2008 16
Example – Migraine
Male
Response
Treatment
Better
Same Total
Active
12
16
28
p = 0.2205
Placebo
7
19
26
Total
19
35
54
Female
Response
Treatment
Better
Same Total
Active
16
11
27
p = 0.0039
Placebo
5
20
25
uji ini digunakan untuk menguji ada tidaknya 3-way
interaction/association (interaksi/asosiasi 3 arah)
H0: Terdapat asosiasi homogen (tidak ada 3-way
interaction/association)
vs
H1: Tidak terdapat asosiasi homogen (ada 3-way
interaction/association)
H0 ditolak jika nilai p-value kurang dari taraf signifikansi yang
digunakan (p-value<alpha).
Tolak H0 berarti ada 3-way interaction. Jika H0 tidak ditolak berarti
terjadi homogeneous association dan conditional association antar
setiap 2 variabel adalah sama pada setiap level variabel ketiga
(terdapat homogeneous associations dalam data).
Hipotesis
H
0
: OR
M
=OR
F
Sebaran antara grup perlakuan dan respon yang
dihasilkan sama (tidak berbeda ) pada jenis kelamin yang
berbeda
VS
H
1
: OR
M
≠ OR
F
Ada asosiasi keseluruhan antara grup perlakuan dan
respon yang dihasilkan di kelompok jenis kelamin yang
berbeda
Statistik Uji
r
k
k
MH
MH
k
k
BD
n
Var
n
E
n
1
11
2
11
11
2
)
ˆ
;
(
)
ˆ
;
(
Under H
0, Breslow-Day test statistics has a chi-squared distribution with
degrees of freedom r-1.
EPI 809/Spring 2008 21
SAS- codes
data Migraine;
input Gender $ Treatment $ Response $ Count @@;
datalines;
female Active Better 16 female Active Same 11
female Placebo Better 5 female Placebo Same 20
male Active Better 12 male Active Same 16
male Placebo Better 7 male Placebo Same 19
;
proc freq data=Migraine;
weight Count;
tables Gender*Treatment*Response / cmh noprint;
title1 'Clinical Trial for Treatment of Migraine Headaches';
run;
************* In SAS, Need to put Exposure BEFORE Disease to generate
right results for CMH results;
EPI 809/Spring 2008 22
SAS Output
The FREQ Procedure
Summary Statistics for Treatment by Response Controlling for Gender
Cochran-Mantel-Haenszel Statistics (Based on Table Scores) Statistic Alternative Hypothesis DF Value Prob ƒƒƒƒƒƒƒƒƒƒƒƒƒƒƒƒƒƒƒƒƒƒƒƒƒƒƒƒƒƒƒƒƒƒƒƒƒƒƒƒƒƒƒƒƒƒƒƒƒƒƒƒƒƒƒƒƒƒƒƒƒƒƒ 1 Nonzero Correlation 1 8.3052 0.0040 2 Row Mean Scores Differ 1 8.3052 0.0040 3 General Association 1 8.3052 0.0040
Estimates of the Common Relative Risk (Row1/Row2)
Type of Study Method Value 95% Confidence Limits ƒƒƒƒƒƒƒƒƒƒƒƒƒƒƒƒƒƒƒƒƒƒƒƒƒƒƒƒƒƒƒƒƒƒƒƒƒƒƒƒƒƒƒƒƒƒƒƒƒƒƒƒƒƒƒƒƒƒƒƒƒƒƒƒƒƒƒƒƒƒƒƒƒ Case-Control Mantel-Haenszel 3.3132 1.4456 7.5934 (Odds Ratio) Logit 3.2941 1.4182 7.6515 Cohort Mantel-Haenszel 2.1636 1.2336 3.7948 (Col1 Risk) Logit 2.1059 1.1951 3.7108 Cohort Mantel-Haenszel 0.6420 0.4705 0.8761 (Col2 Risk) Logit 0.6613 0.4852 0.9013
Breslow-Day Test for Homogeneity of the Odds Ratios ƒƒƒƒƒƒƒƒƒƒƒƒƒƒƒƒƒƒƒƒƒƒƒƒƒƒƒƒƒƒ Chi-Square 1.4929 DF 1 Pr > ChiSq 0.2218
The large p-value for the Breslow-Day test
(0.2218) indicates no significant gender
difference in the odds ratios.
tidak tolak hipotesis nol dan simpulkan
terdapat asosiasi homogen atau tidak
terdapat interaksi 3 variabel pada tabel 3
arah diatas.
However, for the Breslow-Day test to be
valid, the sample size should be relatively
large in each stratum, and at least 80% of
the expected cell counts should be greater
than 5.
Setelah di lakukan uji Breslow-Day dan ternyata
terima hipotesis awal yang menunjukan adanya
asosiasi homogen, maka bisa dilakukan
uji Cochran–Mantel–Haenszel (CMH) testuntuk
menguji ada/tidaknya conditional association dalam
three-way tables (apakah terjadi two-way
interaction).
Hipotesis nol dari CMH test adalah
semua
conditional odds ratios
bernilai 1. Jika H0
ditolak, berarti minimal ada satu conditional
odds
ratio
≠ 1 dan terjadi partial/conditional association
dalam data.
The Cochran–Mantel–Haenszel Test
Digunakan ketika efek dari peubah
penjelas terhadap peubah respon
dipengaruhi oleh kovariat yang
dapat dikendalikan.
untuk menguji ada/tidaknya
conditional association dalam
three-way tables (apakah terjadi
two-way interaction)
Cochran- Mantel-Haenszel Test
• Cochran- Mantel-Haenszel test is to test whether the
common conditional (adjusted) odds ratio of y and x
equals to one, i.e.
• Of course, one can use the confidence interval of to
test this null hypothesis. The problem with using
confidence interval for hypothesis testing is the failure
of obtaining p-value.
1
:
0
H
Cochran- Mantel-Haenszel Test
• The idea of CMH test is similar to that of
Breslow-Day test: under the null hypothesis,
•
is close to its mean for each k. As a
result, the total is also close to its mean,
k
r
E
n
k
1
(
11
1;
)
k
r
n
k
1
11
11
k
n
E
(
n
k
11
1;
)
Cochran- Mantel-Haenszel Test
• Cochran- Mantel-Haenszel test statistics takes the
form:
• Under the null hypothesis, Cochran- Mantel-Haenszel
test statistics has a chi-squared distribution with
degrees of freedom 1.
)
1;
(
)
1;
(
11
1
1
1
2
11
11
2
k
r
k
r
k
r
k
k
k
CMH
n
Var
n
E
n
Hipotesis
H
0
: OR
M
=OR
F
=1
Tidak ada interaksi
VS
H
1
: Ada minimal 1 OR≠1, dan terjadi
partial/conditional association
CMH Statistic 1: Nonzero Correlation
• Tests the null hypothesis of no association vs. the alternative
hypothesis that there is a linear association between the row
and column variables in at least one stratum
• Both row and column variables have to be ordinal
• Under H
0
, ~ χ
2
with 1 df
CMH Statistic 2: Row Mean Scores Differ
• Tests the null hypothesis of no association vs. the alternative
hypothesis that the mean scores of the table rows are unequal
for at least one stratum
• Useful only when the column variable is ordinal
• Under H
0
, ~ χ
2
with (r – 1) df
CMH Statistic 3: General Association
• Tests the null hypothesis of no association vs. the alternative
hypothesis that there is some kind of association between the
row and column variables for at least one stratum
• Does not require the row or column variable to be ordinal
• Under H
0
, ~ χ
2
with (r – 1)(c – 1) df
EPI 809/Spring 2008 33
SAS Output
The FREQ Procedure
Summary Statistics for Treatment by Response Controlling for Gender
Cochran-Mantel-Haenszel Statistics (Based on Table Scores) Statistic Alternative Hypothesis DF Value Prob ƒƒƒƒƒƒƒƒƒƒƒƒƒƒƒƒƒƒƒƒƒƒƒƒƒƒƒƒƒƒƒƒƒƒƒƒƒƒƒƒƒƒƒƒƒƒƒƒƒƒƒƒƒƒƒƒƒƒƒƒƒƒƒ 1 Nonzero Correlation 1 8.3052 0.0040 2 Row Mean Scores Differ 1 8.3052 0.0040 3 General Association 1 8.3052 0.0040
Estimates of the Common Relative Risk (Row1/Row2)
Type of Study Method Value 95% Confidence Limits ƒƒƒƒƒƒƒƒƒƒƒƒƒƒƒƒƒƒƒƒƒƒƒƒƒƒƒƒƒƒƒƒƒƒƒƒƒƒƒƒƒƒƒƒƒƒƒƒƒƒƒƒƒƒƒƒƒƒƒƒƒƒƒƒƒƒƒƒƒƒƒƒƒ Case-Control Mantel-Haenszel 3.3132 1.4456 7.5934 (Odds Ratio) Logit 3.2941 1.4182 7.6515 Cohort Mantel-Haenszel 2.1636 1.2336 3.7948 (Col1 Risk) Logit 2.1059 1.1951 3.7108 Cohort Mantel-Haenszel 0.6420 0.4705 0.8761 (Col2 Risk) Logit 0.6613 0.4852 0.9013
Breslow-Day Test for Homogeneity of the Odds Ratios ƒƒƒƒƒƒƒƒƒƒƒƒƒƒƒƒƒƒƒƒƒƒƒƒƒƒƒƒƒƒ Chi-Square 1.4929 DF 1 Pr > ChiSq 0.2218