Applied Statistics and Probability for E (2)
Teks penuh
Gambar


Garis besar
Dokumen terkait
The second part is the study of probability, which begins at the basics of sets and the equally likely model, journeys past discrete / continuous random variables, and continues
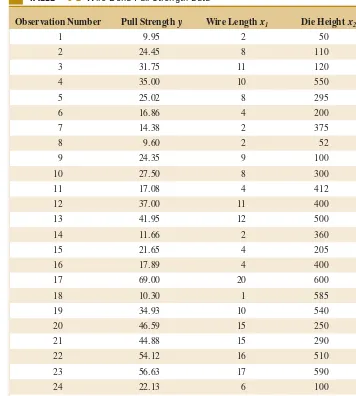
Suppose that n measurements have been taken on the random variable under consideration (eg number of syntax errors, downloading time).. Denote these measurements by
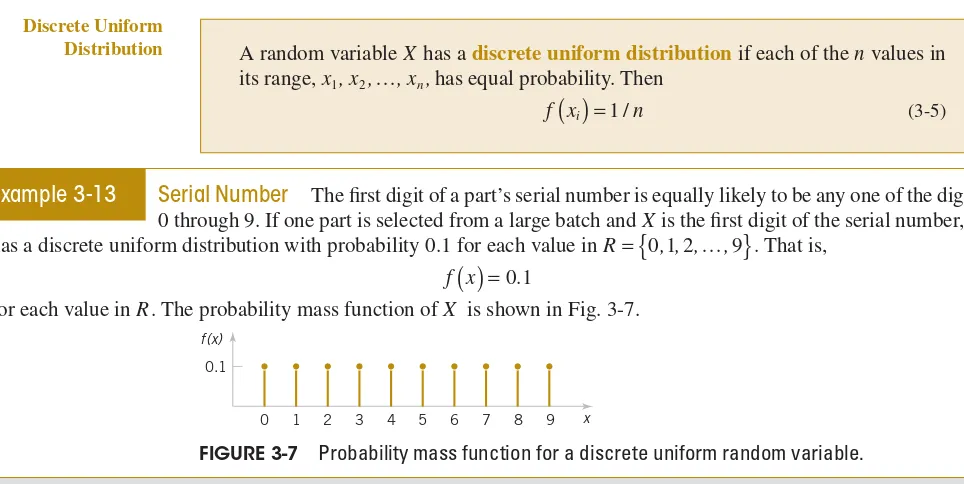
In the case of tossing a coin three times, the variable X, representing the number of heads, assumes the value 2 with probability 3/8, since 3 of the 8 equally likely sample
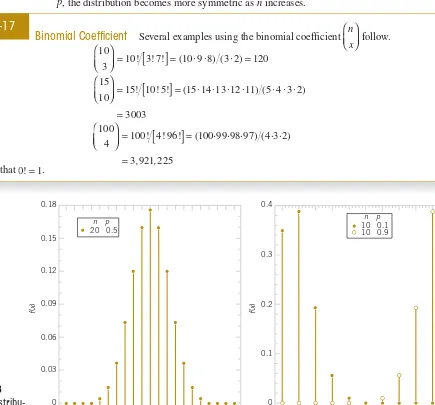
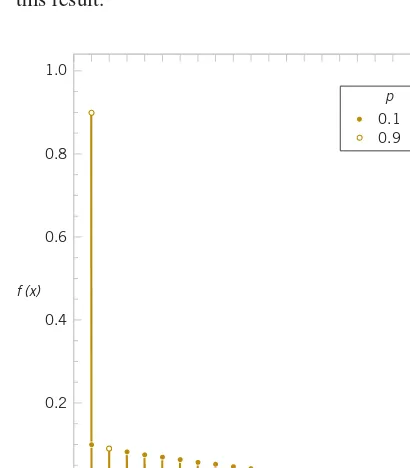
The probability distribution of this discrete random variable is called the binomial distribution , and its values will be denoted by b ( x ; n, p ) since they depend on the number
Although the method of transforming variables provides an effective way of finding the distribution of a function of several variables, there is an alternative and often
In such a case, if X is the random variable denoting the number of blue marbles chosen (successes) in n trials, then using the binomial distribution (1) we see that the probability
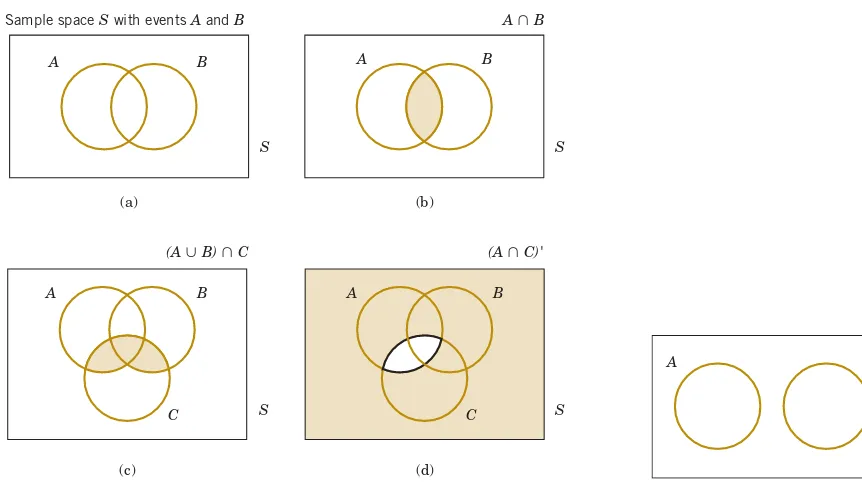
Random variables Definition random variable: Given an experiment with sample space S, a random variable is a function from the sample space S to the real numbers, X :S → R.. We usually
Properties The mathematical expectation mean value of a random variable [ [ Z , gi- ven on a general probability space ሺ:ǡ ࣠ǡ ܲሻǡ is denoted by M[ and is determined gradually, in three
