CHAPTER III RESEARCH METHOD
In this part, the researcher describe about research methodology that used in conducting the research. It purpose to answer the problem of the study. This chapter consists of: Research design, population and sample, data collecting procedures, instruments of the study, and instrument try out.
A.Research Types
The type of this study is think aloud study. The study uses the think aloud method because the problem of the study will answer by using think aloud method to describe the students’ ability in reading narrative text.
B.Research Design
The recent study was an experimental research to find out the result of a certain technique. Experimental design is one of the precise methods to examine the cause and effect because of the fact, instruction toward a group and experimental sample. The instructional activity was designed only to teach reading skill students by using Think aloud strategy as a techniques toward the experimental group, the group of sample would have test to measure the effect that students get after treatment. The result of the test would be analyzed and compare using statistical computation.
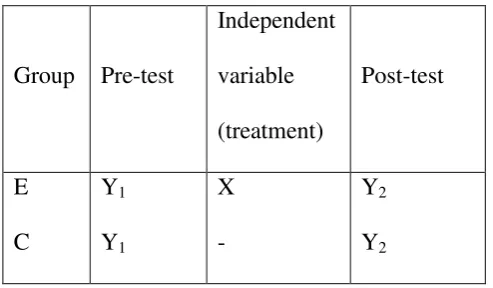
This study tries to describe the effect of treatment of two distinction, Think aloud strategy and reading skill, the research design is pre-test and post-test. Therefore, the design is called a pre-test and post-test control group design.
Table 3.1 Randomized group, pre-test and post-test
Group Pre-test
Independent variable (treatment)
Post-test
E C
Y1 Y1
X -
Y2 Y2 Notes :
E = experimental group C = control group Y1 = pre-test
X = treatment on the experiment group Y2 = post-test
This research design will present several characteristics :
a. It has two groups of experimental subjects or treatment group and control group
b. The two groups compared with respect two measurements of observation onthe dependent variable
c.Both groups will be measured twice, the first measurement serve as the pre-test and the second as the post-pre-test
d.Measurement on the dependent variable for both groups will be done at the same time with the same test
C. Population and Sample 1. Population
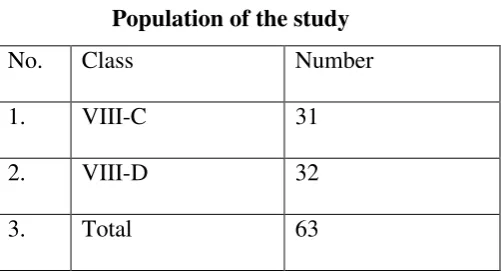
In this study, the population of the study includes all eight grade students of the MTsN 2 Palangkaraya amount 234 students in VIIA, VIIIB, VIIIC, VIIID, VIIIE, VIIIF, in the academic year 2015/2016. there are as the population and for observation the samples are only 63 students consist of 2 classes namely experimented class and control class MTsN 2 Palangkaraya.
The writer gave the code based on the form of the data. Code is a sign which is made in number or letters that was given to identify the information or data that is analyzed. For example the students name replaced with the code such as E-01, C-02, TO-03, and the like. The codes are available in appendix.
Table 3.2
Population of the study
No. Class Number
1. VIII-C 31
2. VIII-D 32
2. Sample
Sample is a subset of individuals or case from within a population.1To determine the students as experiment group the researcher used cluster sampling. Cluster sampling is used if the population does not consist of individuals, but groups or cluster.2 Because the population of this study was the students of the eight grade of MTsN-2 Palangka Rayawhich they consist of six classes.
Therefore, the writer chosedVIII- C and VIII-D as the sample because they represented the average English score of the whole population. The VIII-C class became the control class and VIII-D became the experimental class. D. Research Instrument
In any scientific research, instrument for collecting data was absolutely important. The accuracy of the result of research was mostly dependent on how accurate the use of instrument. Before research carried out, the instrument for the data collection should be well prepared.
Related to the research problems, the writer used reading test as an instrument. The test used must be appropriate in term of our object, the dependable in the evidence provides, and applicable to our particular situation. In this case, the researcher gave the students reading test in using think aloud strategy.
1
David Nunan, Research Methods in Language Learning, New York:Cambridge University Press, 1992, p. 232.
2
The schedule to get the data is available in appendix, where the students was asked to tell by using Think aloud Strategy was used to make the students achievement in reading skill at MtsN-2 Palangka Raya.
1. Test Try Out
In order to prove the test was suitable to the students who were the sample of this study, the writer conducted a try out test. Then, the writer choosed the students in the same school but different class to try out the test. The try out test conducted on February, 16th 2016 at MTsN-2 Palangka Raya. VIII- Cwas as the try out class with 31 students. The test was students’ reading comprehension score in multiple choice test form
and there are 50 items. The result of the try out test was there were 13 items was invalid and there were 37 items was valid. The researcher used 35 items to give the pre-test.
In the other time, the writer did the same thing to give the try out test for getting the post test item. But, the writer choosed the different class to test the try out. The try out test conducted on February17th 2016 at MTsN-2 Palangka Raya. VIII-D was as the try out class with 27 students. The test was students’ reading comprehension score in multiple choice test
2. Test Validity
a. Content Validity
The researcher would try out the instrument before it applies to give pretest to the real sample. The researcher obtains the instrument quality consist of instrument validity and instrument reliability. The test will be tried to the students of MTsN-2 Palangka Raya in class VIII C and VIII D
In this case, the students assign to read a text and answer questions. Then, the researcher gives score and analyzes the obtain data to check the instrument reliability.
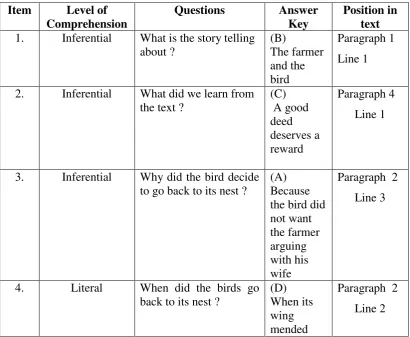
Table 3.3Test Item Specifications Item Level of
Comprehension
Questions Answer
Key
Position in text 1. Inferential What is the story telling
about ? 2. Inferential What did we learn from
the text ?
5. Literal Where did the farmer
information discussed in the third paragraph ? according to the text ?
(D) 11. Inferential What is the story telling
about ?
13. Inferential Why did the elephant’s help the trap elephants ?
(C)
information discussed in the third paragraph ?
Literal Which statement is NOT TRUE according to the
22. Inferential What did we learn from saved her step children ?
(D) putting some stew in the oven ?
Literal Where did the story take place ?
open and the stepmother shut the door” (P4).
information discussed in the last paragraph ?
29. Literal Which statement is NOT TRUE according to the
30. Literal What did the stepmother do to her children ?
(C)
Saved them
31. Inferential What is the story telling
32. Inferential What did we learn from the text ?
33. Inferential Why did the mouse help the lion ?
39. Literal Which statement is NOT TRUE according to the text ?
(C) The lion ate the little mouse
41. Inferential What is the story telling about ?
kicked the meat to the rabbit’s house
48. Literal What is the main
information discussed in the last paragraph ?
49. Literal Which statement is NOT TRUE according to the
To measure the validity of the instrument, the writer used the formulation of Product Moment by Pearson as follows:3
r
xy=
𝐍𝚺𝐗𝐘−(𝚺𝐗)( 𝚺𝐘) √{𝐍𝚺𝐗²−(𝚺𝐗) ²}{𝐍𝚺𝐘²−(𝚺𝐘) ²}
Where:
rxy : Total coefficient of correlation
ΣX : Total Value of Score X ΣY : Total Value of Score Y
ΣXY : Multiplication Result between Score X and Y N : Number of students
3
To know the level of validity of instrument, the value of was interpreted based on the qualification of validity as follows:
rxy>t-table = Valid rxy<t-table= Not Valid
To assess students’ ability of English reading comprehension the researcher will do the Reading Comprehension test, then the writer score to each student by using the formula:
S= 𝒏
𝑵 x100
Where:
S = students’ score
n = number of true answer N = number of test items
Table 3.4
The Scoring Rubric for The Measurement of Reading Comprehension Mark Value Letter Value Heavy Value Predicate
80-100 A 4 Excellent
70-<80 B 3 Good
60-<70 C 2 Enough
50-<60 D 1 Less
0-<50 E 0 Fail
b. Face Validity
For face validity of the test items as follow:
a) The test used reading test in multiple choice test instruction.
c) The language of items used English.
d) The reading test was suitable with syllabus of English writing for VIIIth MTsN-2 Palangka Raya. c. Construct Validity
If a test has construct validity, it is capable of measuring certain specific characteristic in accordance with a theory of language behavior and learning. Construct validity refers to the practical test developed from a theory.
The tests would be based on the syllabus in making. The test will be refers to scope and limitation of the study. The test is about narrative text, reading literacy (Literal) and reading interpretative (inferential) which is refers to junior High School students. The item test is suitable with the syllabus of the eighth grade students of MTsN-2 Palangka Raya
E. Test Reliability
Reliability refers to the consistency of test score. It means how consistent test scores or other evaluation results are from one measurement to another.4 Basically there are three basic methods and the type of information each provides are as follow:
a. Test–Retest method, which indicates the stability of test scores over some given period of time.
b. Equivalent forms method, which indicates the consistency of test scores over different forms of the test.
c. Internal consistency method, which indicates the consistency of test scores over different parts of the test.
The steps in determining the reliability of the test were: a) Making tabulating of tester’s scores.
b) Measuring the mean of the testers’ scores with the formula :
M= 𝑿
𝑵x100
c) Measuring the total variants with the formula:
S2= 𝑿
𝟐− 𝑿 𝟐 𝑵
𝑵
Where:
S2= the total variants
ΣX = the total of score
ΣX2
= the square of score total N = the number of testers
d) Calculating the instrument reliability using KR-21. r11= 𝒌
𝒌−𝟏 𝟏 −
𝑴 𝒌−𝑴 𝒌.𝑺𝟐
Where:
r11= Reliability of instrument k = the number of items
e) The last decision is comparing the value of r11 and Ttable
f) To know the level of reliability of instrument, the value of r11was interpreted based on the qualification of reliability as follows:
r11>Ttable = Reliable r11 <Ttable= Not Reliable
Table 3.5 Criteria of Reliability
Reliability Interpretation 0.800- 1.000 Very High Reliability 0.600-0.799 High Reliability 0.400-0.599 Fair Reliability 0.200-0.399 Poor Reliability 0.000-.0199 Very Poor Reliability
F. Data CollectionTechniques The problem of this study:
What is effect ofthink aloud strategy toward the students’ reading skill at the Eight grade of MTsN-2 Palangka Raya.To collect the accurate data in this study, the researcher selects the instrumentsthat will be appropriate for the problem statement:
1. Documentation
study, this method is used to get the data that related to the object ofresearch such as students’ name list which are included in the
population.In this case, the data was gained by the help of the English teacher.
2. Test
Test is a set of questions or exercises and other tools which areused to measure skill, intelligence, knowledge, and ability those are hadby individual or group. The method of collecting data for this research is used testing. A test is a group of questions, tasks or exercises for measuring individual or groups skill. The contents or the reading task include factual question, determining a title and determining the main idea.
G. Data Collections Procedure
The technique of data analysis, will be used here is statistical analysis that is descriptive analysis. The writer do some ways in the data analysis procedures, they are as follows:
The writer do some ways in the data analysis procedures, they are as follows:
1. Observe the class
2. Determine two classes from the population into experiment group and control group
3. Take students’ score before treatment by giving the pretest
6. Evaluate the treatment by giving the post test to experiment and control group
7. Give score to the data from experiment group and control group 8. Analyze the data that have been obtained from pre-test and post test 9. Interpretation the analysis result
10.Conclude the activity of the study whether think aloud strategy can
increase the students’ reading skill or not, based on the obtain
11.Collecting the students’ written scores of Pre-test and post- test.
12.Arranging the obtained score into the distribution of frequency of score table.
13.Calculating mean, median, modus, standard deviation and standard error of students’ score.
14.Measuring the normality, homogeneity, and linearity.
15.Analyzingthe data by using one-way T Test to answer the problem of the study. In addition, the SPPS 17program is applied.
16.Interpreting the result of analyzing data.
17.Making discussion to clarify the research finding. 18.Giving conclusion.
H. Data Analysis
The data of this study were students’ reading ability score. Therefore, the
pretest and post-test scores of the experiment and control groups. The writer used statistical ttest to answer the problem of the study. In Order to analyze the data, the writer did some way procedures:
1. Gave tests to the students of the eighth grade students at MTsN-2 Palangka
Raya.
2. Collected the data of the students work sheet test result.
3. Scored the students’ answers using the formula: S= 𝒏
𝑵𝒙𝟏𝟎𝟎
Where: S= Students’ score
n= number of true answer N= number of test items
4. Tabulated the data into the distribution of frequency of score table, then
find out the mean of students’ score, standard deviation, and standard error
of variable X1 (Experimental group) and X2 (Control group) by using the
formulas bellow:
a. Mean of students’ score
𝑿 = 𝑭𝑿𝒊 𝒏
Where:
FXi = total of score
n = total of the students
b. Standard deviation5
S= 𝒏 𝑭𝒙𝒊𝟐+ 𝑭𝒙𝒊𝟐
𝒏(𝒏−𝟏)
c. Standard Error6
5
SEmd= √𝑵−𝟏𝑺
Where:
S= Standard deviation
n1= the number of the experimental group
n2= the number of the control group
SEmd= Standard error
N= Number of Case
5. Normality Test
Itisusedtoknowthenormalityofthedatathatisgoingtobe analyzed whether both groups have normal distribution or not. Chi square is used here7
X2observed= (𝑓𝑜−𝑓𝑒)2
𝑓𝑒 𝑘
𝑖=1
Notice:
X2observed = Chi square
fo = frequency from observation
fe= expected frequency
CalculationresultofX2observedwascomparedwith𝐗𝟐𝐭𝐚𝐛𝐥𝐞by5%and 1% degreeof significance. If X2observedwas lower than 𝐗𝟐𝐭𝐚𝐛𝐥𝐞so the distribution list was normal.
6. Homogeneity Test
It isusedtoknowwitherexperimentalgroupandcontrolgroup, thatweredecided,comefrompopulationthathasrelatively samevariantor not.
6
Sudjana, Metode Statistika, Bandung: Tarsito, p. 273. 7Ibid,
The formula was:8
𝑿𝟐
𝒐𝒃𝒔𝒆𝒓𝒗𝒆𝒅= 𝒍𝒐𝒈𝟏𝟎 𝒙 (𝑩 − 𝒅𝒌 𝐥𝐨𝐠 𝑺𝟐𝒊
Where: B= (𝐥𝐨𝐠 𝑺𝟐𝒊)𝒙 (𝒏𝒊− 𝟏)
Notice: 𝑿𝟐
𝒐𝒃𝒔𝒆𝒓𝒗𝒆𝒅≤𝑿𝟐𝒕𝒂𝒃𝒍𝒆, is homogeneity.
𝑿𝟐
𝒐𝒃𝒔𝒆𝒓𝒗𝒆𝒅≥𝑿𝟐𝒕𝒂𝒃𝒍𝒆, is not homogeneity.
Ifcalculationresultof𝑿𝟐𝒐𝒃𝒔𝒆𝒓𝒗𝒆𝒅waslowerthan𝑿𝟐𝒕𝒂𝒃𝒍𝒆by5%degreeof significance, it meat both groups had same variant.
7. Calculated the data by using ttest to test the hypothesis of the study, whether
the using of think aloud gave effect to the students’ reading comprehension
skill scores or not. To examined the hypothesis, the writer used ttestformula
as follows:9
tobserved= 𝑀𝑛1−𝑀𝑛2
𝑛1−𝑛2 𝑆12 + 𝑛2−1 𝑆22
𝑛1+𝑛2−2 ( 1
𝑛1+ 1
𝑛2)
Where:
Mn1 = the mean score of experimental group
Mn2 = the mean score of control group
S12= variance of experimental group S22= variance of control group n1= total of experimental group students
n2= total of control group students
8Ibid, p. 177. 9Ibid,
To know the hypothesis was accepted or rejected using the criterion: If
tobserved (the value)≥ttable, it means Ha is accepted and Ho is rejected.If
tobserved (the value)≤ttable, it means Ha is rejected and Ho is accepted.
8. Interpreted the result of ttest. Previously, the writer accounted the degrees of
freedom (df) with the formula:10
df = (N1+N2-2)
Where:
df: degrees of freedom
N1: Number of subject group 1
N2: Number of subject group 2
2: Number of variable
After that, the value of ttest will be consulted on the ttable at the level of
significance 1% and 5%. If the result of ttest was higher than ttable, it meat Ha
was accepted. But if the result of ttest was lower than ttable, it means Ho was
accepted.
9. The writer made the conclusion of data analysis obtained.
10.In addition, the writer used SPSS 17.00 program to compare the data
11.Discussed and conclude the result of data analysis.
Figure 3.1 Steps of Collecting, Data Analysis Procedure and Testing Hypothesis
10
Reading Class
Reading Narrative Text with Think Aloud Strategy
Experiment Group Control Group
Pre-Test Scoring Pre-Test
Treatment by Taught Think AloudStrategy
Teaching Uses Think AloudStrategy
Post-Test
Post-Test Scoring
Interpretation
Testing Hypothesis Using T Test
Measuring Normality and Homogeneity