Ecology and Epidemiology
Geospatial and Temporal Analyses
of
Bean pod mottle virus
Epidemics
in Soybean at Three Spatial Scales
E. Byamukama, S. K. Eggenberger, R. A. Coelho-Netto, A. E. Robertson, and F. W. Nutter, Jr.
First author: Department of Plant Science, South Dakota State University, Brookings 57007; second, fourth, and fifth authors: Department of Plant Pathology and Microbiology, Iowa State University, Ames 50011; and third author: The National Institute for Research in the Amazon (INPA), Manaus, AM 2223, Brazil.
Accepted for publication 28 September 2013.
ABSTRACT
Byamukama, E., Eggenberger, S. K., Coelho-Netto, R. A., Robertson, A. E., and Nutter, F. W., Jr. 2014. Geospatial and temporal analyses of Bean pod mottle virus epidemics in soybean at three spatial scales. Phyto-pathology 104:365-378.
A statewide survey was carried out from 2005 through 2007 to quantify, map, and analyze the spatial dynamics and seasonal patterns of
Bean pod mottle virus (BPMV) prevalence and incidence within Iowa. In all, 8 to 16 soybean fields were arbitrarily sampled from 96 counties in 2005 and all 99 counties in 2006 and 2007. Field- and county-scale BPMV prevalence and incidence data were mapped using geographic information systems software. BPMV prevalence was highest in the 2006 soybean growing season, when BPMV was detected in 38.7% of all soybean fields, 91.9% of all counties, and 100% of the agricultural climate districts. BPMV incidence at the field scale was highest in 2006, when mean statewide end-of-season incidence was 24.4%. Spatial analyses indicated that BPMV incidence was spatially clustered at the county scale in all three growing seasons. Prevalence at the county scale
was clustered in 2005 and 2007 but not in 2006. Semivariogram analyses at the field scale indicated the presence of significant (P≤ 0.05) spatial dependence (clustering) at distances ≤23.4 km in 2005, 297.7 km in 2006, and 45.2 km in 2007. Data for county-scale incidence displayed a north (low incidence) to south (high incidence) BPMV gradient in each year of the survey. High county-scale BPMV prevalence and incidence levels in 2006 were significantly associated with BPMV prevalence and incidence in 2007 (P≤ 0.05). Soybean fields with narrow row spacings (≤38 cm) were associated with higher levels of BPMV incidence. Soybean fields infected with BPMV had a higher probability of infection by Phomopsis pod and stem blight than did non-BPMV-infected fields. This study provides new quantitative tools and information to better understand the seasonal, temporal, and geographical distribution of BPMV disease risk at several spatial scales.
Additional keywords: disease surveys, geographic information systems,
Glycine max.
Iowa leads the nation in soybean (Glycine max L. Merr.) production, accounting for ≈15.3% of the soybean produced in the United States in 2011 (30). However, a number of plant pathogens continue to limit soybean production, including Bean pod mottle virus (BPMV), which is a threat to soybean production in the U.S. North Central Region (11,40). Yield losses caused by BPMV have been reported to be as high as 52% (12,15,49). This plant virus can also negatively impact seed quality by increasing the incidence of seed coat mottling in seed lots (11–13). Previous research has shown that disease symptoms and yield reductions in soybean plants co-infected with both BPMVand Soybean mosaic virus (SMV) are more severe than disease symptoms and yield losses caused by either virus alone (2,5). It has also been reported that BPMV infection can predispose soybean plants to infection by Phomopsis and Diaporthe spp., resulting in increased seed deterioration and decreased seed quality and seed germination (1,46). However, because these interaction studies were con-ducted with artificially inoculated plants, the probabilities with which such co-infections actually occur at the field scale remain unknown.
Although BPMV was first reported in Iowa in 1966 (39), BPMV has only recently been recognized as a potential threat to soybean production in the North Central Region in the last decade (11). This is because BPMV-infected plants are often
asymp-tomatic, and visual assessment methods used to quantity BPMV prevalence and incidence are not reliable (4,12). However, the development of enzyme-linked immunosorbent assay (ELISA) and polymerase chain reaction (PCR) pathogen detection tools has made it possible to test for the presence of BPMV in disease surveys (3,4,19). BPMV has been reported to occur at near-epidemic levels throughout most of the North Central Region of the United States, as well as in Canada, and is now generally recognized as an emerging threat to the soybean industry in the North Central Region (11,14,15,28,29,38,40,49,52).
The increase in BPMV prevalence and incidence (risk) has been attributed to increased winter survival of the bean leaf beetle
Cerotoma trifurcata (Forster), which is the primary vector for this virus (19–21,28,43). The overwintering population of adult bean leaf beetles, which can acquire and transmit BPMV, feeds and lays eggs in soybean fields before dying in late May to mid-June (22,23,41,42). The time required for eggs to develop into larvae, pupate, and emerge as adults is 30 to 45 days, depending on soil temperature (18). The first summer generation of adult bean leaf beetles emerges between late June and mid- to late July (4,22,41). The second summer generation is present after early August, and these adults become the overwintering generation (22,41,42).
Despite published reports that document the importance of BPMV in the North Central Region, large knowledge gaps still exist concerning the seasonal and temporal dynamics of BPMV, as well as the geographical (geospatial) distribution of BPMV at the field, county, and agricultural district spatial scales (19). Nor is it known whether the risk for BPMV prevalence and incidence varies from growing season to growing season, field to field, or
Corresponding author: F. W. Nutter, Jr.; E-mail address: [email protected]
from county to county (i.e., whether BPMV risk is greater in some Iowa soybean fields and counties than others). Such infor-mation has important implications with regard to the deployment of regional, county, and field-scale management of BPMV and its insect vectors (16,28,31,32,35).
The use of global positioning systems (GPS) and geographic information systems (GIS) technologies to map the prevalence and incidence of BPMV may reveal the impact of abiotic and biotic factors that influence BPMV disease risk (8,27,28,32). By coupling GPS and GIS technologies with BPMV disease detec-tion tools and survey data, prevalence and incidence maps can be generated that depict well-defined geographical areas with high or low BPMV risk (8,27,31,32). Moreover, the integration of GPS and GIS technologies with disease survey data allows researchers to quantify (and better understand) the spatial and temporal dynamics of plant disease epidemics, and to examine how spatial disease dynamics are influenced by biotic and abiotic BPMV risk factors. Such risk factors may include seasonal and geographic distributions of insect vectors, co-occurrence of BPMV with other soybean pathogens, climate influences on winter survival of bean leaf beetle populations, and crop management practices (8,11, 19,26,27,31,38). The availability of risk maps prior to spring planting could facilitate the geographic deployment of disease management tactics that support the principles of precision agriculture (8,34).
The area-wide and seasonal management of BPMV risk requires a better understanding of the spatial variation in BPMV disease risk factors; therefore, it is important to first test the hypothesis that all Iowa soybean fields, counties, and agricultural climate districts (47) are at equal risk for BPMV each growing season. Delineation of the intensity and geographic extent of BPMV, or any threatening plant pathogen, may facilitate the development of more effective disease management programs and identification of defined disease management units or “zones” that have similar levels of actual or predicted disease risk (16,31, 35). Therefore, the objectives of this study were to (i) quantify the prevalence and incidence of BPMV at the field, county, and agri-cultural district scales in Iowa over time; (ii) test for the presence of spatial dependence (clustering) of BPMV at the field and county scales in Iowa; (iii) identify potential abiotic and biotic risk factors that influence BPMV disease risk; and (iv) determine the probabilities that either SMV or soybean pod and stem blight will occur in soybean fields that are also infected with BPMV.
MATERIALS AND METHODS
Disease survey. A statewide soybean disease survey (The Iowa Soybean Disease Survey) was conducted in Iowa during the 2005 to 2007 growing seasons. In all, 8 to 16 soybean fields per county were selected arbitrarily and sampled each growing season. Samples were collected at four approximate soybean growth stages: V2-V3 (two to three trifoliate leaves), R1-R2 (beginning to full bloom), R4-R5 (full pod to beginning seed), and R6-R7 (full seed to beginning maturity) (9). In order to include as many field locations as possible in the Iowa Soybean Disease Survey, most fields were sampled only once each year, and new field locations within each county were visited at each growth stage. In total, 96 of Iowa’s 99 counties were surveyed in 2005 and all 99 counties were surveyed in 2006 and 2007. Ancillary data col-lected from surveyed soybean fields included GPS coordinates, soybean cultivar, plant growth stage, previous year’s crop, and soybean row spacing.
A systematic sampling design was used to collect 30 soybean plants from each soybean field. Soybean plants were collected by two separate agencies. The majority of the samples were collected during June to September by Iowa State University field agrono-mists, who used a modified cross-sampling pattern to select plants from 10 sampling points. In late July to mid-August, National
Agricultural Statistical Service personnel sampled additional fields using a modified ‘W’ sampling pattern with 10 sampling arms (26,27,36). The length of individual sampling arms within each field was proportional to the size of the field, with arm lengths of 20 to 60 m. Selected plants were uprooted, bagged, labeled, and shipped overnight to Iowa State University. Plant samples were stored at 4°C until sap was extracted and tested for the presence of BPMV by ELISA.
Sap extraction. The middle leaflet from the topmost, fully ex-panded trifoliate from each plant was removed and the 30 leaflets (from 30 plants in each field) were stratified into five six-leaflet subsamples. Subsamples were then stored in prelabeled, plastic zip-lock bags at 4°C until leaflet sap was extracted. Sap from each six-leaflet subsample was extracted using a leaf press (Ravenel Crop Specialties, Seneca, SC) by placing leaflets be-tween the metal rollers and adding 4 to 5 ml of general extraction buffer (Agdia, Inc., Elkhart, IN). Leaf sap was collected into a 5-ml wax paper portion cup (Instaoffice, Kennesaw, GA) and then immediately dispensed into three 1.5-ml microcentrifuge tubes. Tubes were stored at –20°C until ELISA tests were performed. Between samples, mechanical rollers were thoroughly flushed with pressurized tap water and then further rinsed with ≈3 ml of extraction buffer.
Detection of BPMV. The presence or absence of BPMV in
each subsample was determined using a commercial double-antibody sandwich (DAS)-ELISA kit for BPMV, following the manufacturer’s recommended protocol (Agdia, Inc.). Details of the procedure have been reported previously (4). Duplicate samples of BPMV-positive and -negative samples were included in all ELISA plates as controls. Color development substrate (p-nitro-phenol phosphate) was added as an indicator after the final wash-ing. Absorbance was read at 405 nm using an ELx800 plate reader (Biotek Inc., Winooski, VT). A subsample was considered to be BPMV positive if both subsample wells had absorbance values that were greater than twice the mean absorbance of the negative controls (4). Plates that did not show positive results in all positive control wells were retested.
BPMV prevalence and incidence data. Prevalence (%) at the field scale was defined as the number of soybean fields with at least one BPMV-positive subsample/total number of soybean fields tested × 100 (33). Prevalence of BPMV at the county scale was calculated as the number of counties that had at least one BPMV-positive subsample/total number of counties tested × 100. BPMV prevalence at the agricultural district scale was defined as the number of Iowa climate districts with BPMV-positive fields/ total number of agricultural climate districts (n = 9) × 100. Agri-cultural climate districts within Iowa are based on Iowa counties that have similar crop growth conditions (47). Therefore, field prevalence within agricultural climate districts was also deter-mined. Similarly, BPMV incidence, expressed as a percentage, was calculated at three geographic scales by dividing the number of BPMV-positive subsamples within a field, county, or agri-cultural district by the total number of tested samples from each geographical sampling unit (27,33).
Seasonal changes in BPMV prevalence and incidence. With-in each year, disease prevalence on a given day of year (DOY) was defined as the number of BPMV-positive soybean fields sampled to date/total number of fields sampled (to date) × 100. Disease incidence on a given DOY was defined as the number of BPMV-positive subsamples collected to date/total number of subsamples collected (to date) × 100. This approach was chosen to facilitate the analysis of seasonal differences in statewide dis-ease progress from one growing season to the next.
BPMV disease intensity increased very slowly until statewide field prevalence exceeded 3% and statewide incidence exceeded 1%. Statewide prevalence and incidence increased rapidly after these thresholds were exceeded. Consequently, we modeled epi-demic progress from the time when these thresholds were reached until the time when sampling was discontinued due to crop senes-cence. Ordinary least-squares regression was used to fit temporal disease progress data to the linear, monomolecular, exponential, logistic, and Gompertz population growth models. Back-trans-formed, predicted values were regressed against original disease intensity values to obtain coefficient of determination (R2) values. The most appropriate model was selected based on the following criteria: the shapes of disease progress and rate curves, the F sta-tistic for each model, R2 values from regressions of back-transformed predicted values, standard errors of the estimate for prevalence or incidence (y), and the subjective evaluation of plots of standardized residuals versus predicted values (27,33,37,45).
Spatial data analyses. BPMV prevalence and incidence data at the field, county, and agricultural district scales were mapped using ArcGIS 10.0 software (ESRI, Redlands, CA). Prevalence and incidence at the field scale were mapped as point data for spatial analyses at the field scale (27); however, to preserve the confidentiality of soybean growers whose fields were used in this study, GPS maps of soybean field data points are not shown. In lieu of mapping GPS point data at the field scale, kriged maps depicting end-of-season BPMV incidence levels were generated using ArcGIS software (6,10). The incidence of BPMV in non-sampled soybean fields was estimated using the ordinary kriging method (6,7,24,31).
To test for spatial dependence of BPMV prevalence and inci-dence levels at the county scale, Moran’s Index (Moran’s I) was used (17,27). The index ranges from –1 to 1, with values close to 1 indicating strong spatial dependence (departure from random-ness). To detect the presence of spatial dependence (clustering) for BPMV incidence at the field scale, semivariogram analyses were performed using the PROC VARIOGRAM procedure in SAS (SAS Institute, Cary, NC). BPMV incidence data were sub-jected to trend and anisotropy analysis before the most appro-priate spatial model was selected (6,7). Based on the minimum mean squared errors and lack of patterns in residual plots, the spherical model best fit the empirical variograms for BPMV incidence data. The spherical model is a theoretical model in which semivariance values steadily increase with distance and then level off at the maximum semivariance (otherwise known as the sill). The range is the distance beyond which there is no fur-ther increase in semivariance (no spatial dependence). The nugget is the semivariance at a distance less than the first lag (interval). Model parameters (sill, range, and nugget) (6,17) were then used to interpolate and map BPMV incidence using the ordinary kriging method in ArcGIS (6,7,24,31,32,35).
Prevalence–incidence relationships. Ordinary least-squares regression was used to determine whether there was a relationship between BPMV prevalence (x) and BPMV incidence (y) at the agricultural climate district and county scales for each year of the survey.
Risk factors associated with BPMV. To determine whether BPMV incidence (risk) was influenced by geographical position
within Iowa, latitude and longitude coordinates for the geographic centers of individual counties (x) were plotted versus mean BPMV incidence within counties (y) to examine north-south and east-west gradients. Mean end-of-season county incidence percentages (y) were then regressed against latitude and longitude centroid coordinates (x, expressed in meters) to test for significant linear relationships (35).
Spearman’s rank correlation analysis was used (44) to test whether BPMV prevalence and incidence at the county scale in 2006 or 2007 was associated with county prevalence and inci-dence levels observed in the previous year. Comparisons with significant rank correlation coefficients (P≤ 0.01) were examined further by regressing mean BPMV prevalence and incidence data within a county (x) against the following year’s mean county prevalence and incidence data (y).
To determine whether row spacing (width) influenced BPMV disease risk, BPMV incidence data were analyzed using χ2 analy-sis. In addition, statewide BPMV incidence data were stratified into three groups by row width (≤19, 38, and 76 cm), and BPMV incidence for each row width was graphed versus time (DOY) (36). Temporal progress curves were fit to data for each row width, using the methods described previously. The monomolecular and linear models provided the best fit to these data (based on re-gression model selection criteria stated previously). Rate curves indicated that the linear model was more appropriate, and the linear model also has fewer assumptions (33,45). Consequently, the linear model was used to investigate the effects of row width on increase in BPMV incidence over time. Orthogonal contrasts (P≤ 0.05) were used to test for significant differences in temporal disease increase rates.
The likelihood that soybean fields with BPMV-positive samples would also contain SMV-infected samples was tested using χ2
analysis and Fisher’s exact test, under the null hypothesis that BPMV prevalence and SMV prevalence were independent (i.e., the presence of BPMV does not influence the likelihood that SMV will be detected within the same soybean fields) (25,26). Independence of occurrence of BPMV and pod and stem blight (Phomopsis phaseolorum var. sojae), caused by infection within soybean fields, was examined using the same statistical tests and the same null hypothesis of independence (i.e., no association) as described above. Strength of association of BPMV with SMV and Phomopsis pod and stem blight was also examined using Pearson’s correlation analysis (25). Procedures used in the Iowa Soybean Disease Survey to assess the prevalence of SMV and pod and stem blight have been reported previously (27).
RESULTS
BPMV was first detected in different locations within Iowa in 2005, 2006, and 2007 but the three growing seasons had similar dates of first detection (Table 1). BPMV was first detected in 2005 on DOY 167 (16 June) in Washington County, and on DOY 165 (14 June) in 2006 in Union County. These two counties are located in southern Iowa. In 2007, BPMV was first detected on DOY 171 (20 June) in Marshall County, which is in central Iowa. Statewide prevalence reached 3% on DOY 208 (27 July) in 2005, DOY 193 (12 July) in 2006, and DOY 190 (9 July) in 2007
TABLE 1. Dates (DOY) when Bean pod mottle virus (BPMV) was first detected, maximum BPMV prevalence and incidence was observed, BPMV prevalence exceeded 3%, and BPMV incidence exceeded 1% during the 2005 to 2007 soybean growing seasonsa
Year
a DOY = day of year. Statewide prevalence was calculated using data from all soybean fields sampled to date and statewide incidence was calculated using data
(Table 1). Similarly, BPMV incidence exceeded 1% on DOY 209 (28 July) in 2005, DOY 193 (12 July) in 2006, and DOY 190 (9 July) in 2007.
Prevalence of BPMV at the agricultural climate district, county, and field scales. BPMV was detected in all nine agri-cultural districts in each year of the study (i.e., prevalence was 100% at this scale in all three growing seasons) (Table 2). Field prevalence (%) within agricultural climate districts was highest in the southernmost tier of agricultural climate districts and lowest in the northernmost tier of agricultural climate districts (Fig. 1).
Prevalence of BPMV at the county scale varied greatly among years and counties. At the county scale, BPMV prevalence was highest in 2006, when 91 of Iowa’s 99 counties (91.9%) tested positive for BPMV (Table 2; Fig. 2). In 2005 and 2007, 40 of 96 counties (42.7%) and 74 of Iowa’s 99 counties (74.7%) had one or more soybean fields test positive for BPMV.
BPMV prevalence at the field scale was highest in 2006 (38.7%) (Table 2). In 2005 and 2007, BPMV prevalence at the field scale was 9.1 and 25.5%, respectively. Within the three growing seasons, the highest field-scale prevalence levels were observed on DOY 256 (13 September) in 2005, DOY 261 (18 Sep-tember) in 2006, and DOY 267 (24 SepSep-tember) in 2007 (Table 1).
Incidence of BPMV at the agricultural climate district, county, and field scales. Mean BPMV incidence within Iowa’s nine agricultural districts averaged 4.1% in 2005, 26.9% in 2006, and 9.9% in 2007 (Table 3). Within the nine agricultural climate districts, mean BPMV incidence was 0.2 to 12.4% in 2005, 4.6 to
56.8% in 2006, and 1.8 to 21.5% in 2007 (Fig. 1). In all 3 years, the southernmost agricultural climate districts had significantly higher BPMV incidence compared with the central and northern agricultural climate districts (contrast F values = 19.7, 64.0, 8.16, and P ≤ 0.0001, 0.0001, and 0.005 for 2005, 2006, and 2007, respectively).
Mean BPMV incidence at the county scale was highest in 2006 (27.5%), whereas mean county-scale incidence was 3.7 and 10.8% in 2005 and 2007, respectively (Table 3). In 2005, 73 of 96 counties had BPMV incidence levels ≤5%, and high BPMV incidence (>30%) was detected in only one county (Fig. 3A). In 2006, BPMV incidence levels >60% occurred in 10 Iowa coun-ties, and 40 of Iowa’s 99 counties (40.4%) had BPMV incidence levels >30% (Fig. 3B). Although there were many Iowa counties with high BPMV prevalence in 2007, incidence was relatively low, with mean BPMV incidence levels ≤5% in 45 counties (45.5%) (Fig. 3C), and BPMV incidence levels >30% in just 9 Iowa counties in 2007.
Mean BPMV incidence at the field scale (averaged over all fields sampled and tested) was highest in 2006, when 24.4% of all subsamples tested positive for BPMV (Table 3; Fig. 2B). BPMV incidence averaged over all sampled soybean fields was 4.1% in 2005 and 10.9% in 2007. Mean end-of-season incidence levels in BPMV-infected fields were much higher (45.4, 63.0, and 42.9% in 2005, 2006, and 2007, respectively) (Table 3). In 2005 and 2007, very few soybean fields had ≥60% BPMV-positive sub-samples whereas, in 2006, 160 of the 321 BPMV-positive
soy-Fig. 1. Mean prevalence (%) and incidence (%) of Bean pod mottle virus within Iowa’s nine agricultural climate districts in 2005, 2006, and 2007.
TABLE 2. Mean prevalence of Bean pod mottle virus (BPMV) in Iowa at the end of the 2005, 2006, and 2007 soybean growing seasons, calculated at three spatial scales (agricultural climate district, county, and field)a
Agricultural climate district scaleb County scalec Field scaled
Year n % n % ± SE n % ± SE
2005 9 100 96 42.7 ± 5.0 740 9.1 ± 1.0
2006 9 100 99 91.9 ± 2.7 830 38.7 ± 1.7
2007 9 100 99 74.7 ± 4.4 764 25.5 ± 1.6
a Calculations used agricultural climate districts, counties, and fields as sampling units (n). SE = standard error.
b Mean end-of-season prevalence in Iowa agricultural climate districts (n = 9), expressed as the percentage of districts with at least one BPMV-positive soybean
field.
bean fields (49.8%) had BPMV incidence levels equal to 100% incidence (i.e., all five bulked soybean leaf subsamples from a field had tested positive for BPMV) (Fig. 3B). The highest field-scale incidence levels were observed on DOY 257 (14
Septem-ber), 261 (18 SeptemSeptem-ber), and 267 (24 September) in 2005, 2006, and 2007, respectively (Table 1).
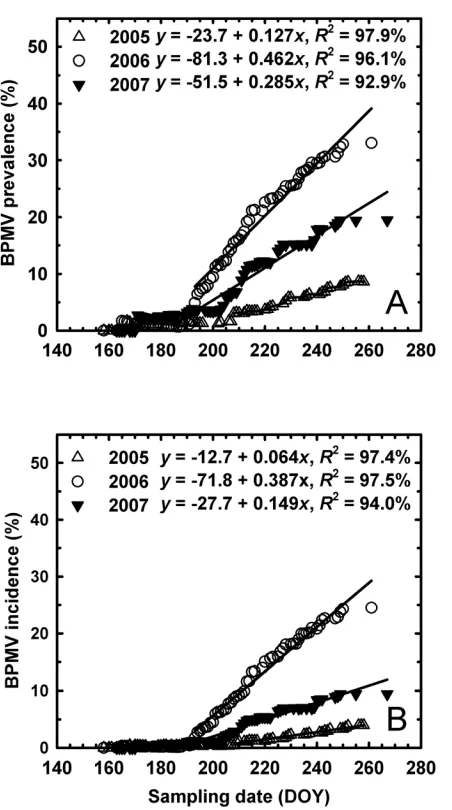
Seasonal changes in BPMV prevalence and incidence. Dur-ing each growDur-ing season, disease progress curves for BPMV
Fig. 2. Cumulative prevalence of Bean pod mottle virus (BPMV) in Iowa counties during the months of June, July, August, and September for the 2005, 2006, and
prevalence and incidence displayed two distinct temporal phases. In all 3 years, disease progress curves exhibited an initial phase in which BPMV prevalence was <3% and incidence remained <1%. During this early phase, both prevalence and incidence showed little change over time. A second phase with faster disease infec-tion rates occurred after epidemic onset, which began in mid- to late July. During this second phase, BPMV incidence increased between mid- to late July and early September.
The change in field prevalence (%) and sampling date (DOY) after epidemic onset (when BPMV prevalence was >3%) was best described by the linear model in 2005, 2006, and 2007 (Fig. 4A). Regression coefficients (slopes) were 0.127 to 0.462% per day (R2 = 97.9, 96.1, and 92.9% for 2005, 2006, and 2007, respec-tively), indicating that BPMV prevalence increased 1.27 to 4.62% every 10 days (Fig. 4A). The linear model also best described the relationship between the change in BPMV incidence (after BPMV incidence reached 1%) and DOY for all three growing seasons (Fig. 4B). Slope values were 0.064, 0.387, and 0.149% per day, indicating that, for every 10-day period, BPMV incidence was increasing by 0.64, 3.87, and 1.49% during 2005, 2006, and 2007, respectively. R2 values indicated that DOY explained 94.0 to 97.5% of the variation in BPMV incidence over time.
Spatial dependence analyses for BPMV prevalence and inci-dence. Moran’s I analyses indicated that mean field-scale preva-lence within counties exhibited significant spatial dependence in 2005 and 2007 but not in 2006 (Table 4), when BPMV prevalence (at the field scale) was very high and BPMV was detected in all but eight counties (Fig. 2). Significant spatial dependence (clus-tering) of mean BPMV incidence was detected at the county scale in all three growing seasons (Table 4) but spatial dependence at the county scale was strongest in 2006 (Moran’s I = 0.68). Coun-ties with high BPMV incidence tended to be neighbored by other counties with high BPMV incidence, while counties with low BPMV incidence tended to be neighbored by counties with low BPMV incidence.
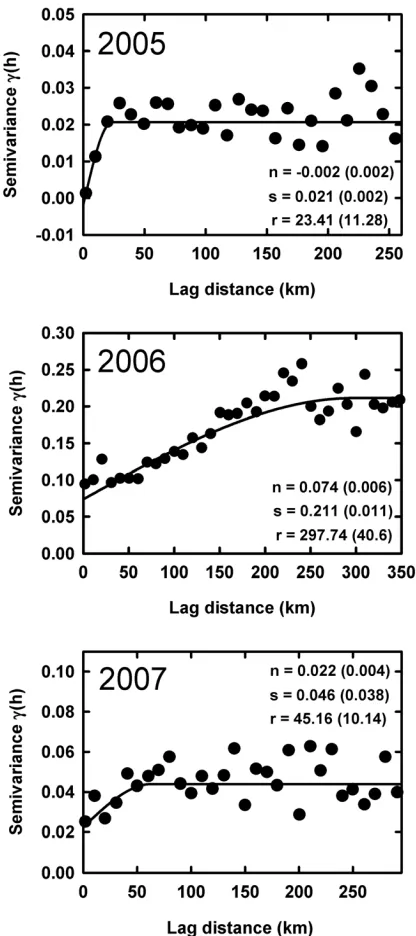
The spherical model provided the best fit to the empirical semi-variograms in 2005 (R2 = 84.7%, P < 0.0001), 2006 (R2 = 85.5%,
P < 0.0001), and 2007 (R2 = 81.1%, P < 0.0001) (Fig. 5). BPMV incidence at the field scale was spatially dependent at distances
≤298 km in 2006, the year with the greatest maximum distance. Spatial dependence for BPMV incidence was significant at dis-tances ≤45 km in 2007 and ≤23 km in 2005 (Fig. 5). Kriged maps depicting estimated BPMV incidence (at the field scale) for the 2005, 2006, and 2007 growing seasons varied greatly (Fig. 6). These maps clearly delineate areas within Iowa where BPMV had the highest incidence, and show that the distribution of BPMV-positive fields was considerably not random within the state (Fig. 6). In 2005, BPMV incidence was higher in the west-central,
southwest, and southeast areas of Iowa than in the rest of the state. In 2006 and 2007, BPMV incidence was generally highest in the southernmost areas of the state and lowest in the northern-most tiers of Iowa counties.
Prevalence-incidence relationships. In all three growing sea-sons, BPMV prevalence (%) within counties was linearly related to mean BPMV incidence within counties (Fig. 7A to C). County-level incidence (%) increased by 0.52, 0.92, and 0.78% for each one unit increase in percent prevalence in 2005, 2006, and 2007, respectively. Thus, counties with higher field prevalence levels also had higher BPMV incidence levels. Standard errors of the
TABLE 3. Mean incidence (%) of Bean pod mottle virus (BPMV) in Iowa soybean at the agricultural climate district, county, and field spatial scales at the end of the 2005, 2006, and 2007 growing seasonsa
Agricultural climate district scalec County scaled Field scalee
Field, yearb n % ± SE n % ± SE n % ± SE
All
2005 9 4.1 ± 4.0 96 3.7 ± 6.5 740 4.1 ± 15.9
2006 9 26.9 ± 19.6 99 27.5 ± 25.0 830 24.4 ± 36.9
2007 9 9.9 ± 6.1 99 10.8 ± 14.2 764 10.9 ± 23.4
Positive
2005 9 36.5 ± 15.8 41 42.0 ± 24.8 67 45.4 ± 30.1
2006 9 54.3 ± 22.2 91 54.6 ± 27.4 321 63.0 ± 33.0
2007 9 34.2 ± 6.4 74 37.8 ± 21.9 195 42.9 ± 27.9
a Incidence based on field samples collected from June through September. Calculations used agricultural climate districts, counties, and soybean fields as
sampling units (n). Mean BPMV incidence and standard errors (SEs) were computed using PROC MEANS (SAS Institute Inc., Cary, NC).
b All = all soybean fields sampled. Positive = positive fields only, calculated using subsamples from surveyed soybean fields that had at least one
BPMV-positive subsample.
c End-of-season incidence in agricultural climate districts, based on mean BPMV incidence at the field scale in each district. d Statewide, end-of-season incidence is the mean BPMV incidence in sampled counties.
e Statewide, end-of-season incidence is the mean incidence in sampled fields (5 bulk subsamples per field).
Fig. 3. Incidence of Bean pod mottle virus (BPMV) in commercial soybean
estimate (SEEy) for these linear regression models were 4.88 to 7.84%, and R2 values were 59.3% (2005) to 90.1% (2006). Sig-nificant relationships between BPMV prevalence and incidence were also detected at the agricultural climate district scale in all three growing seasons (Fig. 7D to F). For each 1% increase in BPMV prevalence within agricultural climate districts, BPMV incidence increased by 0.55, 0.93, and 0.43% in 2005, 2006, and 2007, respectively. The linear model explained 79.4 to 95.4% of the variation in BPMV incidence at the agricultural climate district scale, and SEEy values were 0.91 to 5.58%.
Risk factors associated with BPMV incidence. For all three growing seasons, there was a significant linear relationship be-tween BPMV incidence at the county scale and county centroid latitude (Fig. 8A). The strongest relationship was observed in 2006, when BPMV incidence decreased by 0.20% for each 1 km increase in county latitude (R2 = 59.4%, F = 137.5, P < 0.0001). County centroid latitude explained 8.3% of the change in BPMV incidence in 2005 (F = 8.51, P = 0.004), and 17.8% of the change in 2007 (F = 20.3, P < 0.0001). Slope parameters for these two regression equations indicated that BPMV incidence decreased south to north by 0.20% (2005) and 0.64% (2007) for every
10-km increase in county latitude. The linear relationship between mean BPMV incidence within counties and the longitude coordi-nates for the corresponding county centroids was significant (P≤
0.05) in 2005. However, county longitude explained only 4.7% of the variation in BPMV incidence in 2005 (R2 = 4.7%, F = 4.62,
P = 0.0342). East–west (longitude) BPMV gradients were not detected in 2006 or 2007 (Fig. 8B).
There was no association between 2005 and 2006 end-of-sea-son BPMV prevalence and incidence levels within counties (data not shown). Significant rank correlation coefficients (P≤ 0.0001), however, were obtained when field prevalence within counties in 2006 was compared with prevalence in 2007 (r = 0.4311), and when incidence within counties in 2006 was compared with incidence in 2007 (r = 0.4732). Field prevalence within counties in 2006 explained 16% of the variation in BPMV prevalence within counties in 2007 (P≤ 0.0001) (Fig. 9A). Similarly, the R2 value from linear regression analysis indicated that county-scale mean incidence in 2006 explained 10.7% of the variation in county-scale mean incidence in 2007 (P≤ 0.0001) (Fig. 9B).
A χ2 analysis revealed a significant association between row spacing and BPMV incidence at the field scale in both 2006 and 2007 (χ2 = 30.71, P < 0.0001 and χ2 = 13.14, P < 0.0001 for 2006 and 2007, respectively) (Table 5). Row spacing data were not collected during the 2005 soybean survey. Lower levels of BPMV incidence were associated with 76-cm row widths, especially in 2006, when BPMV disease intensity was high (Fig. 10). In 2006, epidemic onset occurred 4 to 8 days later in fields planted to 76-cm rows than in fields planted to narrow (19- or 38-cm) rows (Table 6). In 2007, BPMV epidemic onset occurred 31 and 18 days earlier in fields with 19- and 38-cm row widths than in fields with 76-cm row widths (Table 6).
After BPMV incidence exceeded 1%, disease progress curves for the three row widths were best described by the linear model (Table 6) (32). In 2006, orthogonal contrasts indicated that rates of increase observed in soybean fields with 19- and 38-cm row spacings were not significantly different from each other (b1 = 0.535 and 0.613% day–1 for 19- and 38-cm spacings, respectively) but they were significantly higher than the rate of increase in fields with 76-cm row spacing (b1 = 0.316% day–1) (Table 6). In the following year, rates of increase in BPMV incidence over time were much slower than in 2006 but fields with 38-cm rows had the highest rate of disease increase over time (b1 = 0.184% day–1), which was significantly faster than the rates in soybean fields with 19- or 76-cm row widths (Table 6).
In 2006, end-of-season mean incidence levels were lowest in soybean fields planted with 76-cm row spacings (yfinal = 17.2%) and highest in fields planted with 38-cm row spacings (yfinal = 36.2%) (Table 6). In 2007, the highest end-of-season incidence occurred in fields planted with 38-cm rows (yfinal = 12.0%) (Table 6; Fig. 10).
Probability of co-infection with SMV and Phomopsis pod and stem blight. The percentage of fields co-infected with BPMV and SMV was 1.1, 1.9, and 11.9% in 2005, 2006, and
Fig. 4. Seasonal changes in Bean pod mottle virus (BPMV) A, prevalence and
B, incidence, calculated using all samples collected to date, in commercial soybean fields sampled and tested during the 2005, 2006, and 2007 soybean growing seasons in Iowa. Linear relationships between day of year (DOY) of sampling and BPMV prevalence and incidence at the field scale were modeled for the period that began at time of epidemic onset, when prevalence exceeded 3% and incidence exceeded 1%.
TABLE 4. Spatial dependence of county-scale Bean pod mottle virus prevalence and incidence in Iowa soybean in 2005, 2006, and 2007, analyzed using Moran’s Index (Moran’s I)a
Year Moran’s I Z score P valuea Spatial pattern
Prevalence
2005 0.25 3.18 0.01 Clustered
2006 –0.07 –0.83 NS Random
2007 0.20 2.67 0.01 Clustered
Incidence
2005 0.27 3.59 0.01 Clustered
2006 0.68 8.59 0.01 Clustered
2007 0.20 2.94 0.01 Clustered
2007, respectively. Based upon χ2 analysis, SMV prevalence was not associated with BPMV prevalence in 2006 and 2007 (P > 0.05) (Table 7). In 2005, however, the number of soybean fields infected with both SMV and BPMV exceeded the number expected under the null hypothesis that the presence or absence of BPMV has no influence on the prevalence of SMV (two-sided probability P = 0.0222 using Fisher’s exact test). Pearson’s corre-lation analysis also identified a very weak association between BPMV and SMV in 2005 (r = 0.0908, P = 0.0137) and no association in 2006 and 2007 (P > 0.05).
The overall prevalence of pod and stem blight-infected fields was 8% in 2005 and 22% in both 2006 and 2007. However, the percentage of BPMV-infected soybean fields that were also infected with pod and stem blight was 32, 41, and 50% in 2005,
2006, and 2007, respectively. In all 3 years, χ2 analysis indicated that the number of fields infected with both BPMV and pod and stem blight was significantly higher than the number expected if the percentages of pod and stem blight-infected fields were the same in both BPMV-positive and BPMV-negative fields (i.e., independent) (Table 7). Pearson’s correlation analysis identified weakly positive, significant (P < 0.0001) associations between BPMV and pod and stem blight in all three growing seasons (r = 0.2675, 0.3387, and 0.3365 in 2005, 2006, and 2007, respec-tively). Soybean fields infected with both BPMV and pod and stem blight represented 2.5, 14.0, and 10.0% of all fields sampled in 2005, 2006, and 2007, respectively. Thus, the presence of BPMV within soybean fields was weakly associated with an in-crease in the prevalence of pod and stem blight at the field scale.
DISCUSSION
The coupling of GPS and GIS technologies with detailed dis-ease survey data provided a platform to map and quantify the temporal and spatial patterns of BPMV disease prevalence and incidence at the field, county, and agricultural climate district spatial scales, thereby providing new information on the spatial and seasonal dynamics of BPMV prevalence and incidence at three potential management scales (zones). Our findings have im-portant implications as to where and when soybean fields should be sampled and tested for the presence of BPMV during the growing season, where to conduct BPMV disease risk surveys, and when to sample and evaluate BPMV disease-management tactics, such as the use of BPMV-resistant breeding lines and cul-tivars, seed and foliar-applied insecticides to target bean leaf beetle populations, and delayed planting dates.
This study was part of the Iowa Soybean Disease Survey, which is one of the largest in-depth disease surveys undertaken of any single crop (26,27). One of the most important outputs from this survey was data documenting the relative ranking of all soybean diseases in Iowa for the 2005 to 2007 growing seasons. In terms of prevalence, out of 21 soybean diseases, BPMV ranked 5 in 2005 (9.1% prevalence), 2 in 2006 (38.7% prevalence, after bac-terial blight), and 3 in 2007 (25.5% prevalence, after brown spot and SMV) (A. E. Robertson, unpublished data). With regard to disease incidence, BPMV ranked 3 in 2005 (4.1%), 1 in 2006 (24.4%), and 5 in 2007 (10.9%).
Seasonal data from our survey demonstrated that BPMV preva-lence in the month of June was low, which suggests that there is limited initial inoculum early in the growing season. Disease increase in this early phase was likely due to new infections trans-mitted by the overwintering generation of adult bean leaf beetles (3,4,18,19,22,42). A second phase with faster disease infection rates began in mid- to late July. High end-of-season BPMV incidence levels are primarily due to high rates of plant-to-plant spread of BPMV (by bean leaf beetles), as opposed to high initial
Fig. 5. Semivariograms showing the spatial dependence of Bean pod mottle
virus at the field scale in commercial soybean fields in Iowa for 2005, 2006, and 2007. Solid circles are data points from the empirical semivariograms, and solid lines are theoretical semivariograms obtained from fitting the spherical model to the empirical data. The nugget (n) is the semivariance when lag distance = 0. The sill (s) is the maximum semivariance. The range (r) is the distance beyond which there is no further increase in semivariance (no spatial dependence).
TABLE 5. A χ2 analysis of the frequency of Bean pod mottle virus-infected
soybean fields in Iowa during the 2006 and 2007 growing seasons, stratified by row spacing
Year, spacinga Frequency nb χ2 (df = 2) P
2006
19 (7.5) 0.427 96 30.71 <0.0001
38 (15) 0.467 255 … …
76 (30) 0.272 485 … …
Total 0.349 836 … …
2007
19 (7.5) 0.205 73 13.14 0.0014
38 (15) 0.242 356 … …
76 (30) 0.142 445 … …
Total 0.188 874 … …
inoculum levels. In a related field study, Byamukama et al. (4) reported doubling times (i.e., the time needed for BPMV inci-dence within a soybean field to go from 1 to 2%, 2 to 4%, etc.) as short as 5.4 days in 2006 (a high-risk year). In 2007, when bean leaf beetle population densities were not as high, doubling times were 10.3 to 14.1 days. Results from our survey show that, in all 3 years, BPMV incidence increased linearly during the time interval from late July to early August, when adults from the first summer generation of bean leaf beetles are active (22,42). The importance of this seasonal pattern in statewide disease increase was also noted by Bradshaw et al. (3) and Byamukama et al. (4), who reported a significant linear relationship between late-July to early-August population densities of the bean leaf beetle and BPMV incidence. Based on our findings and those reported by Byamukama et al. (4), the period from late July to mid-August is optimal for evaluating management tactics that affect the rate of BPMV disease increase.
Results from our study indicate that Iowa counties and agri-cultural climate districts have different levels of BPMV risk, depending on their location within the state. Year-to-year variation in bean leaf beetle winter survival within and among Iowa coun-ties may explain (at least in part) the spatial clustering of BPMV incidence at the field and county scales in Iowa. For the first time, we detected the presence of north–south BPMV incidence gra-dients, and these gradients were present within Iowa in all 3 years of the survey. This disease gradient is likely related to the
pres-ence of winter temperature gradients that differentially impact the survival of bean leaf beetle populations within Iowa (21). Lam and Pedigo (21) developed a model that predicts bean leaf beetle mortality (%) based upon daily mean winter temperatures from 15 October through 15 April. Stedman et al. (43) used the Lam-Pedigo model to predict bean leaf beetle mortality at the county scale in 2005 and 2006, and then regressed predicted percent mortality (x) against BPMV incidence (y) at the county scale. The regression of vector mortality against BPMV incidence explained 11.1 and 38.1% of the variation in county-scale BPMV incidence in 2005 (a low risk year) and 2006 (a high risk year), respectively. However, in 2006, a higher R2 value (46.3%) was obtained when daily mean temperature data were directly regressed against BPMV incidence. Using this model, BPMV incidence within Iowa counties decreased 1.1% for each day that mean daily tem-peratures were <0°C (F. W. Nutter, Jr., unpublished data). The addition of other risk factors to the winter temperature model, (such as snow cover depth, snow cover duration, soil temperature, BPMV intensity level [risk] in the previous growing season, and landscape or topographical features) may increase model accu-racy in the future. As it is, the model has great potential to identify high-risk years before the soybean crop is planted, allow-ing extension recommendations to be made, prior to plantallow-ing, at the county or agricultural climate district scales (as opposed to making BPMV management recommendations at the state or regional spatial scales). Based on our study, statewide
recom-TABLE 6. Parameters and statistics for the regression of day of year (DOY) (x) versus mean Bean pod mottle virus (BPMV) incidence (%) (y) in Iowa soybean fields planted with 19-, 38-, or 76-cm row widths in 2006 and 2007a
2006 2007
Parametersb 19 cm 38 cm 76 cm 19 cm 38 cm 76 cm
DOY 195 191 199 177 190 208
n 24 40 38 26 41 25
b0 (± SE) –99.7 (7.6) –109.5 (3.0) –60.3 (3.5) –6.1 (1.2) –34.5 (1.6) –19.5 (1.9)
b1 (± SE) 0.535 (0.035) 0.613 (0.016) 0.316 (0.016) 0.048 (0.006) 0.184 (0.007) 0.105 (0.009)
Final y (%) 32.71 36.24 17.24 6.87 12.00 6.75
R2(%) 91.60 97.59 91.94 74.78 94.42 86.72
P > F <0.0001 <0.0001 <0.0001 <0.0001 <0.0001 <0.0001
Orthogonal contrasts
H0: equal slopes … F = 51.76 P > F = <0.0001 … F = 117.06 P > F = <0.0001
H0: ≤38 cm = 76 cm … F = 92.36 P > F = <0.0001 … F = 0.90 P > F = 0.3459
H0: 38 cm = othersc … NTd … … F = 150.49 P > F = <0.0001
a The linear model was fitted to BPMV incidence data from the time of epidemic onset (incidence > 1%) until plant senescence.
b DOY = date of epidemic onset, n = number of observation dates used in model, SE = standard error, and Final y = mean BPMV incidence (number of
BPMV-positive subsamples/total number of subsamples tested). Orthogonal contrasts used to test slope differences.
c The 38-cm spacing = others (19 and 76 cm). d Not tested in 2006.
TABLE 7. Analysis of the frequency of co-occurrence of Bean pod mottle virus (BPMV) with Soybean mosaic virus (SMV) and Phomopsis pod and stem blight in individual soybean fields in Iowa in 2005, 2006, and 2007
SMV Pod and stem blight
BPMV – + Total P – + Total P
2005
– 637 32 669 0.0222a 620 36 656 <0.0001a
+ 59 8 67 … 39 18 57 …
Total 696 40 736 … 659 54 713 … 2006
– 440 18 458 0.5844b 523 69 592 <0.0001c
+ 281 14 295 … 179 125 304 …
Total 721 32 753 … 702 194 896 …
2007
– 316 187 503 0.1949b 683 119 802 <0.0001d
+ 112 83 195 … 102 100 202 …
Total 428 270 698 … 785 219 1,004 …
a Two-sided probability using Fisher’s exact test. b χ2 statistic not significant (P > 0.05). c χ2 =102.8, df = 1.
mendations would ignore the spatial dependence present at the county and climate district scales.
Our results revealed that BPMV prevalence and incidence spatial patterns were spatially dependent (clustered) within Iowa. The clustering of BPMV spatial patterns has important impli-cations with regard to disease management. Current BPMV management recommendations are issued primarily at the state or regional scales. However, results from our study clearly show that some counties and agricultural climate districts are at higher risk for BPMV than others. Semivariogram analysis of field-scale data revealed that, in 2005, the survey year with the lowest levels of BPMV incidence and prevalence, field-scale incidence was clustered for distances of up to 23 km. At this distance, clusters of BPMV-infected fields would be spatially dependent across an area of approximately half the width and length of any Iowa county. In 2007, field-scale incidence was spatially dependent for distances ≤45 km. The area of a circle with this radius exceeds the area of all but two individual counties in Iowa. This information strongly suggests that, in low- or moderate-risk years, manage-ment recommendations could be issued at the county scale in order to minimize disease risk and management costs incurred by individual farmers. In 2006, which was a high-risk year, semi-variogram analysis of BPMV incidence at the field scale detected significant spatial dependence at distances as great as 298 km (i.e., areas much larger than the size of individual counties or agricultural climate districts). Even though BPMV risk may be associated with large geographic areas in high-risk years, county-scale risk maps, generated by overlaying maps of individual BPMV disease risk factors, can be used to issue pre-plant management recommendations, as has been done for the Stewart’s disease of corn pathosystem (8).
Spatial analyses of BPMV prevalence and incidence data at the county scale indicated that BPMV risk within Iowa is not the same among all counties or from one year to the next. However, we have shown that the presence of BPMV within one county
increased the probability that BPMV infected-fields will also be present in neighboring counties. Clustering of county-scale BPMV incidence (in all 3 years) and BPMV prevalence (in 2 of 3 years) further supports the need for management recommen-dations to be issued at the county scale (34).
Consistently high BPMV incidence in the southern part of the state may also indicate the presence of other area-specific abiotic and biotic risk factors associated with BPMV in this region. A number of reports have been published concerning association of high disease incidence with area-specific disease risk factors (8,48,50). A good example of this is a report by Nelson et al. (31), who reported that the risk of severe epidemics in tomato grown in the Del Fuerte Valley was caused by a virus complex that was spatially dependent (clustered). Using GIS tools, the authors identified “conducive landscapes” that were associated with high virus incidence. Our results show that the risk for BPMV within Iowa is also clustered, which may be due to several “conducive” biotic and abiotic risk factors. For example, time of planting is thought to be a risk factor for BPMV. This is because early planting allows overwintering adult populations of bean leaf beetles to feed on the emerging soybean crop for a longer period of time, resulting in higher levels of BPMV incidence early in the growing season as well as higher levels at the end of the growing season (4,11,35,38). Growers in counties in the southern part of the state often plant soybean earlier than soybean growers in northern areas of the state, in response to the earlier occurrence of warm spring temperatures. However, early planting may sub-stantially increase BPMV disease risk following mild winters with high bean leaf beetle winter survival rates, which are more likely to occur in southern Iowa (4,20,21). Growing seasons with high bean leaf beetle populations followed by warm winters have previously been linked to increased risk for high bean leaf beetle population densities the following growing season in the North Central Region (21,38). Esker et al. (8) and Nutter et al. (35) have previously reported the presence of similar non-random disease
Fig. 6. Kriged (interpolated) maps depicting estimated Bean pod mottle virus incidence in commercial soybean fields in Iowa during the 2005, 2006, and 2007
patterns following mild winters for the prevalence of Stewart’s disease due to differential winter temperature at the county and agricultural climate district scales in Iowa.
Although BPMV prevalence and incidence levels in 2005 had no statistical association with prevalence and incidence levels in 2006, BPMV prevalence and incidence levels in 2006 were sig-nificantly associated with 2007 prevalence and incidence levels. These significant relationships indicate that high BPMV disease intensity in 1 year, as a single risk factor, may account for as much as 11 to 16% of the level of disease intensity in the follow-ing growfollow-ing season. It is likely that counties that had high BPMV prevalence and incidence levels in 2006 had higher levels of initial inoculum in 2007, in the form of higher population densities of overwintering, BPMV-infested bean leaf beetles, a higher incidence of BPMV infected alternative hosts (such as
Desmodium spp.), and/or higher levels of BPMV seed infection from seed lots harvested in 2006 and planted in 2007 (13,14,19).
Evidence for carryover of initial inoculum from one year to the next has important implications in terms of BPMV management at the county scale. Forewarned of increased risk due to carryover effects, growers could proactively mitigate BPMV risk by (i) purchasing seed stocks of cultivars that are resistant or tolerant to BPMV (11,38), (ii) contracting (in advance) for insecticide seed treatment or within-season foliar insecticide applications (3,11, 20,38), and (iii) delaying time of planting (35,38).
To date, little is known about how differences in grower prac-tices, climate, and landscape features impact BPMV disease risk. Analysis of ancillary data from the survey identified that narrow row widths (≤38 cm) were associated with higher levels of BPMV incidence in 2006 and 2007 (row width data was not obtained in 2005). Field studies conducted during the same 3-year period (4) identified that plant-to-plant spread was limited primarily to within soybean rows until the soybean canopy closed, after which plant-to-plant BPMV spread also occurred across rows. Because
Fig. 7. Relationship between Bean pod mottle virus (BPMV) prevalence (%) and BPMV incidence (%) A to C, at the county scale and D to F, at the agricultural
row spacing affects time of canopy closure, it is possible that row spacing influences vector movement within the canopy which, consequently, influences the rate of spread of BPMV at the field scale (4).
Although fields with 76-cm row spacing were associated with lower BPMV disease risk in 2006 and 2007, differences in the geographical distribution of soybean fields planted to narrow versus wide row spacings may partially explain the higher risk associated with narrow row spacings. Visual inspection of GIS maps displaying the locations of soybean fields planted to narrow (≤38 cm) versus wide (76-cm) row spacings revealed that 68% of the soybean fields in the northern tier of agricultural climate districts were planted to wide (76-cm) row widths, whereas only 24% of the soybean fields in the southern tier of agricultural climate districts were planted using wide (76-cm) row widths
(data not shown). Additional investigations are needed to deter-mine whether row spacing influences bean leaf beetle behavior and, consequently, the rate of BPMV plant-to-plant spread within soybean fields. Moreover, the influences of other landscape and site-specific factors (e.g., landscape elevation or aspect, climate, and abundance of alternative hosts for both virus and vectors) need to be examined.
Our study documents the presence of a positive, linear relation-ship between BPMV prevalence (%) and mean BPMV incidence (%) at both the county and agricultural climate district scales. Thus, at both geographic scales, higher field prevalence was re-lated to higher mean BPMV incidence. Knowledge of this rela-tionship may be important with regard to the allocation of limited resources when conducting BPMV surveys (36). Based on our findings, the best use of survey resources can be obtained by increasing the number of soybean fields sampled per county or climate district, whereas less emphasis can be placed on sampling additional plants per field to quantify BPMV incidence. This is the second study to show a quantitative linear relationship
be-Fig. 8. Linear relationships between mean Bean pod mottle virus (BPMV)
incidence at the county scale and A, county centroid latitudes and B, and county centroid longitudes during the 2005, 2006, and 2007 soybean growing seasons in Iowa. Latitude and longitude coordinates were converted from meters (UTM zone 15 north, NAD83 projection) to kilometers. In 2005, longitude position explained only 4.7% of the variation in county incidence (R2 = 4.7%, y = 8.7 – 0.011x, P = 0.0342). Latitude explained only 8.3% of
the variation in county incidence in 2005 (y = 97 – 0.020x, P = 0.0044) and 17.8% of the variation in 2007 (y = 310 – 0.064x, P < 0.0001). In 2006, 59.4% of the variation in county incidence was explained by latitude (y = 940 – 0.196x, P < 0.0001).
Fig. 9. Linear relationships between county scale, end-of-season Bean pod
tween pathogen prevalence (x) and pathogen incidence (y) at the county scale (3). It is important to note that the presence of spatial dependence for BPMV incidence at the field and county scales indicates that a systematic sampling design (rather than a random sampling design) should be used to select soybean fields or coun-ties when conducting BPMV disease surveys (33,36). Byamukama et al. (4) previously suggested that soybean plants should be sampled systematically when estimating BPMV disease incidence within individual soybean fields, due to the clustered spatial pattern of BPMV-infected plants within affected soybean fields.
Results from our statewide survey support earlier results from controlled inoculation studies, which have shown that Phomopsis
spp. infections are more likely to occur in BPMV-infected soy-bean (1,46). Because both BPMV and Phomopsis infections con-tribute to economic losses, confirmation of this relationship, based on 3 years of data from commercial soybean fields in Iowa, further highlights the importance of managing BPMV risk in the nation’s top soybean production region.
In 2 of the 3 years of the survey, soybean fields with BPMV were not more likely to be co-infected with SMV. This suggests that BPMV infection does not necessarily predispose soybean to infection by SMV (or vice versa), and that rates of vector
acqui-sition and transmission for the two diseases are influenced by different factors. However, this study documented that 11.9% of the soybean fields sampled in 2007 were co-infected with BPMV and SMV, which is likely to accentuate yield losses at the field scale (2,5).
Our study has shown that geographic areas with high BPMV disease risk may benefit from management tactics that are de-ployed early in the growing season, (e.g., the use of insecticide seed treatments), whereas geographic areas with low BPMV risk may not require seed insecticides. Integrated pest management programs that target specific crop management zones at the field, county, and agricultural climate district scales have potential to reduce pesticide inputs, prevent or delay the development of pest resistance, and reduce the risk for adverse environmental impacts to nontarget species, such as insect pollinators (10). Our study provides new, science-based information that will also help researchers determine where and when to conduct field experi-ments to evaluate BPMV management tactics, such as the use of insecticide seed treatments (3,38), foliar insecticides (3,20,38), wider row spacings (76 cm), and BPMV-resistant or tolerant cultivars (12).
ACKNOWLEDGMENTS
The Iowa Soybean Association provided funding for this research. We thank M. Kaiser and P. Dixon, Iowa State University Department of Statistics, for providing valuable guidance regarding data analysis; the Iowa State University field agronomists and personnel from the National Agricultural Statistical Services for their cooperation in collecting and shipping soybean plant samples to our laboratory; and the Iowa soybean growers who participated in this study by providing critical ancillary data for this project.
LITERATURE CITED
1. Abney, T. S., and Plopper, L. D. 1994. Effects of Bean pod mottle virus on soybean seed maturation and seedborne Phomopsis spp. Plant Dis. 78: 33-37.
2. Anjos, J. R., Jarlfors, U., and Ghabrial, S. A. 1992. Soybean mosaic potyvirus enhances the titer of two Comoviruses in dually infected soybean plants. Phytopathology 82:1022-1027.
3. Bradshaw, D. J., Rice, M., and Hill, J. H. 2008. Evaluation of management strategies for bean leaf beetles (Coleoptera: Chrysomelidae) and Bean pod mottle virus (Comoviridae) in soybean. J. Econ. Entomol. 101:1211-1227.
4. Byamukama, E., Robertson, A. E., and Nutter, F. W., Jr. 2011. Quanti-fying the within-field temporal and spatial dynamics of Bean pod mottle virus in soybean. Plant Dis. 95:126-136.
5. Calvert, L. A., and Ghabrial, S. A. 1983. Enhancement by Soybean mosaic virus of Bean pod mottle virus titer in doubly-infected soybean. Phytopathology 73:992-997.
6. Cressie, N. A. C. 1991. Statistics for Spatial Data. John Wiley & Sons, Inc., New York.
7. DeMers, M. N. 2000. Fundamentals of Geographic Information Systems, 2nd ed. John Wiley & Sons, Inc., New York.
8. Esker, P. D., Harri, J., Dixon, P. M., and Nutter, F. W., Jr. 2006. Comparison of models for forecasting of Stewart’s disease of corn in Iowa. Plant Dis. 90:1353-1357.
9. Fehr, W. R., Lawrence, B. K., and Thompson, T. 1971. Stage of development descriptions for soybeans, Glycine max. Crop Sci. 11:929-931.
10. Fleischer, S. J., Blom, P. E., and Weisz, R. 1999. Sampling in precision IPM: When the objective is a map. Phytopathology 89:1112-1118. 11. Giesler, L. J., Ghabrial, S. A., Hunt, T. E., and Hill, J. H. 2002. Bean pod
mottle virus: A threat to U. S. soybean production. Plant Dis. 86:1280-1289.
12. Hill, J. H., Koval, N. C., Gaska, J. M., and Grau, C. R. 2007. Identi-fication of field tolerance to Bean pod mottle and Soybean mosaic viruses in soybean. Crop Sci. 47:212-216.
13. Hobbs, H. A., Hartman, G. L., Wang, Y., Hill, C. B., Bernard, R. L., Pedersen, W. L., and Domier, L. L. 2003. Occurrence of seed coat mottling in soybean plants inoculated with Bean pod mottle virus and Soybean mosaic virus. Plant Dis. 87:1333-1336.
14. Hopkins, J. D., and Mueller, A. J. 1983. Distribution of Bean pod mottle virus in Arkansas soybeans as related to the bean leaf beetle, Cerotoma
Fig. 10. Impact of soybean row spacing on incidence of Bean pod mottle virus
trifurcata, (Coleoptera: Chrysomelidae) population. Environ. Entomol. 12:1564-1567.
15. Hopkins, J. M., and Mueller, A. J. 1984. Effect of Bean pod mottle virus on soybean yield. J. Econ. Entomol. 77:943-947.
16. Johnson, K. D., O’Neal, M. E., Bradshaw, J. D., and Rice, M. E. 2008. Is preventative, concurrent management of the soybean aphid (Hemiptera: Aphididae) and bean leaf beetle (Coleoptera: Chrysomelidae) possible? J. Econ. Entomol. 101:801-809.
17. Kalkhan, M. A. 2011. Spatial Statistics. CRC Press, New York.
18. Kogan, M., Waldbauer, G. P., Boiteau, G., and Eastman, C. E. 1980. Sampling bean leaf beetles on soybean. Pages 201-236 in: Sampling Methods in Soybean Entomology. M. Kogan and D. C. Herzog, eds. Springer Verlag, New York.
19. Krell, R. K., Pedigo, L. P., Hill, J. H., and Rice, M. E. 2003. Potential primary inoculum sources of Bean pod mottle virus in Iowa. Plant Dis. 87:1416-1422.
20. Krell, R. K., Pedigo, L. P., Hill, J. H., and Rice, M. E. 2004. Bean leaf beetle (Coleoptera: Chrysomelidae) management for reduction of Bean pod mottle virus. J. Econ. Entomol. 97:192-202.
21. Lam, W., and Pedigo, L. P. 2000. A predictive model for the survival of overwintering bean leaf beetles (Coleoptera: Chrysomelidae). Environ. Entomol. 29:800-806.
22. Lam, W., Pedigo, L. P., and Hinz, P. N. 2001. Population dynamics of bean leaf beetles (Coleoptera: Chrysomelidae) in Iowa. Environ. Entomol. 30:562-567.
23. Lam, W., Pedigo, L. P., and Hinz, P. N. 2002. Spatial distribution and sequential count plans for overwintering bean leaf beetles (Coleoptera: Chrysomelidae). J. Agric. Urban Entomol. 19:73-84.
24. Lecoustre, R., Fargette, D., Fauquet, C., and de Reffye, P. 1989. Analysis and mapping of the spatial spread of African cassava mosaic virus using geostatistics and the kriging technique. Phytopathology 79:913-920. 25. Legendre, P., and Legendre, L. 1998. Numerical Ecology, 2nd ed.
Developments in Environmental Modeling, Vol. 20. Elsevier Science B.V., Amsterdam.
26. Lu, X., Robertson, A. E., Byamukama, E. Z., and Nutter, F. W., Jr. 2010. Evaluating the importance of stem canker of soybean in Iowa. Plant Dis. 94:167-173.
27. Lu, X., Robertson, A. E., Byamukama, E., and Nutter, F. W., Jr. 2010. Prevalence, incidence and spatial dependence of Soybean mosaic virus in Iowa. Phytopathology 100:931-940.
28. Mabry, T. R., Hobbs, H. A., Steinlage, T. A., Johnson, B. B., Pedersen, W. L., Spencer, J. L., Levine, E., Isard, S. A., Domier, L. L., and Hartman, G. L. 2003. Distribution of leaf-feeding beetles and Bean pod mottle virus (BPMV) in Illinois and transmission of BPMV in soybean. Plant Dis. 87:1221-1225.
29. Michelutti, R., Tu, J. C., Hunt, D. W. A., Gagnier., D., Anderson, T. R., Welacky, T. W., and Tenuta, A. U. 2002. First report of Bean pod mottle virus in soybean in Canada. Plant Dis. 86:330.
30. NASS 2012. USDA National Agricultural Statistical Services. Crop Production 2011 Summary (January 2012). http://www.usda.mannlib. cornell.edu/MannUsda/viewDocumentInfo.do?documentID=1047 31. Nelson, M. R., Felix-Gastelum, R., Orum, T. V., Stowell, L. J., and Myers,
D. E. 1994. Geographic information systems and geostatistics in the design and validation of regional plant virus management programs. Phytopathology 84:898-905.
32. Nelson, M. R., Orum, T. V., Jaime-Garcia, R., and Nadeem, A. 1999. Applications of geographic information systems and geostatistics in plant disease epidemiology and management. Plant Dis. 83:308-319.
33. Nutter, F. W. Jr. 1997. Quantifying the temporal dynamics of plant virus epidemics: A review. Crop Prot. 16:603-618.
34. Nutter, F. W., Jr. 2007. The role of plant disease epidemiology in de-veloping successful integrated disease management programs. Pages 43-77 in: General Concepts in Integrated Pest and Disease Management. A. Ciancio and K. G. Mukerji, eds. Springer-Verlag, Dordrecht, The Netherlands.
35. Nutter, F. W., Jr., Byamukama, E., Coelho-Netto, R. A., Eggenberger, S. K., Gleason, M. L., Gougherty, A., Robertson, A. E., and Van Rij, N. 2010. Integrating GPS, GIS, and remote sensing technologies with disease management principles to improve plant health. Pages 59-90 in: GIS Applications in Agriculture-Invasive Species. S. Clay, ed. Taylor & Francis Group LLC, Boca Raton, FL.
36. Nutter, F. W., Jr., and Gaunt, R. E. 1996. Recent developments in methods for assessing disease losses in forage/pasture crops. Pages 93-118 in: Pasture and Forage Crop Pathology. S. Chakraborty, D. T. Leath, R. A. Skipp, G. A. Pederson, R. A. Bray, G. C. M. Latch, and F. W. Nutter, Jr., eds. American Society of Agronomy, Crop Science Society of America, and Soil Science Society of America, Madison, WI.
37. Nutter, F. W., Jr., Schultz, P. M., and Hill, J. H. 1998. Quantification of within-field spread of Soybean mosaic virus in soybean using strain-specific monoclonal antibodies. Phytopathology 88:895-901.
38. Pedersen, P., and Grau, C. 2007. Potential for integrated management of soybean virus disease. Plant Dis. 91:1255-1260.
39. Quiniones, S. S., and Dunleavy, J. M. 1971. Filiform enations in virus-infected soybeans. Phytopathology 61:763-766.
40. Redinbaugh, M. G., Molineros, J. E., Vacha, J., Berry, S. A., Hammond, R. B., Madden, L. V., and Dorrance, A. E. 2010. Bean pod mottle virus spread in insect-feeding-resistant soybean. Plant Dis. 94:265-270. 41. Rice, M. E. 2007. Bean leaf beetle: Predicted peak first-generation dates.
Integrated Crop Manage. Newsl. IC-498:17. Iowa State University, Ames. http://www.ipm.iastate.edu/ipm/icm/2007/7-2/beanleafbeetle.html 42. Smelser, R. B., and Pedigo, L. P. 1991. Phenology of Cerotoma trifurcata
on soybean and alfalfa in Central Iowa. Environ. Entomol. 20:514-519. 43. Stedman J., Robertson A., Byamukama E., and Nutter, F. W., Jr. 2007.
Relationship between percent mortality predictions for bean leaf beetles overwintering populations and incidence of Bean pod mottle virus. (Abstr.) Phytopathology 97:S110.
44. Steel, R. G. D., and Torrie, J. H. 1980. Principles and Procedures of Statistics. McGraw-Hill, New York.
45. Steinlage, T. A., Hill, J. H., and Nutter, F. W., Jr. 2002. Temporal and spatial spread of Soybean mosaic virus (SMV) in soybeans transformed with the coat protein gene of SMV. Phytopathology 92:478-486.
46. Stuckey, R. E., Ghabrial, S. A., and Reicosky, D. A. 1982. Increased incidence of Phomopsis sp. in seeds from soybeans infected with bean pod mottle virus. Plant Dis. 66:826-829.
47. United States Geological Survey 2012. Iowa district climate data. http://ia.water.usgs.gov/climate/index.html
48. Wiegand, T., and Moloney, K. A. 2004. Rings, circles, and null-models for point pattern analysis in ecology. Oikos 104:209-229.
49. Wrather, J. A., Anderson, T. R., Arsyad, D. M., Tan, Y., Ploper, L. D., Porta-Puglia, A., Ram, H. H., and Yorinori, J. T. 2001. Soybean disease loss estimates for the top ten soybean-producing countries in 1998. Can. J. Plant Pathol. 23:115-121.
50. Yang, X. B. 2003. Risk assessment: Concepts, development and future opportunities. Plant Health Progress. Online publication. doi:10.1094/ PHP-2003-1113-02-RV
51. Zadoks, J. C., and Schein, R. D. 1979. Epidemiology and Plant Disease Management. Oxford University Press, New York.


![KAJIAN EFEK MAGNETOIMPEDANSI FREKUENSI RENDAH PADA MULTI LAPISAN [Ni80Fe20/Cu]N KAWAT Cu HASIL ELEKTRODEPOSISI.](data:image/gif;base64,R0lGODlhAQABAIAAAP///wAAACH5BAEAAAAALAAAAAABAAEAAAICRAEAOw==)