Changes in haematocrit and some serum biochemical pro
fi
le of
Changes in haematocrit and some serum biochemical pro
fi
le of
Sahiwal and Jersey × Sahiwal cows in tropical environments
Sahiwal and Jersey × Sahiwal cows in tropical environments
Suratani Sreedhar
Suratani Sreedhar11*, Kapa S. Rao*, Kapa S. Rao22, Jeepalyam Suresh, Jeepalyam Suresh33, , Patrapalle R. S. Moorthy
Patrapalle R. S. Moorthy44, and Velugoti P. Reddy, and Velugoti P. Reddy55 1
1College of Veterinary Science, Sri Venkateswara Veterinary University, Tirupati, Andhra Pradesh, IndiaCollege of Veterinary Science, Sri Venkateswara Veterinary University, Tirupati, Andhra Pradesh, India 2
2College of Veterinary Science, Sri Venkateswara Veterinary University, Proddatur, Andhra Pradesh, IndiaCollege of Veterinary Science, Sri Venkateswara Veterinary University, Proddatur, Andhra Pradesh, India 3
3All India Coordinated Research Project on pigs, Sri Venkateswara Veterinary University, Tirupati, Andhra All India Coordinated Research Project on pigs, Sri Venkateswara Veterinary University, Tirupati, Andhra
Pradesh, India Pradesh, India
4
4Sri Venkateswara Veterinary University, Tirupati, Andhra Pradesh, IndiaSri Venkateswara Veterinary University, Tirupati, Andhra Pradesh, India 5
5 College of Dairy Technology, Sri Venkateswara Veterinary University, Tirupati, Andhra Pradesh, IndiaCollege of Dairy Technology, Sri Venkateswara Veterinary University, Tirupati, Andhra Pradesh, India
________________________________________________________________________________________ ________________________________________________________________________________________
SREEDHAR, S., K. S. RAO, J. SURESH, P. R. S. MOORTHY, V. P. REDDY: SREEDHAR, S., K. S. RAO, J. SURESH, P. R. S. MOORTHY, V. P. REDDY: Changes in haematocrit and some serum biochemical profi le of Sahiwal and Jersey Changes in haematocrit and some serum biochemical profi le of Sahiwal and Jersey × Sahiwal cows in tropical environments.
× Sahiwal cows in tropical environments. Vet. arhiv 83, 171-187, 2013.Vet. arhiv 83, 171-187, 2013. ABSTRACT
ABSTRACT
A study was conducted on the biochemical constituents of pure Sahiwal and Jersey × Sahiwal crossbred A study was conducted on the biochemical constituents of pure Sahiwal and Jersey × Sahiwal crossbred animals in tropical conditions. Six animals were selected from each category of Sahiwal heifers, Sahiwal cows animals in tropical conditions. Six animals were selected from each category of Sahiwal heifers, Sahiwal cows and Jersey × Sahiwal crossbred cows. The biochemical constituents of the above animals were recorded during and Jersey × Sahiwal crossbred cows. The biochemical constituents of the above animals were recorded during the experimental period of 21 days. The haematocrit values (%) of Sahiwal heifers, Sahiwal cows and Jersey the experimental period of 21 days. The haematocrit values (%) of Sahiwal heifers, Sahiwal cows and Jersey × Sahiwal cows were ranged from 29.17 ± 1.22 to 68.00 ± 1.06, 31.00 ± 1.46 to 67.00 ± 1.06 and 31.17 ± × Sahiwal cows were ranged from 29.17 ± 1.22 to 68.00 ± 1.06, 31.00 ± 1.46 to 67.00 ± 1.06 and 31.17 ±
1.17 to 75.83 ± 0.59, respectively. A non-signifi cant difference was observed in haematocrit values of Sahiwal
1.17 to 75.83 ± 0.59, respectively. A non-signifi cant difference was observed in haematocrit values of Sahiwal
heifers and cows, whereas a signifi cant (P<0.01) variation was recorded for Jersey × Sahiwal crossbred cows.
heifers and cows, whereas a signifi cant (P<0.01) variation was recorded for Jersey × Sahiwal crossbred cows.
The serum glucose, urea and creatinine levels (mg/dL) of Sahiwal heifers, Sahiwal cows and Jersey × Sahiwal The serum glucose, urea and creatinine levels (mg/dL) of Sahiwal heifers, Sahiwal cows and Jersey × Sahiwal cows ranged from 61.90 ± 1.34 to 97.32 ± 0.63, 58.61 ± 1.20 to 96.90 ± 0.65 and 59.26 ± 0.58 to 113.33 ± cows ranged from 61.90 ± 1.34 to 97.32 ± 0.63, 58.61 ± 1.20 to 96.90 ± 0.65 and 59.26 ± 0.58 to 113.33 ± 0.71, 11.72 ± 0.94 to 47.21 ± 0.64, 11.70 ± 0.65 to 45.44 ± 0.42 and 14.00 ± 0.58 to 63.99 ± 0.41 and 1.25 ± 0.71, 11.72 ± 0.94 to 47.21 ± 0.64, 11.70 ± 0.65 to 45.44 ± 0.42 and 14.00 ± 0.58 to 63.99 ± 0.41 and 1.25 ± 0.07 to 9.81 ± 0.13, 1.29 ± 0.09 to 9.90 ± 0.17 and 1.43 ± 0.10 to 16.18 ± 0.15, respectively. The average serum 0.07 to 9.81 ± 0.13, 1.29 ± 0.09 to 9.90 ± 0.17 and 1.43 ± 0.10 to 16.18 ± 0.15, respectively. The average serum
glucose values were signifi cantly (P<0.01) different among all the experimental animals during adaptability.
glucose values were signifi cantly (P<0.01) different among all the experimental animals during adaptability.
The serum calcium and phosphorous levels (mg/dL) of Sahiwal heifers, Sahiwal cows and Jersey × Sahiwal The serum calcium and phosphorous levels (mg/dL) of Sahiwal heifers, Sahiwal cows and Jersey × Sahiwal cows ranged from 10.59 ± 0.29 to 27.17 ± 0.29, 10.84 ± 0.27 to 26.61 ± 0.46 and 10.45 ± 0.33 to 36.76 ± 0.71, cows ranged from 10.59 ± 0.29 to 27.17 ± 0.29, 10.84 ± 0.27 to 26.61 ± 0.46 and 10.45 ± 0.33 to 36.76 ± 0.71, 5.85 ± 0.05 to 18.91 ± 0.21, 5.94 ± 0.08 to 18.87 ± 0.12 and 5.88 ± 0.10 to 20.80 ± 0.13, respectively. A non- 5.85 ± 0.05 to 18.91 ± 0.21, 5.94 ± 0.08 to 18.87 ± 0.12 and 5.88 ± 0.10 to 20.80 ± 0.13, respectively. A non-
signifi cant difference was observed in serum calcium and phosphorous levels for Sahiwal heifers and Sahiwal
signifi cant difference was observed in serum calcium and phosphorous levels for Sahiwal heifers and Sahiwal
cows, whereas a signifi cant (P<0.01) variation was recorded for Jersey × Sahiwal crossbred cows in relation
cows, whereas a signifi cant (P<0.01) variation was recorded for Jersey × Sahiwal crossbred cows in relation
to adaptability. The present study concludes that haematocrit, glucose, urea, creatinine, calcium, phosphorous to adaptability. The present study concludes that haematocrit, glucose, urea, creatinine, calcium, phosphorous
*Corresponding author:
Suratani Sreedhar, Programme Coordinator, Krishi Vigyan Kendra, Lam Farm, Guntur (Dist.), Pin: 522034, Andhra Pradesh, Suratani Sreedhar, Programme Coordinator, Krishi Vigyan Kendra, Lam Farm, Guntur (Dist.), Pin: 522034, Andhra Pradesh, India, Phone: +944 0464 248; Fax: +863 2425 200; E-mail: sreedhar_svvu@yahoo.co.in
levels of the Sahiwal cows were signifi cantly (P<0.01) higher during the fi rst three days of the experimental levels of the Sahiwal cows were signifi cantly (P<0.01) higher during the fi rst three days of the experimental period and later declined to the normal range of the species. In the case of Jersey × Sahiwal crossbred cows, period and later declined to the normal range of the species. In the case of Jersey × Sahiwal crossbred cows, higher levels of haematocrit and the above serum constituents were observed for a period of six days, which higher levels of haematocrit and the above serum constituents were observed for a period of six days, which later declined to reach the normal range of the species in tropical environments.
later declined to reach the normal range of the species in tropical environments.
Key words:
Key words: biochemical constituents, Sahiwal and Jersey × Sahiwal cows biochemical constituents, Sahiwal and Jersey × Sahiwal cows
________________________________________________________________________________________ ________________________________________________________________________________________
Introduction Introduction
An important factor that affects the productive and reproductive performance of An important factor that affects the productive and reproductive performance of crossbred cows is climate, which infl uences the adaptability of dairy cows to a particular crossbred cows is climate, which infl uences the adaptability of dairy cows to a particular environment, mostly tropical conditions. Exposure to a tropical environment affects both environment, mostly tropical conditions. Exposure to a tropical environment affects both the behaviour and physiology of cattle and can impair animal welfare. Increased heat the behaviour and physiology of cattle and can impair animal welfare. Increased heat load, caused by a combination of air temperature, relative humidity, wind velocity and load, caused by a combination of air temperature, relative humidity, wind velocity and solar radiation, increases body temperature and respiration rate, and can reduce feed solar radiation, increases body temperature and respiration rate, and can reduce feed intake and milk production
intake and milk production ((HAHN, 1999; OMINSKI HAHN, 1999; OMINSKI et al., 2002; et al., 2002; WEST, 2WEST, 2003003). Excessive ). Excessive heat load affects the animal’s thermoregulatory mechanism, creates a stressful condition heat load affects the animal’s thermoregulatory mechanism, creates a stressful condition and negatively affects the breeding performance in dairy cattle, by reducing fertility and and negatively affects the breeding performance in dairy cattle, by reducing fertility and in extreme cases results in death.
in extreme cases results in death.
Therefore the evaluation of the biochemical profi le of indigenous and crossbred Therefore the evaluation of the biochemical profi le of indigenous and crossbred cattle in tropical environmental conditions is an essential prerequisite for the selection cattle in tropical environmental conditions is an essential prerequisite for the selection of animals and estimation of production and reproduction effi ciency. Hence, the present of animals and estimation of production and reproduction effi ciency. Hence, the present study was undertaken to study the biochemical constituents of pure Sahiwal and Jersey × study was undertaken to study the biochemical constituents of pure Sahiwal and Jersey × Sahiwal crossbred cows in tropical conditions.
Sahiwal crossbred cows in tropical conditions. Materials and methods
Materials and methods
The study was carried out on eighteen Sahiwal and Jersey × Sahiwal animals maintained The study was carried out on eighteen Sahiwal and Jersey × Sahiwal animals maintained at the Dairy Experimental Station, Department of Livestock Production and Management, at the Dairy Experimental Station, Department of Livestock Production and Management, College of Veterinary Science, Tirupati Andhra Pradesh, India. The laboratory analysis College of Veterinary Science, Tirupati Andhra Pradesh, India. The laboratory analysis was conducted at the Department of Livestock Production and Management, College of was conducted at the Department of Livestock Production and Management, College of Veterinary Science, Tirupati.
Veterinary Science, Tirupati. Topography of the study area.
Topography of the study area. The institute is situated 182.9 meters above mean seal The institute is situated 182.9 meters above mean seal level at 13.27
level at 13.27 00N Latitude and 79.36 N Latitude and 79.36 00E Longitude. The average annual rainfall is around E Longitude. The average annual rainfall is around
900 mm. The climate of the area is typically tropical. The average temperature ranges 900 mm. The climate of the area is typically tropical. The average temperature ranges from 25-45
from 25-45 00C (Annual report, 2010 Regional Agricultural Research Station, Tirupati). C (Annual report, 2010 Regional Agricultural Research Station, Tirupati).
Selection of animals.
Selection of animals. The Sahiwal heifers and cows were purchased from Rohtak. The Sahiwal heifers and cows were purchased from Rohtak. The Jersey × Sahiwal crossbred cows were purchased from Puthalapattu, Thavanampalli The Jersey × Sahiwal crossbred cows were purchased from Puthalapattu, Thavanampalli and Bangarupalyam mandals of the Chittoor District of Andhra Pradesh, India, from and Bangarupalyam mandals of the Chittoor District of Andhra Pradesh, India, from known pedigree.
The biochemical studies were conducted on Sahiwal heifers, cows and Jersey × The biochemical studies were conducted on Sahiwal heifers, cows and Jersey × Sahiwal crossbred cows by selecting six animals from each category. The biochemical Sahiwal crossbred cows by selecting six animals from each category. The biochemical constituents of the above animals were recorded and the data was analysed using constituents of the above animals were recorded and the data was analysed using Completely Randomized Design (CRD).
Completely Randomized Design (CRD). Management of animals.
Management of animals. All the animals at Dairy Experimental Station were housed All the animals at Dairy Experimental Station were housed individually under a loose housing system and they were kept in open paddocks with roof individually under a loose housing system and they were kept in open paddocks with roof over mangers. The nutritional requirement was standardized, as per the ICAR standards. over mangers. The nutritional requirement was standardized, as per the ICAR standards. The heifers and cows were fed with green fodder at the rate of 15 and 25 kg respectively. The heifers and cows were fed with green fodder at the rate of 15 and 25 kg respectively. Similarly dry fodder and concentrates were provided to the heifers and cows at the rate of Similarly dry fodder and concentrates were provided to the heifers and cows at the rate of 3.0 and 6.0 kg and 1.5 and 3.0 kg respectively. The animals had free access to fresh and 3.0 and 6.0 kg and 1.5 and 3.0 kg respectively. The animals had free access to fresh and clean drinking water all the time. All types of veterinary aid measures were taken for all clean drinking water all the time. All types of veterinary aid measures were taken for all animals, which were followed as per farm schedule.
animals, which were followed as per farm schedule.
The animals maintained by the farmers under the Progeny Testing Programme were The animals maintained by the farmers under the Progeny Testing Programme were kept under back yard rearing. The animals were allowed for 5-6 hours of grazing and fed kept under back yard rearing. The animals were allowed for 5-6 hours of grazing and fed ad libitum with dry fodder and green fodder, and 1-2 kg of concentrate feed irrespective ad libitum with dry fodder and green fodder, and 1-2 kg of concentrate feed irrespective of their milk yield.
of their milk yield.
Collection of meteorological data
Collection of meteorological data. The information regarding various components of . The information regarding various components of climatic variables was collected from Regional Agricultural Research station, Tirupati, climatic variables was collected from Regional Agricultural Research station, Tirupati, Andhra Pradesh, India. The climatic variables, as experienced during the study period, Andhra Pradesh, India. The climatic variables, as experienced during the study period, were temperature, dry bulb temperature, wet bulb temperature, relative humidity, wind were temperature, dry bulb temperature, wet bulb temperature, relative humidity, wind speed, sunshine and rainfall.
speed, sunshine and rainfall.
Temperature humidity index (THI).
Temperature humidity index (THI). To estimate the comfort and discomfort of the To estimate the comfort and discomfort of the animals, the Temperature Humidity Index was calculated using the following formula: animals, the Temperature Humidity Index was calculated using the following formula:
THI (0.35 × T
THI (0.35 × Tdbdb +0.65 × T +0.65 × Twbwb) × 1.8+32 () × 1.8+32 (BIANCA, 1962BIANCA, 1962) ) Where T
Where Tdbdb : Dry bulb temperature (°C) : Dry bulb temperature (°C) T
Twb wb : Wet bulb temperature (°C): Wet bulb temperature (°C) Blood biochemical profi le.
Blood biochemical profi le. The biochemical constituents of Sahiwal and Jersey × The biochemical constituents of Sahiwal and Jersey × Sahiwal crossbred cows were investigated for a period of 21 days.
Sahiwal crossbred cows were investigated for a period of 21 days. Collection of blood.
Collection of blood. Blood samples (2 mL) were collected by puncturing the jugular Blood samples (2 mL) were collected by puncturing the jugular vein of the experimental animals into sterile vials containing disodium salt of EDTA vein of the experimental animals into sterile vials containing disodium salt of EDTA 2 mg/mL as anticoagulant under aseptic conditions, for estimation of PCV. The blood 2 mg/mL as anticoagulant under aseptic conditions, for estimation of PCV. The blood samples were labelled and brought to the laboratory for further investigation. For samples were labelled and brought to the laboratory for further investigation. For estimation of biochemical blood constituents, 10 mL of blood samples were collected estimation of biochemical blood constituents, 10 mL of blood samples were collected from the experimental animals without adding anticoagulant. Serum was separated from the experimental animals without adding anticoagulant. Serum was separated by centrifugation and transferred into a sterilized plastic vial, and labelled. The serum by centrifugation and transferred into a sterilized plastic vial, and labelled. The serum samples were used immediately for glucose estimation. The samples which were not able samples were used immediately for glucose estimation. The samples which were not able to be analysed on the same day of collection were stored at -20
to be analysed on the same day of collection were stored at -20 00C until analysed (until C until analysed (until
72 hours after collection of blood). Clean glassware, micropipettes of different capacities 72 hours after collection of blood). Clean glassware, micropipettes of different capacities
and analytical grade chemicals were used in the study. The blood samples were collected and analytical grade chemicals were used in the study. The blood samples were collected from Sahiwal and Jersey × Sahiwal animals daily at 7.00 a.m..
from Sahiwal and Jersey × Sahiwal animals daily at 7.00 a.m.. Haematocrit values.
Haematocrit values. Haematocrit valuesHaematocrit values (PCV) were measured by the (PCV) were measured by the
microhaematocrit method,
microhaematocrit method, using plain capillary tubes (7 mm × 1 mm) and were read on using plain capillary tubes (7 mm × 1 mm) and were read on an Adams microhaematocrit, as per the procedure by
an Adams microhaematocrit, as per the procedure by JAIN (1986)JAIN (1986).. Blood constituents.
Blood constituents. The blood constituents like glucose, urea, creatinine, calcium, The blood constituents like glucose, urea, creatinine, calcium, phosphorus, were studied on a “Prietest Auto Biochemistry Analyser” supplied by phosphorus, were studied on a “Prietest Auto Biochemistry Analyser” supplied by Robonik (India) Pvt. Ltd., Navi Mumbai using the reagent kits supplied by Agappe Robonik (India) Pvt. Ltd., Navi Mumbai using the reagent kits supplied by Agappe diagnostics Pvt. Ltd., Ernakulam, Kerala.
diagnostics Pvt. Ltd., Ernakulam, Kerala.
The data was subjected to analysis of variance (
The data was subjected to analysis of variance (SNEDECOR SNEDECOR andand COCHRAN, 1994 COCHRAN, 1994) and ) and the means were compared by Least Square Difference (LSD) test.
the means were compared by Least Square Difference (LSD) test. Results
Results
Haematocrit values (PCV).
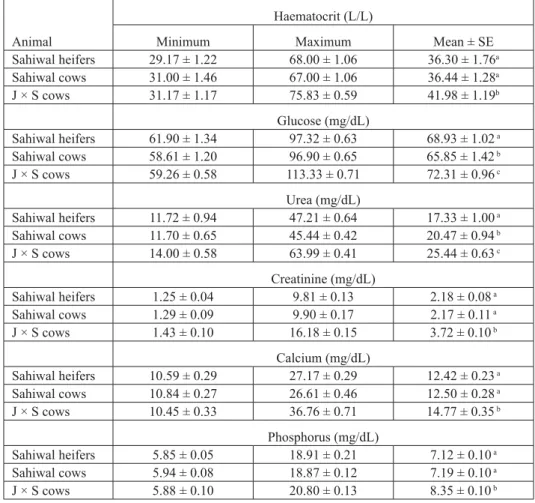
Haematocrit values (PCV). The data on average haematocrit (PCV), glucose, urea, The data on average haematocrit (PCV), glucose, urea, creatinine, calcium and phosphorus values in Sahiwal heifers, cows and Jersey × Sahiwal creatinine, calcium and phosphorus values in Sahiwal heifers, cows and Jersey × Sahiwal crossbred cows during adaptability are presented in Table 1.
crossbred cows during adaptability are presented in Table 1.
The haematocrit values (L/L) of Sahiwal heifers, cows and Jersey × Sahiwal cows The haematocrit values (L/L) of Sahiwal heifers, cows and Jersey × Sahiwal cows ranged from 29.17 ± 1.22 to 68.00 ± 1.06, 31.00 ± 1.46 to 67.00 ± 1.06 and 31.17 ± ranged from 29.17 ± 1.22 to 68.00 ± 1.06, 31.00 ± 1.46 to 67.00 ± 1.06 and 31.17 ± 1.17 to 75.83 ± 0.59 respectively during their adaptability. The haematocrit values of the 1.17 to 75.83 ± 0.59 respectively during their adaptability. The haematocrit values of the Sahiwal heifers and cows were higher during the fi rst three days, and later declined to the Sahiwal heifers and cows were higher during the fi rst three days, and later declined to the normal range of the species, whereas in Jersey × Sahiwal cows higher haematocrit values normal range of the species, whereas in Jersey × Sahiwal cows higher haematocrit values were observed during the fi rst six days.
were observed during the fi rst six days.
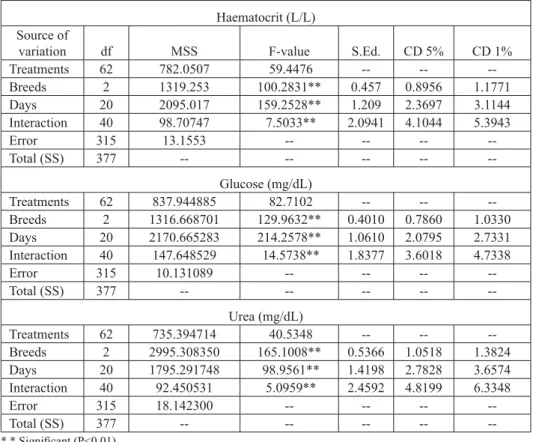
A non-signifi cant difference was observed in haematocrit values of Sahiwal heifers A non-signifi cant difference was observed in haematocrit values of Sahiwal heifers and cows, whereas a highly signifi cant (P<0.01) variation was recorded with Jersey × and cows, whereas a highly signifi cant (P<0.01) variation was recorded with Jersey × Sahiwal crossbred cows (Table 2).
Sahiwal crossbred cows (Table 2). Glucose.
Glucose. The glucose levels (mg/dL) of Sahiwal heifers, cows and Jersey × Sahiwal The glucose levels (mg/dL) of Sahiwal heifers, cows and Jersey × Sahiwal cows ranged from 61.90 ± 1.34 to 97.32 ± 0.63, 58.61 ± 1.20 to 96.90 ± 0.65 and 59.26 cows ranged from 61.90 ± 1.34 to 97.32 ± 0.63, 58.61 ± 1.20 to 96.90 ± 0.65 and 59.26 ± 0.58 to 113.33 ± 0.71 respectively during their adaptability. The glucose levels of the ± 0.58 to 113.33 ± 0.71 respectively during their adaptability. The glucose levels of the Sahiwal heifers and cows were higher during the fi rst three days and later declined to the Sahiwal heifers and cows were higher during the fi rst three days and later declined to the normal range of the species, whereas in Jersey × Sahiwal cows higher glucose levels were normal range of the species, whereas in Jersey × Sahiwal cows higher glucose levels were observed during the fi rst six days.
observed during the fi rst six days.
The average glucose values were highly signifi cantly (P<0.01) different among The average glucose values were highly signifi cantly (P<0.01) different among Sahiwal heifers, Sahiwal cows and Jersey × Sahiwal cows (Table 2).
Sahiwal heifers, Sahiwal cows and Jersey × Sahiwal cows (Table 2). Urea.
Urea. The blood urea levels (mg/dL) of Sahiwal heifers, cows and Jersey × Sahiwal The blood urea levels (mg/dL) of Sahiwal heifers, cows and Jersey × Sahiwal cows ranged from 11.72 ± 0.94 to 47.21 ± 0.64, 11.70 ± 0.65 to 45.44 ± 0.42 and 14.00 cows ranged from 11.72 ± 0.94 to 47.21 ± 0.64, 11.70 ± 0.65 to 45.44 ± 0.42 and 14.00 ± 0.58 to 63.99 ± 0.41 respectively during their adaptability. In Sahiwal heifers and cows ± 0.58 to 63.99 ± 0.41 respectively during their adaptability. In Sahiwal heifers and cows higher blood urea levels were recorded during the fi rst three days, and they later declined higher blood urea levels were recorded during the fi rst three days, and they later declined to the normal range of the species, whereas in Jersey × Sahiwal cows higher levels were to the normal range of the species, whereas in Jersey × Sahiwal cows higher levels were observed during the fi rst six days.
Table 1. Average biochemical constituents in pure and crossbred animals during adaptability (n = 6) Table 1. Average biochemical constituents in pure and crossbred animals during adaptability (n = 6)
Animal
Haematocrit (L/L)
Minimum Maximum Mean ± SE
Sahiwal heifers 29.17 ± 1.22 68.00 ± 1.06 36.30 ± 1.76a Sahiwal cows 31.00 ± 1.46 67.00 ± 1.06 36.44 ± 1.28a J × S cows 31.17 ± 1.17 75.83 ± 0.59 41.98 ± 1.19b Glucose (mg/dL) Sahiwal heifers 61.90 ± 1.34 97.32 ± 0.63 68.93 ± 1.02 a Sahiwal cows 58.61 ± 1.20 96.90 ± 0.65 65.85 ± 1.42 b J × S cows 59.26 ± 0.58 113.33 ± 0.71 72.31 ± 0.96 c Urea (mg/dL) Sahiwal heifers 11.72 ± 0.94 47.21 ± 0.64 17.33 ± 1.00 a Sahiwal cows 11.70 ± 0.65 45.44 ± 0.42 20.47 ± 0.94 b J × S cows 14.00 ± 0.58 63.99 ± 0.41 25.44 ± 0.63 c Creatinine (mg/dL) Sahiwal heifers 1.25 ± 0.04 9.81 ± 0.13 2.18 ± 0.08 a Sahiwal cows 1.29 ± 0.09 9.90 ± 0.17 2.17 ± 0.11 a J × S cows 1.43 ± 0.10 16.18 ± 0.15 3.72 ± 0.10 b Calcium (mg/dL) Sahiwal heifers 10.59 ± 0.29 27.17 ± 0.29 12.42 ± 0.23 a Sahiwal cows 10.84 ± 0.27 26.61 ± 0.46 12.50 ± 0.28 a J × S cows 10.45 ± 0.33 36.76 ± 0.71 14.77 ± 0.35 b Phosphorus (mg/dL) Sahiwal heifers 5.85 ± 0.05 18.91 ± 0.21 7.12 ± 0.10 a Sahiwal cows 5.94 ± 0.08 18.87 ± 0.12 7.19 ± 0.10 a J × S cows 5.88 ± 0.10 20.80 ± 0.13 8.35 ± 0.10 b
a, b : Values with different superscripts in a column differ signifi cantly (P<0.01) a, b : Values with different superscripts in a column differ signifi cantly (P<0.01)
Normal range - Haematocrit (L/L) 24-46, Glucose (mg/dL) 45-75, Urea (mg/dL) 6-27, Creatinine (mg/dL) 1-2, Normal range - Haematocrit (L/L) 24-46, Glucose (mg/dL) 45-75, Urea (mg/dL) 6-27, Creatinine (mg/dL) 1-2, Calcium (mg/dL) 9.7-12.4, Phosphorus (mg/dL) 5.6-6.5 (
Table 2. ANOVA of haematocrit (PCV), glucose and urea levels in pure and crossbred animals Table 2. ANOVA of haematocrit (PCV), glucose and urea levels in pure and crossbred animals
during adaptability during adaptability Haematocrit (L/L) Source of
variation df MSS F-value S.Ed. CD 5% CD 1%
Treatments 62 782.0507 59.4476 -- -- --Breeds 2 1319.253 100.2831** 0.457 0.8956 1.1771 Days 20 2095.017 159.2528** 1.209 2.3697 3.1144 Interaction 40 98.70747 7.5033** 2.0941 4.1044 5.3943 Error 315 13.1553 -- -- -- --Total (SS) 377 -- -- -- -- --Glucose (mg/dL) Treatments 62 837.944885 82.7102 -- -- --Breeds 2 1316.668701 129.9632** 0.4010 0.7860 1.0330 Days 20 2170.665283 214.2578** 1.0610 2.0795 2.7331 Interaction 40 147.648529 14.5738** 1.8377 3.6018 4.7338 Error 315 10.131089 -- -- -- --Total (SS) 377 -- -- -- -- --Urea (mg/dL) Treatments 62 735.394714 40.5348 -- -- --Breeds 2 2995.308350 165.1008** 0.5366 1.0518 1.3824 Days 20 1795.291748 98.9561** 1.4198 2.7828 3.6574 Interaction 40 92.450531 5.0959** 2.4592 4.8199 6.3348 Error 315 18.142300 -- -- -- --Total (SS) 377 -- -- -- -- --* --* Signifi cant (P<0.01) * * Signifi cant (P<0.01)
The average blood urea levels were highly signifi cantly (P<0.01) different among The average blood urea levels were highly signifi cantly (P<0.01) different among Sahiwal heifers, Sahiwal cows and Jersey × Sahiwal cows (Table 2).
Sahiwal heifers, Sahiwal cows and Jersey × Sahiwal cows (Table 2). Creatinine.
Creatinine. The serum creatinine levels (mg/dL) of Sahiwal heifers, cows and Jersey The serum creatinine levels (mg/dL) of Sahiwal heifers, cows and Jersey × Sahiwal cows ranged from 1.25 ± 0.07 to 9.81 ± 0.13, 1.29 ± 0.09 to 9.90 ± 0.17 and × Sahiwal cows ranged from 1.25 ± 0.07 to 9.81 ± 0.13, 1.29 ± 0.09 to 9.90 ± 0.17 and 1.43 ± 0.10 to 16.18 ± 0.15 respectively during their adaptability. The haematocrit values 1.43 ± 0.10 to 16.18 ± 0.15 respectively during their adaptability. The haematocrit values of the Sahiwal heifers and cows were higher during the fi rst three days and later declined of the Sahiwal heifers and cows were higher during the fi rst three days and later declined to the normal range of the species, whereas in Jersey × Sahiwal cows higher haematocrit to the normal range of the species, whereas in Jersey × Sahiwal cows higher haematocrit values were observed during the fi rst six days.
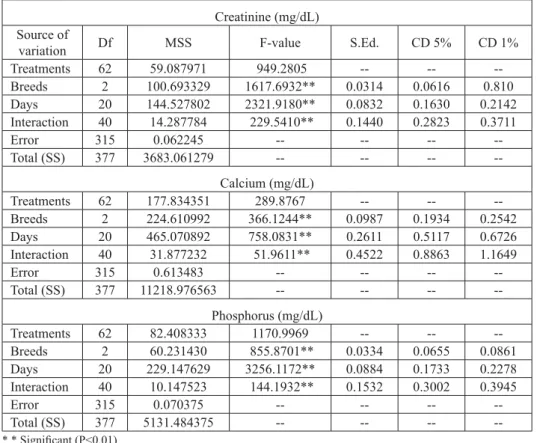
A non-signifi cant difference was observed in serum creatinine levels between Sahiwal A non-signifi cant difference was observed in serum creatinine levels between Sahiwal heifers and Sahiwal cows, while a highly signifi cant (P<0.01) variation was recorded with heifers and Sahiwal cows, while a highly signifi cant (P<0.01) variation was recorded with Jersey × Sahiwal crossbred cows (Table 3).
Jersey × Sahiwal crossbred cows (Table 3).
Table 3. ANOVA of serum creatinine, calcium and phosphurs levels in pure and crossbred animals Table 3. ANOVA of serum creatinine, calcium and phosphurs levels in pure and crossbred animals
during adaptability during adaptability Creatinine (mg/dL) Source of
variation Df MSS F-value S.Ed. CD 5% CD 1%
Treatments 62 59.087971 949.2805 -- -- --Breeds 2 100.693329 1617.6932** 0.0314 0.0616 0.810 Days 20 144.527802 2321.9180** 0.0832 0.1630 0.2142 Interaction 40 14.287784 229.5410** 0.1440 0.2823 0.3711 Error 315 0.062245 -- -- -- --Total (SS) 377 3683.061279 -- -- -- --Calcium (mg/dL) Treatments 62 177.834351 289.8767 -- -- --Breeds 2 224.610992 366.1244** 0.0987 0.1934 0.2542 Days 20 465.070892 758.0831** 0.2611 0.5117 0.6726 Interaction 40 31.877232 51.9611** 0.4522 0.8863 1.1649 Error 315 0.613483 -- -- -- --Total (SS) 377 11218.976563 -- -- -- --Phosphorus (mg/dL) Treatments 62 82.408333 1170.9969 -- -- --Breeds 2 60.231430 855.8701** 0.0334 0.0655 0.0861 Days 20 229.147629 3256.1172** 0.0884 0.1733 0.2278 Interaction 40 10.147523 144.1932** 0.1532 0.3002 0.3945 Error 315 0.070375 -- -- -- --Total (SS) 377 5131.484375 -- -- -- --* --* Signifi cant (P<0.01) * * Signifi cant (P<0.01) Calcium.
Calcium. The serum calcium levels (mg/dL) of Sahiwal heifers, cows and Jersey × The serum calcium levels (mg/dL) of Sahiwal heifers, cows and Jersey × Sahiwal cows ranged from 10.59 ± 0.29 to 27.17 ± 0.29, 10.84 ± 0.27 to 26.61 ± 0.46 and Sahiwal cows ranged from 10.59 ± 0.29 to 27.17 ± 0.29, 10.84 ± 0.27 to 26.61 ± 0.46 and 10.45 ± 0.33 to 36.76 ± 0.71 respectively during their adaptability. In Sahiwal heifers and 10.45 ± 0.33 to 36.76 ± 0.71 respectively during their adaptability. In Sahiwal heifers and cows higher serum calcium levels were recorded during the fi rst three days, which later cows higher serum calcium levels were recorded during the fi rst three days, which later declined to the normal range of the species, whereas in Jersey × Sahiwal cows higher declined to the normal range of the species, whereas in Jersey × Sahiwal cows higher levels were observed during the fi rst six days.
A non-signifi cant difference was observed in serum calcium levels between Sahiwal A non-signifi cant difference was observed in serum calcium levels between Sahiwal heifers and cows, whereas a highly signifi cant (P<0.01) variation was recorded with heifers and cows, whereas a highly signifi cant (P<0.01) variation was recorded with Jersey × Sahiwal crossbred cows.
Jersey × Sahiwal crossbred cows. Phosphorus.
Phosphorus. The serum phosphorus levels (mg/dL) of Sahiwal heifers, cows and The serum phosphorus levels (mg/dL) of Sahiwal heifers, cows and Jersey × Sahiwal cows ranged from 5.85 ± 0.05 to 18.91 ± 0.21, 5.94 ± 0.08 to 18.87 ± Jersey × Sahiwal cows ranged from 5.85 ± 0.05 to 18.91 ± 0.21, 5.94 ± 0.08 to 18.87 ± 0.12 and 5.88 ± 0.10 to 20.80 ± 0.13 respectively during their adaptability. The phosphorus 0.12 and 5.88 ± 0.10 to 20.80 ± 0.13 respectively during their adaptability. The phosphorus levels of the Sahiwal heifers and cows were higher during the fi rst three days and later levels of the Sahiwal heifers and cows were higher during the fi rst three days and later declined to the normal range of the species, whereas in Jersey × Sahiwal cows higher declined to the normal range of the species, whereas in Jersey × Sahiwal cows higher phosphorus levels were observed during the fi rst six days.
phosphorus levels were observed during the fi rst six days.
A non-signifi cant difference was observed in serum phosphorus levels of Sahiwal A non-signifi cant difference was observed in serum phosphorus levels of Sahiwal heifers and cows, whereas a highly signifi cant (P<0.01) variation was recorded with heifers and cows, whereas a highly signifi cant (P<0.01) variation was recorded with Jersey × Sahiwal crossbred cows (Table 3).
Jersey × Sahiwal crossbred cows (Table 3).
Table 4. Correlation coeffi cient of haematocrit, glucose and urea levels in pure and crossbred Table 4. Correlation coeffi cient of haematocrit, glucose and urea levels in pure and crossbred
animals in relation to meteorological data during adaptability (n = 6) animals in relation to meteorological data during adaptability (n = 6) Meteorological
parameter
Haematocrit (PCV) Glucose Urea
Sahiwal
heifers Sahiwal cows cows J × S Sahiwal heifers Sahiwal cows J × S cows Sahiwal heifers Sahiwal cows cows J × S Temperature Humidity Index 0.5698** 0.5902** 0.5004* 0.5396* 0.5761** 0.5275* 0.5535** 0.5939** 0.5161* Relative humidity (%) 0.3084 0.2494 0.1481 0.1962 0.1936 0.2171 0.2395 0.2344 0.2243 Maximum temperature (0C) 0.3750 0.4226 0.5386* 0.4379* 0.4860* 0.5018* 0.4398* 0.4736* 0.4729* Minimum temperature (0C) 0.0630 0.0618 -0.0434 0.0080 0.0214 0.0031 -0.0026 0.0222 -0.0384 Average temperature (0C) 0.5030* 0.5390* 0.5141* 0.5305* 0.5966** 0.5004* 0.5557** 0.5701** 0.5185* Evaporation (mm) 0.2764 0.2713 0.4061 0.3651 0.3146 0.4641* 0.3098 0.3502 0.3789 Wind velocity (kmph) -0.1325 -0.1313 -0.2061 -0.1689 -0.1839 -0.2308 -0.1751 -0.1964 -0.1671 Sunshine (hours) 0.3333 0.3652 0.6306** 0.4954* 0.5011* 0.5620** 0.4908* 0.5010* 0.5980**
* Signifi cant P<0.05 (r≥0.433); ** Signifi cant P<0.01 (r≥0.549) * Signifi cant P<0.05 (r≥0.433); ** Signifi cant P<0.01 (r≥0.549)
The correlation coeffi cients of haematocrit, glucose and urea in Sahiwal heifers, The correlation coeffi cients of haematocrit, glucose and urea in Sahiwal heifers, cows and Jersey × Sahiwal crossbred cows are presented in Table 4. The Temperature cows and Jersey × Sahiwal crossbred cows are presented in Table 4. The Temperature Humidity Inde × correlated highly signifi cantly (P<0.01) with haematocrit values in Humidity Inde × correlated highly signifi cantly (P<0.01) with haematocrit values in Sahiwal heifers and Sahiwal cows whereas correlation was observed at P<0.05 in Jersey Sahiwal heifers and Sahiwal cows whereas correlation was observed at P<0.05 in Jersey × Sahiwal crossbred cows. The relative humidity and evaporation were not signifi cantly × Sahiwal crossbred cows. The relative humidity and evaporation were not signifi cantly
correlated with haematocrit values among Sahiwal heifers, Sahiwal cows and Jersey × correlated with haematocrit values among Sahiwal heifers, Sahiwal cows and Jersey × Sahiwal crossbred cows. The average temperature was signifi cantly (P<0.05) correlated Sahiwal crossbred cows. The average temperature was signifi cantly (P<0.05) correlated with haematocrit values among all the three groups of experimental animals. A negative with haematocrit values among all the three groups of experimental animals. A negative correlation was observed between wind velocity and haematocrits of three groups correlation was observed between wind velocity and haematocrits of three groups of experimental animals. Sunshine was highly signifi cantly (P<0.01) correlated with of experimental animals. Sunshine was highly signifi cantly (P<0.01) correlated with haematocrit values in Jersey × Sahiwal crossbred cows.
haematocrit values in Jersey × Sahiwal crossbred cows.
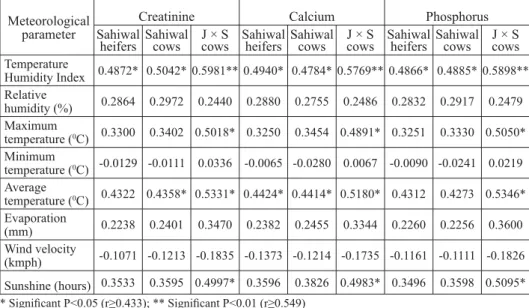
Table 5. Correlation coeffi cient of creatinine, calcium and phosphorus levels in pure and crossbred Table 5. Correlation coeffi cient of creatinine, calcium and phosphorus levels in pure and crossbred
animals in relation to materiological data during adaptability (n = 6) animals in relation to materiological data during adaptability (n = 6) Meteorological
parameter
Creatinine Calcium Phosphorus Sahiwal
heifers Sahiwal cows cows J × S Sahiwal heifers Sahiwal cows J × S cows Sahiwal heifers Sahiwal cows J × S cows Temperature Humidity Index 0.4872* 0.5042* 0.5981** 0.4940* 0.4784* 0.5769** 0.4866* 0.4885* 0.5898** Relative humidity (%) 0.2864 0.2972 0.2440 0.2880 0.2755 0.2486 0.2832 0.2917 0.2479 Maximum temperature (0C) 0.3300 0.3402 0.5018* 0.3250 0.3454 0.4891* 0.3251 0.3330 0.5050* Minimum temperature (0C) -0.0129 -0.0111 0.0336 -0.0065 -0.0280 0.0067 -0.0090 -0.0241 0.0219 Average temperature (0C) 0.4322 0.4358* 0.5331* 0.4424* 0.4414* 0.5180* 0.4312 0.4273 0.5346* Evaporation (mm) 0.2238 0.2401 0.3470 0.2382 0.2455 0.3344 0.2260 0.2256 0.3600 Wind velocity (kmph) -0.1071 -0.1213 -0.1835 -0.1373 -0.1214 -0.1735 -0.1161 -0.1111 -0.1826 Sunshine (hours) 0.3533 0.3595 0.4997* 0.3596 0.3826 0.4983* 0.3496 0.3598 0.5095*
* Signifi cant P<0.05 (r≥0.433); ** Signifi cant P<0.01 (r≥0.549) * Signifi cant P<0.05 (r≥0.433); ** Signifi cant P<0.01 (r≥0.549)
The Temperature Humidity Index was highly signifi cantly (P<0.01) correlated with The Temperature Humidity Index was highly signifi cantly (P<0.01) correlated with glucose in Sahiwal cows, whereas a signifi cant (P<0.05) correlation was observed in glucose in Sahiwal cows, whereas a signifi cant (P<0.05) correlation was observed in Sahiwal heifers and Jersey
Sahiwal heifers and Jersey Sahiwal crossbred cows. The relative humidity was not Sahiwal crossbred cows. The relative humidity was not signifi cantly correlated with serum glucose in all experimental animals. The average signifi cantly correlated with serum glucose in all experimental animals. The average temperature was highly signifi cantly (P<0.01) correlated with glucose in Sahiwal cows, temperature was highly signifi cantly (P<0.01) correlated with glucose in Sahiwal cows, whereas a signifi cant (P<0.05) correlation was observed in Sahiwal heifers and Jersey whereas a signifi cant (P<0.05) correlation was observed in Sahiwal heifers and Jersey × Sahiwal crossbred cows, while evaporation was signifi cantly (P<0.05) correlated × Sahiwal crossbred cows, while evaporation was signifi cantly (P<0.05) correlated with glucose in Jersey × Sahiwal crossbred cows. A negative correlation was observed with glucose in Jersey × Sahiwal crossbred cows. A negative correlation was observed between wind velocity and glucose in three groups of experimental animals. Sunshine between wind velocity and glucose in three groups of experimental animals. Sunshine was signifi cantly (P<0.05) correlated with glucose in Sahiwal heifers and Sahiwal cows, was signifi cantly (P<0.05) correlated with glucose in Sahiwal heifers and Sahiwal cows, whereas a highly signifi cant (P<0.01) correlation was found in Jersey × Sahiwal crossbred whereas a highly signifi cant (P<0.01) correlation was found in Jersey × Sahiwal crossbred cows (Table 4).
The correlation coeffi cient of the Temperature Humidity Index was highly signifi cant The correlation coeffi cient of the Temperature Humidity Index was highly signifi cant (P<0.01) with serum urea in Sahiwal heifers and cows, whereas a signifi cant (P<0.05) (P<0.01) with serum urea in Sahiwal heifers and cows, whereas a signifi cant (P<0.05) correlation was observed in Jersey × Sahiwal crossbred cows. The relative humidity and correlation was observed in Jersey × Sahiwal crossbred cows. The relative humidity and evaporation were not signifi cantly correlated with serum urea in Sahiwal heifers, Sahiwal evaporation were not signifi cantly correlated with serum urea in Sahiwal heifers, Sahiwal cows and Jersey × Sahiwal crossbred cows. The correlation coeffi cient of average cows and Jersey × Sahiwal crossbred cows. The correlation coeffi cient of average temperature was highly signifi cant (P<0.01) with serum urea in Sahiwal heifers and cows, temperature was highly signifi cant (P<0.01) with serum urea in Sahiwal heifers and cows, whereas a signifi cant (P<0.05) correlation was observed in Jersey × Sahiwal crossbred whereas a signifi cant (P<0.05) correlation was observed in Jersey × Sahiwal crossbred cows. A negative correlation was observed between wind velocity and serum urea of all cows. A negative correlation was observed between wind velocity and serum urea of all three groups of experimental animals. Sunshine was signifi cantly (P<0.05) correlated three groups of experimental animals. Sunshine was signifi cantly (P<0.05) correlated with serum urea in Sahiwal heifers and cows and a highly signifi cant (P<0.01) correlation with serum urea in Sahiwal heifers and cows and a highly signifi cant (P<0.01) correlation was observed in Jersey × Sahiwal crossbred cows (Table 4).
was observed in Jersey × Sahiwal crossbred cows (Table 4).
The correlation coeffi cients of creatinine, calcium and phosphorus in Sahiwal The correlation coeffi cients of creatinine, calcium and phosphorus in Sahiwal heifers, Sahiwal cows and Jersey × Sahiwal crossbred cows are presented in Table 5. heifers, Sahiwal cows and Jersey × Sahiwal crossbred cows are presented in Table 5. The Temperature Humidity Index was signifi cantly (P<0.05) correlated with serum The Temperature Humidity Index was signifi cantly (P<0.05) correlated with serum creatinine in Sahiwal heifers and cows and a highly signifi cant (P<0.01) correlation was creatinine in Sahiwal heifers and cows and a highly signifi cant (P<0.01) correlation was observed in Jersey × Sahiwal crossbred cows. The relative humidity and evaporation observed in Jersey × Sahiwal crossbred cows. The relative humidity and evaporation were not signifi cantly correlated with the serum creatinine of Sahiwal heifers, Sahiwal were not signifi cantly correlated with the serum creatinine of Sahiwal heifers, Sahiwal cows and Jersey × Sahiwal crossbred cows. The average temperature was signifi cantly cows and Jersey × Sahiwal crossbred cows. The average temperature was signifi cantly (P<0.05) correlated with creatinine in Sahiwal cows and Jersey × Sahiwal crossbred (P<0.05) correlated with creatinine in Sahiwal cows and Jersey × Sahiwal crossbred cows. A negative correlation was observed between wind velocity and creatinine in all cows. A negative correlation was observed between wind velocity and creatinine in all three groups of experimental animals. Sunshine was signifi cantly (P<0.05) correlated three groups of experimental animals. Sunshine was signifi cantly (P<0.05) correlated with serum creatinine in Jersey × Sahiwal crossbred cows.
with serum creatinine in Jersey × Sahiwal crossbred cows.
The Temperature Humidity Index was signifi cantly (P<0.05) correlated with serum The Temperature Humidity Index was signifi cantly (P<0.05) correlated with serum calcium in Sahiwal heifers and cows and a highly signifi cant (P<0.01) correlation was calcium in Sahiwal heifers and cows and a highly signifi cant (P<0.01) correlation was observed in Jersey × Sahiwal crossbred cows. The relative humidity and evaporation observed in Jersey × Sahiwal crossbred cows. The relative humidity and evaporation were not signifi cantly correlated with serum calcium of Sahiwal heifers, Sahiwal cows were not signifi cantly correlated with serum calcium of Sahiwal heifers, Sahiwal cows and Jersey × Sahiwal crossbred cows. The average temperature was signifi cantly (P<0.05) and Jersey × Sahiwal crossbred cows. The average temperature was signifi cantly (P<0.05) correlated with serum calcium in all three experimental groups. A negative correlation was correlated with serum calcium in all three experimental groups. A negative correlation was observed between wind velocity and serum calcium in all three groups of experimental observed between wind velocity and serum calcium in all three groups of experimental animals. Sunshine was signifi cantly (P<0.05) correlated with serum calcium in Jersey × animals. Sunshine was signifi cantly (P<0.05) correlated with serum calcium in Jersey × Sahiwal crossbred cows (Table 5).
Sahiwal crossbred cows (Table 5).
The Temperature Humidity Index was signifi cantly (P<0.05) correlated with serum The Temperature Humidity Index was signifi cantly (P<0.05) correlated with serum phosphorus in Sahiwal heifers and cows and a highly signifi cant (P<0.01) correlation phosphorus in Sahiwal heifers and cows and a highly signifi cant (P<0.01) correlation was observed in Jersey × Sahiwal crossbred cows. The relative humidity and evaporation was observed in Jersey × Sahiwal crossbred cows. The relative humidity and evaporation were not signifi cantly correlated with serum phosphorus in Sahiwal heifers, Sahiwal were not signifi cantly correlated with serum phosphorus in Sahiwal heifers, Sahiwal cows and Jersey × Sahiwal crossbred cows. The average temperature was signifi cantly cows and Jersey × Sahiwal crossbred cows. The average temperature was signifi cantly (P<0.05) correlated with serum phosphorus levels in Jersey × Sahiwal crossbred cows. (P<0.05) correlated with serum phosphorus levels in Jersey × Sahiwal crossbred cows. A negative correlation was observed between wind velocity and serum phosphorus in all A negative correlation was observed between wind velocity and serum phosphorus in all
three groups of experimental animals. Sunshine was signifi cantly (P<0.05) correlated three groups of experimental animals. Sunshine was signifi cantly (P<0.05) correlated with serum phosphorus levels in Jersey × Sahiwal crossbred cows (Table 5).
with serum phosphorus levels in Jersey × Sahiwal crossbred cows (Table 5). Discussion
Discussion
Haematocrit values (PCV).
Haematocrit values (PCV). In hot climates when animals are exposed to high ambient In hot climates when animals are exposed to high ambient temperatures, haemo-concentrations will be developed due to dehydration, asphyxia or temperatures, haemo-concentrations will be developed due to dehydration, asphyxia or excitement, causing the release of erythrocytes concentrated in the spleen which can excitement, causing the release of erythrocytes concentrated in the spleen which can result in abnormally higher PCV levels (
result in abnormally higher PCV levels (REECE, 2005REECE, 2005).).
The haematocrit values (L/L) of Sahiwal heifers and Sahiwal cows, which were The haematocrit values (L/L) of Sahiwal heifers and Sahiwal cows, which were higher during the fi rst three days of the present study, might be due to the difference higher during the fi rst three days of the present study, might be due to the difference in the ambient temperature they were exposed to during the transit period and the new in the ambient temperature they were exposed to during the transit period and the new environment. The present fi ndings are in agreement with the reports of
environment. The present fi ndings are in agreement with the reports of SINGH SINGH andand SINGH SINGH (2005)
(2005) in Sahiwal heifers, in Sahiwal heifers, SINGH SINGH andand UPADHYAY (1997) UPADHYAY (1997) and and LEE LEE et al.et al. (1978) (1978) who reported who reported breed, nutritional and species differences in haematocrit levels. In the case of Jersey × breed, nutritional and species differences in haematocrit levels. In the case of Jersey × Sahiwal cows, the PCV values were higher for a longer period, which indicated that the Sahiwal cows, the PCV values were higher for a longer period, which indicated that the crossbred cows have less heat tolerant capacity, and hence higher PCV were observed for crossbred cows have less heat tolerant capacity, and hence higher PCV were observed for longer periods than in the Sahiwal breed. Similar results were reported by
longer periods than in the Sahiwal breed. Similar results were reported by SIVARAMAN SIVARAMAN et al.
et al. (2003)(2003) in Jersey crossbred cows, in Jersey crossbred cows, SINGH SINGH and and SINGH (2005)SINGH (2005) in Karan Fries heifers, in Karan Fries heifers,
NARAYAN
NARAYAN et al. et al. (2007)(2007) in Frieswal cows and in Frieswal cows and PRAVA PRAVA and and DIXIT (2008)DIXIT (2008) in Frieswal cows. in Frieswal cows. The signifi cant (P<0.01) variation of PCV values between Sahiwal cows and Jersey × The signifi cant (P<0.01) variation of PCV values between Sahiwal cows and Jersey × Sahiwal cows might be due to the heat induced reduction in the animals’ metabolic rate Sahiwal cows might be due to the heat induced reduction in the animals’ metabolic rate ((NOUTY NOUTY et al.,et al., 1986 1986). ).
During thermal stress, the animals suffer from dehydration, and as a result the extra During thermal stress, the animals suffer from dehydration, and as a result the extra cellular fl uid volume will be reduced, causing haemoconcentration of the blood. Hence cellular fl uid volume will be reduced, causing haemoconcentration of the blood. Hence an ample supply of clean drinking water and administration of electrolytes would rectify an ample supply of clean drinking water and administration of electrolytes would rectify the haemoconcentration, thus alleviating the heat stress of the animals.
the haemoconcentration, thus alleviating the heat stress of the animals. Glucose.
Glucose. The blood glucose levels of the Sahiwal heifers and Sahiwal cows were The blood glucose levels of the Sahiwal heifers and Sahiwal cows were higher during the fi rst three days of adaptability, which indicated that the increased higher during the fi rst three days of adaptability, which indicated that the increased energy demand associated with increased respiration rate, along with a possible decrease energy demand associated with increased respiration rate, along with a possible decrease in feed intake, might have caused some mobilization of body fat reserves to increase the in feed intake, might have caused some mobilization of body fat reserves to increase the plasma glucose levels, which is in agreement with the fi ndings of
plasma glucose levels, which is in agreement with the fi ndings of SRIKANDAKUMAR SRIKANDAKUMAR and
and JOHNSON (2004) JOHNSON (2004) in Australian Milking Zebu (AMZ) cows. The rise in glucose levels in Australian Milking Zebu (AMZ) cows. The rise in glucose levels might also be attributed to compensatory metabolic stress due to changing temperature might also be attributed to compensatory metabolic stress due to changing temperature and humidity, and energy loss, also reported by
and humidity, and energy loss, also reported by KULKARNI KULKARNI et al.et al. (2010) (2010) in Deccani sheep. in Deccani sheep.
SINGH
SINGH andand SINGH (2005) SINGH (2005) reported similar results in Sahiwal heifers. reported similar results in Sahiwal heifers.
In the case of Jersey × Sahiwal cows, the blood glucose levels were higher for a period In the case of Jersey × Sahiwal cows, the blood glucose levels were higher for a period of six days, which might be attributed to the breed difference.
of six days, which might be attributed to the breed difference. SINGH SINGH andand UPADHYAY UPADHYAY (1997)
have higher energy demand, which results in higher glucose levels than those of the have higher energy demand, which results in higher glucose levels than those of the Sahiwal breed. However, the blood glucose levels reported by
Sahiwal breed. However, the blood glucose levels reported by NOUTY NOUTY et alet al.. (1986) (1986) in in
Holstein Friesian cows, by
Holstein Friesian cows, by NATH (2006)NATH (2006) in Jersey crossbred calves and in Jersey crossbred calves and GADARIYA GADARIYA et al. et al. (2008)
(2008) in bullocks are in contrast to the present in bullocks are in contrast to the present fifi ndings. ndings. SIVARAMAN SIVARAMAN et al. et al. (2002A)(2002A) also also reported lower glucose levels in Jersey crossbred cows, which might be due to the stress reported lower glucose levels in Jersey crossbred cows, which might be due to the stress of lactation and simultaneous pregnancy, and the fact that the cows were not getting of lactation and simultaneous pregnancy, and the fact that the cows were not getting suffi cient energy through diet would have refl ected badly in the reduction in blood glucose suffi cient energy through diet would have refl ected badly in the reduction in blood glucose in lactating cows. The signifi cant (P<0.01) differences in the glucose levels of Sahiwal in lactating cows. The signifi cant (P<0.01) differences in the glucose levels of Sahiwal heifers, Sahiwal cows and Jersey × Sahiwal cows might be due to the breed differences heifers, Sahiwal cows and Jersey × Sahiwal cows might be due to the breed differences ((GUPTAGUPTA et al et al., 1992; SINGH ., 1992; SINGH andand UPADHYAY, 1996 UPADHYAY, 1996) and more feed intake () and more feed intake (GANGWAR, GANGWAR, 1985
1985) by the animals. ) by the animals.
To keep the cows at positive energy levels during pregnancy and lactation, they can To keep the cows at positive energy levels during pregnancy and lactation, they can be administered glucocorticoids for glucose induction.
be administered glucocorticoids for glucose induction. Urea.
Urea. Exposure of cows to moderate heat stress caused higher utilization of Exposure of cows to moderate heat stress caused higher utilization of aminoacids as an energy source, with increased urea levels or mobilization of protein aminoacids as an energy source, with increased urea levels or mobilization of protein from muscle mass (
from muscle mass (FEKRY FEKRY et al., 1989et al., 1989))
In the present investigation, the mean blood urea levels of Sahiwal heifers and In the present investigation, the mean blood urea levels of Sahiwal heifers and Sahiwal cows were higher in the fi rst three days, which might be due to the differences Sahiwal cows were higher in the fi rst three days, which might be due to the differences in protein metabolism or renal excretion of BUN in the animals, as BUN is the main end in protein metabolism or renal excretion of BUN in the animals, as BUN is the main end product of protein metabolism. The present fi ndings are in agreement with those reported product of protein metabolism. The present fi ndings are in agreement with those reported by
by KULKARNI KULKARNI et al.et al. (2010) (2010) in Deccani sheep. in Deccani sheep.
The blood urea levels of Jersey × Sahiwal cows were higher for the fi rst six days, The blood urea levels of Jersey × Sahiwal cows were higher for the fi rst six days, which is in conformity with the values reported by
which is in conformity with the values reported by KULKARNI KULKARNI andand TALVELKAR TALVELKAR (1993)
(1993), , NATH (2006) NATH (2006) and and SIVARAMANSIVARAMAN et al et al.. (2002B)(2002B) in different crossbreds. However, in different crossbreds. However, SRIKANDAKUMAR
SRIKANDAKUMAR and and JOHNSON (2004)JOHNSON (2004) reported lower BUN levels in Jersey and AMZ reported lower BUN levels in Jersey and AMZ cattle in hot environments. The signifi cant (P<0.01) variations in BUN levels in Sahiwal cattle in hot environments. The signifi cant (P<0.01) variations in BUN levels in Sahiwal heifers, Sahiwal cows and Jersey × Sahiwal cows might be attributed to change of forage heifers, Sahiwal cows and Jersey × Sahiwal cows might be attributed to change of forage / feed to the animals and mainly environmental conditions. The higher BUN levels / feed to the animals and mainly environmental conditions. The higher BUN levels recorded in the present study might be due to increased utilization of aminoacids through recorded in the present study might be due to increased utilization of aminoacids through mobilization of protein from muscles during thermal stress.
mobilization of protein from muscles during thermal stress. Creatinine.
Creatinine. In hot environments, thermal stress is known to cause peripheral In hot environments, thermal stress is known to cause peripheral vasodilatation, to allow loss of body heat through sweating, and it can therefore reduce vasodilatation, to allow loss of body heat through sweating, and it can therefore reduce the blood fl ow to the internal organs. In addition, dehydration can also result in reduced the blood fl ow to the internal organs. In addition, dehydration can also result in reduced blood fl ow to the kidneys. As a result of heat stress, the kidneys are unable to perform blood fl ow to the kidneys. As a result of heat stress, the kidneys are unable to perform their normal function. The rate of excretion of creatinine is infl uenced by the glomerular their normal function. The rate of excretion of creatinine is infl uenced by the glomerular
fi ltration rate and creatinine is eliminated more easily than urea (
fi ltration rate and creatinine is eliminated more easily than urea (GUYTON GUYTON andand HALL, HALL, 1996
1996). The same was re). The same was reflfl ected in the elevated serum creatinine levels of the Sahiwal ected in the elevated serum creatinine levels of the Sahiwal heifers and Sahiwal cows for the fi rst three days. These results are in agreement with heifers and Sahiwal cows for the fi rst three days. These results are in agreement with
the fi ndings of
the fi ndings of SRIKANDAKUMARSRIKANDAKUMAR and and JOHNSON (2004)JOHNSON (2004), who reported that in Jersey , who reported that in Jersey and AMZ cows, the serum creatinine levels were higher for a period of six days, which and AMZ cows, the serum creatinine levels were higher for a period of six days, which is also marginally higher than that observed by
is also marginally higher than that observed by NATH (2006) NATH (2006) in Jersey crossbred calves, in Jersey crossbred calves,
KULKARNI
KULKARNI et al. et al. (2010)(2010) and and KULKARNI KULKARNI andand TALVELKAR (1993) TALVELKAR (1993) in Jersey crossbred cows, in Jersey crossbred cows,
GADARIYA
GADARIYA et al.et al. (2008) (2008) and and UPADHYAY UPADHYAY and and MADAN (1985)MADAN (1985) in bullocks. The signi in bullocks. The signififi cant cant (P<0.01) variations in serum creatinine of Jersey × Sahiwal cows when compared to (P<0.01) variations in serum creatinine of Jersey × Sahiwal cows when compared to Sahiwal cows might be attributed to the lower heat tolerant capacity of the crossbred Sahiwal cows might be attributed to the lower heat tolerant capacity of the crossbred cows resulting in slower elimination of serum creatinine from the body.
cows resulting in slower elimination of serum creatinine from the body. Calcium.
Calcium. The serum calcium level is controlled by the parathyroid hormone, which The serum calcium level is controlled by the parathyroid hormone, which acts on bones and kidneys to keep calcium levels constant. The parathyroid gland monitors acts on bones and kidneys to keep calcium levels constant. The parathyroid gland monitors the blood calcium concentrations in the carotid artery and secretes the parathyroid the blood calcium concentrations in the carotid artery and secretes the parathyroid hormone, which immediately increases the renal calcium reabsorption mechanism, hormone, which immediately increases the renal calcium reabsorption mechanism, resulting in decreased urinary calcium loss (
resulting in decreased urinary calcium loss (REECE, 2005REECE, 2005). This fact was amply re). This fact was amply reflfl ected ected in the elevated serum calcium levels in the Sahiwal heifers and Sahiwal cows observed in the elevated serum calcium levels in the Sahiwal heifers and Sahiwal cows observed in the present study during the fi rst three days. The study results are in agreement with in the present study during the fi rst three days. The study results are in agreement with those reported by
those reported by HAQUE HAQUE andand VERMA (1990) VERMA (1990) in Sahiwal cows. The higher calcium levels in Sahiwal cows. The higher calcium levels in the present study might be due to excessive secretion of parathyroid hormone in a hot in the present study might be due to excessive secretion of parathyroid hormone in a hot environment.
environment.
In Jersey × Sahiwal crossbred cows, the signifi cantly (P<0.01) higher serum calcium In Jersey × Sahiwal crossbred cows, the signifi cantly (P<0.01) higher serum calcium levels observed for the period of six days are in consonance with those values reported by levels observed for the period of six days are in consonance with those values reported by
PRAVA
PRAVA andand DIXIT (2006) DIXIT (2006) in Frieswal pregnant and dry cows, in Frieswal pregnant and dry cows, SIVARAMAN SIVARAMAN et al.et al. (2002B) (2002B) in Jersey crossbred cows and
in Jersey crossbred cows and AGGARWAL AGGARWAL et alet al. (2008). (2008) in Karan Fries cows. However, in Karan Fries cows. However, lower serum calcium levels were reported by
lower serum calcium levels were reported by NATH (2006) NATH (2006) in Jersey crossbred cows and in Jersey crossbred cows and
RANDHAWA
RANDHAWA et al.et al. (2006) (2006) in Frieswal cows. in Frieswal cows.
Although a non-signifi cant difference was observed in serum calcium levels between Although a non-signifi cant difference was observed in serum calcium levels between Sahiwal heifers and Sahiwal cows, the signifi cant (P<0.01) variation of the same Sahiwal heifers and Sahiwal cows, the signifi cant (P<0.01) variation of the same constituent observed in Jersey × Sahiwal crossbred cows when compared to the native constituent observed in Jersey × Sahiwal crossbred cows when compared to the native Sahiwal purebred might be attributed to the lower heat tolerant capacity of the crossbred Sahiwal purebred might be attributed to the lower heat tolerant capacity of the crossbred cows in hot environmental conditions.
cows in hot environmental conditions. Phosphorous.
Phosphorous. Phosphorous is required for synthesis of the proteins and enzymes of Phosphorous is required for synthesis of the proteins and enzymes of the body, and plays an important role in the intermediary metabolism of carbohydrates the body, and plays an important role in the intermediary metabolism of carbohydrates and creatinine in reactions that occur in muscle contractions (
and creatinine in reactions that occur in muscle contractions (SASTRY SASTRY and and RAMA RAO, RAMA RAO, 2009
2009). ).
The higher phosphorous levels in Sahiwal heifers and Sahiwal cows for the fi rst three The higher phosphorous levels in Sahiwal heifers and Sahiwal cows for the fi rst three days might be due to the differences in metabolic activities of carbohydrates during hot days might be due to the differences in metabolic activities of carbohydrates during hot weather conditions. The serum phosphorous values of Jersey × Sahiwal cows were higher weather conditions. The serum phosphorous values of Jersey × Sahiwal cows were higher than the Sahiwal cows during the fi rst six days, indicative of body mechanisms to release than the Sahiwal cows during the fi rst six days, indicative of body mechanisms to release more phosphorous. These results are in agreement with the reports of
al.
al. (2002B) (2002B) in Jersey crossbred cows, in Jersey crossbred cows, KULKARNI KULKARNI andand TALVELKAR (1993) TALVELKAR (1993) in different in different crossbred cows,
crossbred cows, PRAVA PRAVA andand DIXIT (2006) DIXIT (2006) in Frieswal cows and in Frieswal cows and NATH (2006)NATH (2006) in Jersey in Jersey
crossbred cows. However, lower values were reported by
crossbred cows. However, lower values were reported by RANDHAWA RANDHAWA et al.et al. (2006)(2006) in in
Frieswal cows. Frieswal cows.
Although a non-signifi cant difference was observed in serum phosphorous levels Although a non-signifi cant difference was observed in serum phosphorous levels between Sahiwal heifers and Sahiwal cows, a signifi cant (P<0.01) variation of the same between Sahiwal heifers and Sahiwal cows, a signifi cant (P<0.01) variation of the same constituent in Jersey × Sahiwal cows was recorded. This might be due to heat stress constituent in Jersey × Sahiwal cows was recorded. This might be due to heat stress leading to muscular contractions, resulting in a disturbance in carbohydrate metabolism leading to muscular contractions, resulting in a disturbance in carbohydrate metabolism and higher phosphorous levels in the serum.
and higher phosphorous levels in the serum. Conclusions
Conclusions
The haematocrit, glucose, urea, creatinine, calcium, phosphorous levels of the The haematocrit, glucose, urea, creatinine, calcium, phosphorous levels of the Sahiwal cows were signifi cantly (P<0.01) higher during the fi rst three days, and later Sahiwal cows were signifi cantly (P<0.01) higher during the fi rst three days, and later declined to the normal range of the species. In the case of Jersey × Sahiwal crossbred declined to the normal range of the species. In the case of Jersey × Sahiwal crossbred cows, higher levels of haematocrit and the above serum constituents were observed for cows, higher levels of haematocrit and the above serum constituents were observed for a period of six days, which later declined to reach the normal range of the species in a period of six days, which later declined to reach the normal range of the species in tropical environments. During thermal stress, animals suffer from dehydration, and as tropical environments. During thermal stress, animals suffer from dehydration, and as a result the extra cellular fl uid volume will be reduced, causing haemo-concentration a result the extra cellular fl uid volume will be reduced, causing haemo-concentration of the blood, increased energy demand associated with elevated respiration rate, along of the blood, increased energy demand associated with elevated respiration rate, along with a possible decrease in feed intake, which might have caused some mobilization of with a possible decrease in feed intake, which might have caused some mobilization of body fat reserves to increase the plasma glucose levels. Tropical environmental stress also body fat reserves to increase the plasma glucose levels. Tropical environmental stress also caused increased utilization of aminoacids through mobilization of protein from muscles, caused increased utilization of aminoacids through mobilization of protein from muscles, and slower elimination of creatinine. Hot environments lead to excessive secretion of and slower elimination of creatinine. Hot environments lead to excessive secretion of the parathyroid hormone, resulting in higher calcium levels and muscular contractions the parathyroid hormone, resulting in higher calcium levels and muscular contractions (disturbance in carbohydrate metabolism), resulting from higher phosphorus levels in the (disturbance in carbohydrate metabolism), resulting from higher phosphorus levels in the serum.
serum.
Hence, it is suggested that an ample supply of clean drinking water, administration of Hence, it is suggested that an ample supply of clean drinking water, administration of electrolytes and providing protein rich diets to the animals, along with good quality forage electrolytes and providing protein rich diets to the animals, along with good quality forage would rectify the haemo-concentrations, thus alleviating the heat stress of the animals. would rectify the haemo-concentrations, thus alleviating the heat stress of the animals. _______
_______
Acknowledgements Acknowledgements
We gratefully acknowledge the Rashtriya Krishi Vikas Yojana project of Sri Venkateswara Veterinary University, We gratefully acknowledge the Rashtriya Krishi Vikas Yojana project of Sri Venkateswara Veterinary University,
Tirupati for fi nancial and logistic support. We also thank the staff of RARS who provided the meteorological
Tirupati for fi nancial and logistic support. We also thank the staff of RARS who provided the meteorological
data during the study period. The Government of India is acknowledged for providing funds for conducting the data during the study period. The Government of India is acknowledged for providing funds for conducting the research work.
References References
AGARWAL, A., M. SINGH, R. C. CHOPRA (2008): Minerals in milk and plasma of cows during AGARWAL, A., M. SINGH, R. C. CHOPRA (2008): Minerals in milk and plasma of cows during early lactation provided with mister and fan cooling during hot-dry season. Ind. J. Dairy Sci. early lactation provided with mister and fan cooling during hot-dry season. Ind. J. Dairy Sci. 61, 88-89.
61, 88-89.
BIANCA, W. (1962): Relative importance of dry bulb and wet bulb temperatures in causing heat BIANCA, W. (1962): Relative importance of dry bulb and wet bulb temperatures in causing heat
stress in cattle. Nature 195, 251-252. stress in cattle. Nature 195, 251-252.
FEKRY, A. E., A. F. ABDELAA, M. K. SHEBAITA, M. A. I. SALEM (1989): Is creatinine a good FEKRY, A. E., A. F. ABDELAA, M. K. SHEBAITA, M. A. I. SALEM (1989): Is creatinine a good
indicator for meat production in fat tailed sheep. EAAP publication 38, 150-152. indicator for meat production in fat tailed sheep. EAAP publication 38, 150-152.
GADARIYA, M. R., A. M. PATEL, A. J. DHAMI (2008): Infl uence of work stress on certain blood GADARIYA, M. R., A. M. PATEL, A. J. DHAMI (2008): Infl uence of work stress on certain blood constituents of bullocks subjected to cart loads and ploughing under comfort and stressful constituents of bullocks subjected to cart loads and ploughing under comfort and stressful climatic conditions. Ind. J. Dairy Sci. 61, 66-69.
climatic conditions. Ind. J. Dairy Sci. 61, 66-69.
GANGWAR, P. C. (1985): Importance of photoperiod and wallowing in buffalo production. Ind. J. GANGWAR, P. C. (1985): Importance of photoperiod and wallowing in buffalo production. Ind. J.
Dairy Sci. 38, 150-155. Dairy Sci. 38, 150-155.
GUPTA, A., M. V. N. RAO, R. C. UPADHYAY (1992): Effect of different speeds and ingredients GUPTA, A., M. V. N. RAO, R. C. UPADHYAY (1992): Effect of different speeds and ingredients
up on blood constituents in crossbred males. Ind. J. Dairy Sci. 52, 121-124. up on blood constituents in crossbred males. Ind. J. Dairy Sci. 52, 121-124. GUYTON, A. C., J. E. HALL (1996): Text Book of Medical Physiology, 9
GUYTON, A. C., J. E. HALL (1996): Text Book of Medical Physiology, 9thth edn., Philadelphia, edn., Philadelphia,
W.B. Saunders Company. W.B. Saunders Company.
HAHN, G. L. (1999): Dynamic response of cattle to thermal heat loads. J. Anim. Sci. 77, 10-21. HAHN, G. L. (1999): Dynamic response of cattle to thermal heat loads. J. Anim. Sci. 77, 10-21. HAQUE, S., B. B. VERMA (1990): Effect of age and season on levels of inorganic phosphorous, HAQUE, S., B. B. VERMA (1990): Effect of age and season on levels of inorganic phosphorous,
calcium and magnesium in blood of crossbred cattle. Ind. J. Anim. Sci. 60, 570-571. calcium and magnesium in blood of crossbred cattle. Ind. J. Anim. Sci. 60, 570-571. JAIN, N. C. (1986): Schalms Veterinary Haematology 4
JAIN, N. C. (1986): Schalms Veterinary Haematology 4thth ed. Lea and Febiger, Philadelphia, USA. ed. Lea and Febiger, Philadelphia, USA.
p. 236 p. 236
KULKARNI, B. A., B. A. TALVELKAR (1993): Blood metabolic profi le in crossbred lactating KULKARNI, B. A., B. A. TALVELKAR (1993): Blood metabolic profi le in crossbred lactating
cows. Ind. J. Anim. Sci. 63, 716-719. cows. Ind. J. Anim. Sci. 63, 716-719.
KULKARNI, S. S., N. Z. GAIKWAD, S. T. BAPAT (2010): Effect of summer season on certain KULKARNI, S. S., N. Z. GAIKWAD, S. T. BAPAT (2010): Effect of summer season on certain
biochemical parameters in Deccani sheep. Ind. Vet. J. 87, 729-730. biochemical parameters in Deccani sheep. Ind. Vet. J. 87, 729-730.
LEE, J. A., J. D. ROUSSEL, J. F. BEATTY (1978): Effect of temperature and season on adrenal LEE, J. A., J. D. ROUSSEL, J. F. BEATTY (1978): Effect of temperature and season on adrenal
cortical function, blood cell profi le and milk production. J. Dairy Sci. 59, 104-108. cortical function, blood cell profi le and milk production. J. Dairy Sci. 59, 104-108.
NARAYAN, U., D. V. SINGH, R. J. SHARMA (2007): Physiological responses in NARAYAN, U., D. V. SINGH, R. J. SHARMA (2007): Physiological responses in Holstein-Friesian crossbred lactating cows under heat stress ameliorating treatments. Ind. J. Anim. Res. Friesian crossbred lactating cows under heat stress ameliorating treatments. Ind. J. Anim. Res. 41, 130-133.
41, 130-133.
NATH, R. (2006): Seasonal variation of blood biochemical parameters in crossbred calves. Ind. NATH, R. (2006): Seasonal variation of blood biochemical parameters in crossbred calves. Ind.
Vet. J. 87, 800-801. Vet. J. 87, 800-801.
NOUTY, F. D. E. L., G. A. HASSAN, M. H. SALEM (1986): Effect of season and level of NOUTY, F. D. E. L., G. A. HASSAN, M. H. SALEM (1986): Effect of season and level of
production on haematological values in Holstein cows. Ind. J. Anim. Sci. 56, 346-350. production on haematological values in Holstein cows. Ind. J. Anim. Sci. 56, 346-350. OMINSKI, K. H., A. D. KENNEDY, K. M. WITTENBERG, S. A. MOSHTAGHI-NIA (2002): OMINSKI, K. H., A. D. KENNEDY, K. M. WITTENBERG, S. A. MOSHTAGHI-NIA (2002): Physiological and production responses to feeding schedule in lactating cows exposed to short Physiological and production responses to feeding schedule in lactating cows exposed to short term heat stress. J. Dairy Sci. 85, 730-737