CHAPTER III RESEARCH METHOD
In this chapter, the writer discussed about research design, population and
sample, research instruments, data collection procedure, and data analysis
procedure.
A. Research Design
The design of the study was an experimental design because the writer
measures the effect of using outline technique to the student writing ability. An
experimental design is the general plan for carrying out a study with an active
independent variable. The design is important because it determines the study’s
internal validity, which is the ability to reach valid conclusions about the effect of
the experimental treatment on the dependent variable.1
This study was conduct with experimental design using pretest and
posttest design. Pretest and posttest design usually involves three steps: (1)
administering a pretest measuring the dependent variable; (2) applying the
experimental treatment X to the subjects; and (3) administering a posttest
measuring the dependent variable.2 Differences attributed to application of the
experimental treatment are then evaluated by comparing the pretest and posttest
scores.
1
Ibid., p. 301.
Table 3.1
The schema of One-Group Pretest-Posttest Design
Pretest Independent Posttest
Y1 X Y2
In the present study, there is a single group. A single group divided into
two groups. They are experiment group and control group. The experiment group
gets treatment meanwhile the control group is not given by treatment. It is using
outline technique and non outline technique. Furthermore, the groups will be
given posttest. Next, the results of posttest were compared by using T test
formula.
B. Population and Sample 1. Population
Population is the whole of the research subject.3 In the present study, the
population of the study is all of the Eleventh grade students of SMAN-4 Palangka
Raya 2014/2015 academic year. The number of population is 389 students. Based
on the documentation of SMAN-4 Palangka raya, the numbers of population of
students are shown in the table below.
Tabel 3.2
Number of Population of the SMAN-4 Palangka Raya
No. Classes Number
1. XI-IIA 1 40
2. XI-IIA 2 41
3. XI-IIA 3 40
3
4. XI-IIA 4 38
5 XI-IIA 5 31
6. XI-IIS 1 39
7. XI-IIS 2 32
8. XI-IIS 3 33
9. XI-IIS 4 30
10 XI-IIS 5 29
11. XI-IBBU 11 36
The Total Number 389
2. Sample
Sample is half or representative of population to be researched.4The writer
used non probabilty samples as sample of this study. Purposive sampling is a
nonprobability sampling technique in which subjects judged to be representative
of the population are included in the sample.5 In the present study, the writer
chose XI IIS 5 class as sample of the study. The number of XI IIS 5 class is 29
students as the experiment group and control group.
C. Research Instruments 1. Research Instruments
Instrument is a device for operationally defining a variable.6 Instrument is
very needed in the research. Instrument is tool to get the data of the study, in
which the data is the important thing to help the writer in answering the problem
of study and also to prove the hypotheses. In the present study, the writer used test
as instrument of the study. The type of the test will use to collect the data is in the
form of writing test, especially analytical exposition writing test using and without
4Ibid
., p. 109.
5
Donald Ary, Lucy Cheser Jacobs, Chris Sorensen, Asghar Razavieh, Introduction to Research in Education (eight edition), p. 648.
6
using outline technique. The test consists of the instructions and statement the
subjects addressed in their writing and the alternative topics to be chosen. In the
case, the students are assigned to choose one of topics that interest. They will ask
to develop the topic into a text containing about 100-150 words. The allocated
time to do each writing test is 90 minutes.
2. Research Instruments Try Out
The writer conducted the different class as try out class. The try out test
conducted at XI IIA 5 with 31 students. The result was valid, it meant that the test
item as the instrumentation of this study was suitable to be given. The procedures
of the try out are:
1. The writer gave a test trough try out of test items to students.
2. The writer collectedthe students’ answer and give them scores.
3. The writer analyzed the students’score to find out instrument reliability and
validity.
3. Research Instruments Validity
Validity is the extend to which it measures what it is supposed to measure
and nothing else.7 Validity is always concerned with the specific use to be made
of the results and with the truthfulness of our proposed interpretations.8There are
three types of validity: face validity, content validity, and construct validity.9
7
J.B Heaton,Writing English Language Tests, London: Longman, 1975, p. 153.
8
Norman E. Grounlund,Measurement and Evaluation in Teaching, New York: Macmillan publishing Company, 1985, p. 11.
9
a. Face Validity
Face validity is if a test item looks right to other testers, teachers,
moderators, and testees.10 Face validity refers to the extent to which examinees
believe the instrument is measuring what it is supposed to measure.11Although it
is not a technical form of validity, face validity can be important to ensure
acceptance of the best and cooperation on the part of the examinees.
b. Content Validity
Content validity is the kind of validity depends on a careful analysis of the
language being tested and of the particular course objectives.12The test should be
so constructed as to contain a representative sample of the course, the relationship
between the test items and the course objectives always being apparent.
c. Construct Validity
Contruct validity is if a test has construct validity, it is capable of measuring
certain specific characteristics in accordance with a theory of language behavior
and learning.13 This type of validity assumes the existence of certain learning
theories or contructs underlying the acquisition of abilities and skills.
To measure the validity of the instrument, the writer used the formulation of
Product Moment by Pearson as follow:14
rxy = (∑ ) (∑ ) . (∑ )
{ . ∑ ( ∑ ) } . { . ∑ (∑ ) }
10 Ibid.
11
Donald Ary, Lucy Cheser Jacobs, Chris Sorensen, Asghar Razavieh, Introduction to Research in Education (eight edition), p. 228.
12
J.B Heaton,Writing English Language Tests, p. 154.
13 Ibid.
14
Where:
rxy = Total coeficient of correlation
N = Number of Cases/Students
∑XY = Multiplication Result between score X and Y
∑X = Total Value of Score X
∑Y = Total Value of Score Y.
Furthermore, it will calculate using t test formula as follow:
tobserve = √
√
Where:
t = The value of tobserve
r = The coefficient robserve
n = Number of students
The distribution of ttableat alpha 5% and the degree of freedom (n-2) with
the measurements of validity using the criteria below:15
To know the validity level of the instrument, the result of the test will
interpret to the criteria as follow:
0,00–0,200 = Very poor validity
0,200–0,400 = Poor validity
0,400–0,700 = Fair validity
15
Riduan,Metode dan Teknik Menyusun Tesis,Bandung: Alfabeta, 2010, p. 110.
to> tt = Valid
0,700–0,900 = High validity
0,900–1,000 = Very high validity
4. Research Instruments Reliability
Reliability refers to the consistency of test scores. That is, how consistent
test scores or other evaluation results are from one measurement to another.16
Reliability is a necessary characteristic of any good test: for it to be valid at all, a
test must first be reliable as a measuring instrument.17There are a number of ways
to investigate the reliability or consistency of raters. Two important aspects of
reliability are intra-rater reliability (self-consistency) and inter-rater reliability
(agreement between raters). Intra-rater reliability refers to the tendency of a rater
to give the same score to the same script on different occasions, while inter-rater
reliability refers to the tendency of different raters to give the same scores to the
same scripts.18
To achieve the acceptable score of inter rater reliability, the raters are
trained. First, the researcher explained the purposes of the test and intended used
of the test results to the rater. Then, each point of the criteria used to score is
explained.
After that, the rater got same understanding of criteria, the researcher gave
the rater two composition samples to be rated. The scores of two raters from the
researcher and the rater were correlated to examine whether the scores belong to
acceptable scores or not.
16
Norman E. Grounlund,Measurement and Evaluation in Teaching, p. 14.
17
J.B Heaton,Writing English Language Tests, p. 155.
18
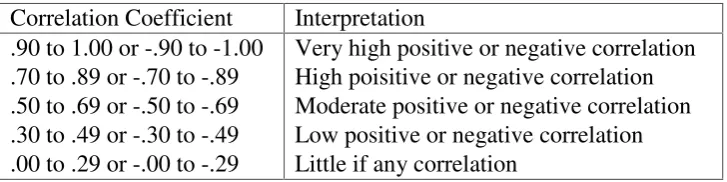
To obtain inter rater reliability, the score of two raters were correlated
using SPSS program used product moment calculation. The researcher got the
interpretation of coefficient correlation, whether they belong to high, moderate, or
positive weak/negative inter rater reliability category. The obtained coefficient
should indicate that the students’ writing products using outline technique has
achieved the acceptable level of reliability. In this case, the researcher will apply
the coefficient correlation and the interpretation of inter rater reliability proposed
by Winkle et al as shown in table: 3.319
Table 3.3. Inter Rater Coefficient Correlation and Interpretation
Correlation Coefficient Interpretation .90 to 1.00 or -.90 to -1.00
.70 to .89 or -.70 to -.89 .50 to .69 or -.50 to -.69 .30 to .49 or -.30 to -.49 .00 to .29 or -.00 to -.29
Very high positive or negative correlation High poisitive or negative correlation Moderate positive or negative correlation Low positive or negative correlation Little if any correlation
D. Data Collection Procedures
The study is aimed at investigating the effectiveness of using outline on
the quality of composition written by experimental group of students. To collect
the data, the writer divided the subject. There is a single subject of the study. A
single subject divided into two groups; they were experiment group and control
group. Control group is taken from the same individuals. Both of groups were
given pretest. Next, the group will be given treatments but the treatment is in
different order: using outline technique and using non outline technique. The
19
different order of treatments functioned to control invalidity. The last, giving
posttest to the groups.
The steps of the data collection procedure as follows:
1. The writer divided a single subject into experiment group one and control
group one.
2. The writer gave pretest to experiment group and control group.
3. The writer gave treatment to the experiment group only.
4. The writer gave posttest to experiment group and control group.
5. The writer gave the scores and analyzed the data using manual calculation and
SPSS program.
E. Data Analysis Procedures
The data of the study are the students’ writing scores. In this case, the data
are in form of quantitative data. The data was analyzed by means of inferential
statistics. In this case, the writer applied t-test for correlated samples to examine
the difference score between the students who use outline technique and those
who do not use outline technique in writing analytical exposition paragraph. The
writer analyzed the data by applying some procedure in the following:
1. Giving the test. Test in the form of a worksheet contains the instruction and
directions to do the test.
2. Collectingthe data of students’ worksheet test result.
3. Givingscore to the sudents’ test result.
4. Tabulating the data into the distribution of the table, then find out the mean,
5. Analyzing the data using T-test. In addition, the SPSS 16.0 program is
applied to compare the data.
6. Interpreting the result of test by using degree of freedom (df).
7. Making discussion to clarify the research finding.
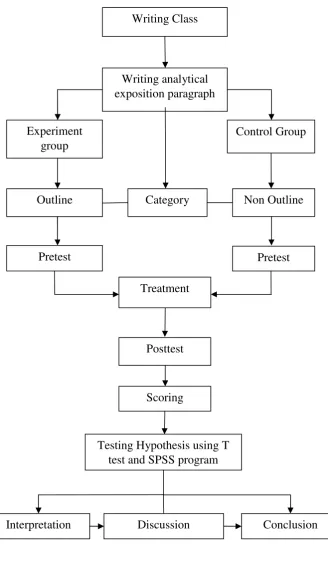
Figure 3.1
Steps of collecting, data analysis procedure and testing hypothesis
Writing Class
Writing analytical exposition paragraph
Experiment group
Control Group
Category
Pretest Pretest
Treatment
Posttest
Scoring
Testing Hypothesis using T test and SPSS program
Interpretation Discussion Conclusion