229
THE IMPACT OF FISCAL POLICY IMPACT ON INCOME INEQUALITY AND
ECONOMIC GROWTH:
A CASE STUDY OF DISTRICT/CITY IN JAVA
Harry Azhar Azis
Chairman of the Financial Supervisory Agency of Indonesia Nisful Laila
Department of Sharia Economics, Faculty of Economics dan Business, Universitas Airlangga
Gigih Prihantono
Department of Economics, Faculty of Economics dan Business, Universitas Airlangga
ABSTRACT
Indonesian government has planned a policy in both accelerating the economic growth and reducing the income inequality. The improvement of income equality in Indonesia is conducted specifically through tax and transfer system. The progressive tax system is conducted to redistribute income and to reduce income inequality (measured by Gini index). The efficiency of a low tax system gave rise to suspicion that the system is not effective for reducing income inequality. This study examines the effect of fiscal policy on income ineaquality and economy growth in Java. To achieve the objective of study, the changes of macroeconomic indicators, tax system efficiency, and the changes of the income distribution is analysed using a panel data regression model. The results showed that the redistribution value of district/city is negative, indicating that the redistribution through taxes is not effective. In practice, the applicable tax system tends to widen the income inequality. The relation between equity income and economic growth show greater influence in the region with high income, whereas in regions with low income, incidence of such influence is very small indeed.
Keywords: Fiscal Policy, Economic Growth, Income Inequality
JEL Classifications: E62
INTRODUCTION
230
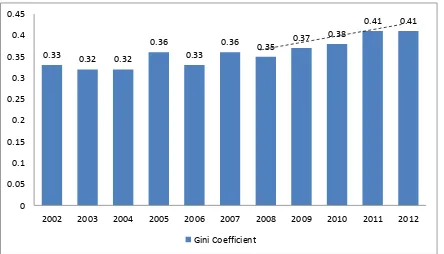
of reducing poverty, it has not been followed by the reduction of income inequality. In fact, Indonesia is considered as one of countries with high levels of inequality (rank 26 in the world) from across the country in the world (Joseph 2006). The ranking is based on the calculation of the Gini Index used to measure income inequality. Based on the data of income distribution during last 10 years, income inequality rose from 0.35 in 2008 to 0.41 in 2012 periods (figure 1).
0.33 0.32 0.32
0.36
0.33
0.36 0.35 0.37
0.38
0.41 0.41
0 0.05 0.1 0.15 0.2 0.25 0.3 0.35 0.4 0.45
2002 2003 2004 2005 2006 2007 2008 2009 2010 2011 2012
Gini Coefficient
Figure 1. Gini Coefficient of Java Island 2002-2012
Source: Central Bureau of Statistics
231 weaken social stability.
Indonesian economic growth continues to increase by an average of the last decade at around 5.8%. This growth is very convincing, as there is no significant negative impact of the economic crisis in the United States and Europe to Indonesia during the Global Financial Crisis. However, BPS (2014) showed that the GDP of Indonesia still dominated by the western region of Indonesia especially the Java Island. Java is the fastest development and has huge potential economy in Indonesia. It is noted that 61% of the national GDP is sourced from Java, dominated by two main sectors namely industry sectors (manufacturing industry) and trades, hotels, and restaurants.
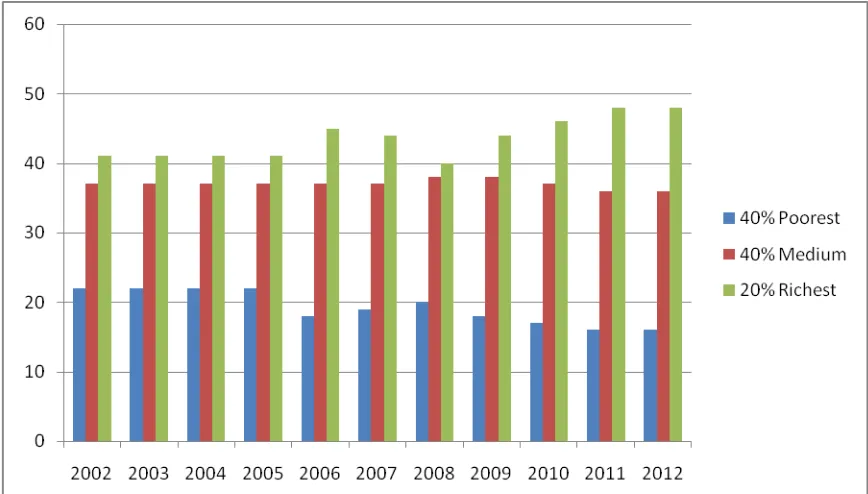
Figure 2. The Distribution of The Income of The Three Household Categories in Java, 2002-2012
Source : Central Bureau of Statistics
232
Based on the evidence, this study examines the relationship between economic growth and income inequality in Java. This study also examines how the influence of redistribution income on the economic growth. This analysis follows the previous study conducted by Ostry et al. (2014) found that the redistribution is able to provide a positive influence on the equity income and economic growth.
Redistribution of income in Indonesia is particularly conducted through fiscal policy, namely taxes and transfers. After the implementing of progressive and proportional rate on the tax system in Indonesia, the existing system should not be biased towards high income of the society. Along with the activities of the transfer, the system should be able to improve the distribution of income in society.
The scope of this study covered all district/city in Java Island, excluded three regencies/cities as the result of the expansion of the region, such as Pulau Seribu, Serang, Tangerang and South Tangerang. Therefore, the total of district/city included in the analysis is 115 regencies/cities. The year analysis used in this study is three points in time, i.e 2008, 2010 and 2012. The use of the two years interval is mainly caused by the limitation of data.
In addition, the changes of the Gini index as an indicator of income inequality is very slow, so that the use of the two years interval is considered enough to capture the changes in the variables. Gini index in this study is measured by using data on household spending. Measurement of the redistribution is undertaken by finding the difference between Gini index before and after taxes. This method follows the previous research conducted by Sinaga (2012).
The structure of this paper is as follows. The introduction section presents the background and the scope of study. The second section explains the literature review. Section three discusses the research method used in this study. The fourth section discusses the results. Finally, the last section conclusions.
LITERATURE REVIEW Fiscal Policy
233
investment. According to Sudiyono (1985), fiscal policy instrument variable can be formed of taxes, government transfer, redistribution and government spending. In practice, fiscal policy has three functions: the first is a function of the allocation, the second is the distribution function and the third function is stabilization. In this case, the most important of distribution function is to do the distribution of income in society. When the distribution function exists, then by the theory the income redistribution mechanism would be the better.
In general, the redistribution method used by the government is conducted through tax and transfer system. Each year, Central Bureau of Statistics (BPS) held surveys of the households in national scope. This survey covered the household spending including for tax payment. The tax data available is only the income tax (PPh/Pajak Penghasilan) and property tax (PBB/Pajak Bumi dan Bangunan). PPh is categorized as direct tax, meaning that the burden of this tax could not be transferred to any other party so that it will have a direct impact on the subject of taxes. PBB is a tax imposed on the ownership or utilization of land and or building. PBB included in the direct tax, although in reality this type of tax is still allowing for non-direct tax (example: taxes for housing rental).
The influence of taxes on income redistribution should be real because of the tax rates applied are progressive and proportional. Directorate General of Taxes (2012) set the price of the applicable income tax is as follows: 5% (for earning of 0 – 50 million rupiah per year), 15% (earning 50-250 million rupiah per year), 25% (earning 250-500 million rupiah per year), and 30% (earning more than 500 million rupiah per year). Meanwhile, the determination of PBB is conducted by the proportionate method that is depending on the value of land and building. The burden valued of the PBB is 0.5% of the Taxable Value (NJKP).
The Effects of Fiscal Policy on Economic Growth and Income Distribution
234
in favour of policies that support programs that improve the redistribution. The study that used redistribution variable in Indonesia is still limited. Sinaga (2012) calculated the redistribution in Karo Regency by dividing the community groups into ten groups (deciles). The results of the study showed that the magnitude of each distribution is positive, but very small.
The influence of redistribution on economic growth in general can be a positive or a negative. The study concluded the economic growth could improve redistribution argued that if the redistribution used as efforts to increase the welfare of the society through the improving the quality of human capital such as health and education, then it will able to increase economic growth (Benabou 2000). In addition, if the redistribution used to cover losses due to the imperfection in the market then it will increase the economic growth (Saint-Paul Verdier and 1993). Ostry et al. (2001) also showed that the redistribution can increase the economic growth.
In contrast, the study that supports the negative effect of redistribution on economic growth is based on Okun's law. Okun's law stated that there will be a tradeoff between efficiency and equity. The question about the efficiency is the economic growth, so the improvement of equity income through the redistribution would reduce economic growth. In addition, the other aspects influenced the assumptions of this hypothesis are the high taxes and subsidies, as it will appear a person's tendency to reduce the amount of work and time investment. In general, it will reduce the overall of economic growth.
235 RESEARCH METHODS
This study uses panel data of regression models combining the data between cross section and time series. The data obtained from the Central Bureau of Statistics (BPS). The first independent variable in this study is the income per capita, calculated based on the year and a constant in the units of dollars/person. The second independent variable is a variable income inequality as measured through the Gini index. The calculation of Gini index is written as follows:
(1) Where :
G = Gini Index
Xk = Cumulative Income Household for k = 1, 2,……,n
Yk = Cumulative Consumption Household for k = 1, 2,……,n
The third independent variable is the distribution index (ID), which measures the influence of tax towards the income distribution using Kakwani index. The calculation of the index is limited to PBB (property tax) as well as PPh (income tax). The index is looking for a difference between gini index before and after tax. The calculation of the distribution is as follows:
(2)
Where :
ID : Distribution Index Gx : Gini Index before tax
Gy : Gini Index after tax
While the dependent variable is the economic growth variable with GDP per capita growth proxy on the basis of constant prices in 2000.
Therefore, the specified econometrics model used in this study is written as follows: (3)
To choose the method of panel data model which are the most appropriate in the processing of panel data, there are some tests that can be performed:
236
H0 = PLS model H1 = fixed effect model
If the value of the Chow (F statistics) > FN-1, NT-N-K then it can be said that there is already enough evidence to reject H0, so that the model used was the
fixed effect model and applied reversely.
2. Hausman Test, the statistics test as the basis for consideration in choosing whether using the model of fixed effects or random effects model. Hausman test is conducted with the hypothesis as follows :
H0 = Random Effect Model H1 = Fixed Effect Model
As the basis for rejection of the zero hypothesis. If Hausman statistics > Chi Square statistics or by using the value of probability (p-value). If the p-value is the critical level α <, then reject H0.
RESULTS AND DISCUSSION
The Redistribution of Income in Java
The redistribution value is obtained in seeking the difference between Gini index before and after taxes. The redistribution during the period of analysis showed a positive trend (figure 3), indicating some improvement in tax redistribution. If it is associated with the development of Gini Index, then it can be seen that there was a direct relationship between Gini index and redistribution. These results are in accordance with research conducted by Ostry et al. (2014), which is found that the higher the Gini index will cause the higher of redisribution level. Meltzer and Richard (1981) revealed that in the region with high income inequality, people will be more supportive to the policies which are pros to the redistribution, so it will cause the positive correlation between Gini Index and redistribution.
237
are registered and pay tax. To analyse these allegations it can be conducted by finding the correlation between the magnitude of the tax percentage and households’ expenditure. The analysis will be done by classifying them based on deciles. The application of an effective progressive rate should produce correlation that is increasing from the first deciles to the last deciles.
2008 2010 2012
Years
Figure 3. Gini index and Redistribution Income in Java Island Period 2008-2012 Source : Central Bureau of Statistics
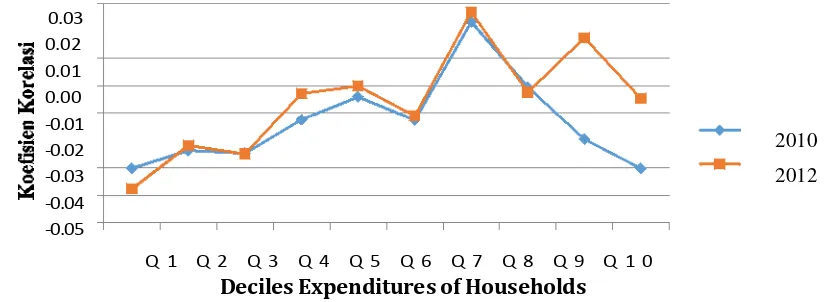
The results of testing the correlation coefficient between the percentage of households expenditures towards tax shows that the progressive tax systems do not apply effectively (figure 4). By using households’ expenditure in 2010 and 2012 seems that there is the same pattern on the correlation coefficient. D1 is the first deciles which represents 10% of the lowest households; expenditures, while the D10 is 10% with the highest expenditure. At D1-D5 there is increasing in coefficient of correlation, but on D6 and D8- 10 correlation coefficient is decreasing. These results indicate that in low income households (D1-D5) the application of a progressive rate runs better than in high income households (D6-D10).
Q 1 Q 2 Q 3 Q 4 Q 5 Q 6 Q 7 Q 8 Q 9 Q 1 0
Deciles Expenditures of Households
Figure 4. Percentage of Correlation Coefficient Against Tax Expenditures of Households Source: Central Bureau of Statistics
238
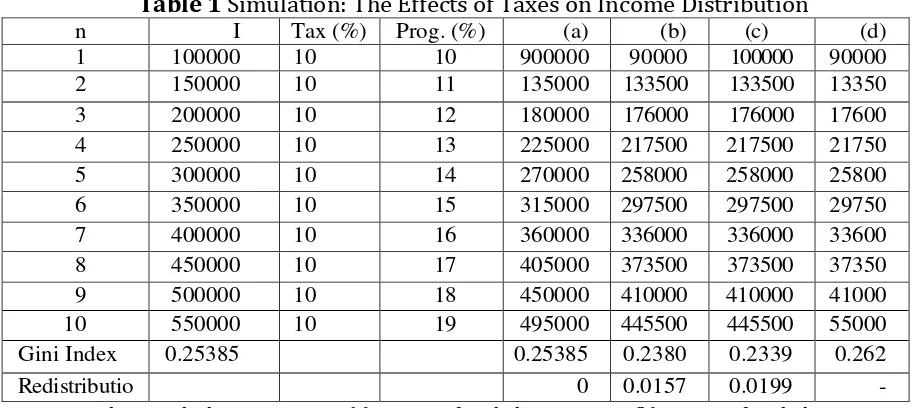
To support the previous statement, then we use a simple simulation data to show how supposedly the progressive tax take effect on income distribution (table 1). Column (a) in table 1 shows the income distribution with the same tax revenue (10%), providing the Gini Index of 0.25385 and zero redistribution. Column (b) is an income that is charged by progressive tax, providing a Gini Index value which is less than the value of the initial Gini Index (0.23808) and the redistribution value of 0.01577. Column (c) and (d) is a simulated column, whereas column (c) is a condition if for example, households with the lowest income do not pay the taxes, while column (d) if households with the highest income do not pay the taxes. The results of the Gini index show that in column (c) the value of Gini index is lower than the initial Gini index (0,23394), while column (d) has the higher Gini Index (0.26242).
Table 1 Simulation: The Effects of Taxes on Income Distribution
n I Tax (%) Prog. (%) (a) (b) (c) (d) 1 100000 10 10 900000 90000 100000 90000 2 150000 10 11 135000 133500 133500 13350 3 200000 10 12 180000 176000 176000 17600 4 250000 10 13 225000 217500 217500 21750 5 300000 10 14 270000 258000 258000 25800 6 350000 10 15 315000 297500 297500 29750 7 400000 10 16 360000 336000 336000 33600 8 450000 10 17 405000 373500 373500 37350 9 500000 10 18 450000 410000 410000 41000 10 550000 10 19 495000 445500 445500 55000 Gini Index 0.25385 0.25385 0.2380 0.2339 0.262
Redistributio 0 0.0157 0.0199
-Notes: n = the sample data; I = income; (a) income after deducting taxes; (b) income after deducting tax progressive; (c) the case of the lowest income examples don't pay taxes; (d) the case is an example of the highest incomes don't pay taxes
239
The Effects of Redistribution on Economic Growth
To examine the effects of the Gini Index and the redistribution income on economic growth, the equation (3) is estimated. In addition, the equation (3) will be divided into two groups, the group of low-income district/city and high-income district/city. The results are presented in table 1 and table 2.
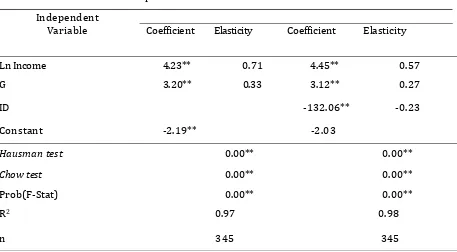
Table 2. The influence of Gini Index and Index Distribution on Economic Growth
Dependent Variable : Economic Growth
Independent
Variable Coefficient Elasticity Coefficient Elasticity
Ln Income 4.23** 0.71 4.45** 0.57
G 3.20** 0.33 3.12** 0.27
ID -132.06** -0.23
Constant -2.19** -2.03
Hausman test 0.00** 0.00**
Chow test 0.00** 0.00**
Prob(F-Stat) 0.00** 0.00**
R2 0.97 0.98
n 345 345
Note: ** significant at 5% level
Based on the results of Hausman test, it generates a significant value at 5% level, concluding that the best model is the fixed effect. Then, using Chow test to determine the better model between PLS and fixed effect, it also shows that the significant value at 5% levels so it can be inferred that the best model used is the fixed effect panel data.
The first classical assumption test conducted is the test for multicollinearity. Multicollinearity test results show that there is no real coefficient is greater than the value of R2. The next test is the Autocorrelation test. This test is done by comparing the
value of the Durbin Watson test with DW table.
240
of F-statistical, R2, and t-statistics. The value of F-statistics shows the significant
value at 5% levels. These results indicate that the model is already able to explain the diversity on the dependent variables. The value of R2 indicate how large the
diversity on the dependent variable explained by the independent variables. The result shows that the R2 is 97% which means 0.97 variations on the dependent
variable that is explained by the independent variables and the remaining 3% is explained by other variable outside the model.
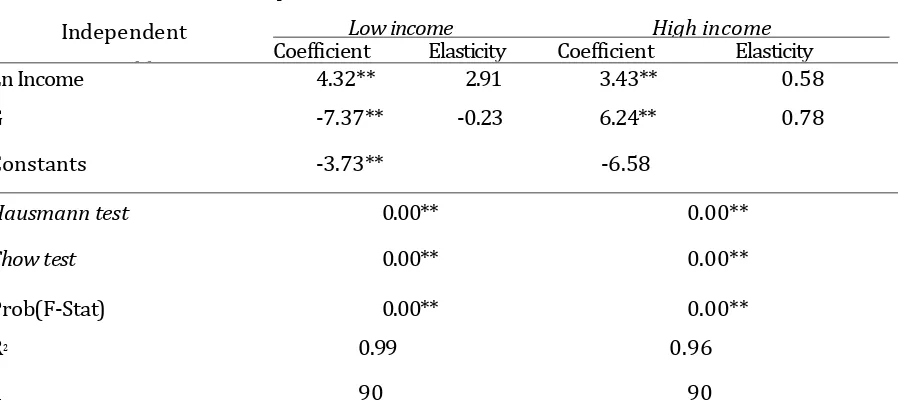
Table 3. The Effects of Gini Index and Income Distribution on Economic Growth at Low-Income and High-Low-Income Regions
Dependent Variable: Economic Growth
Independent
Variable
Low income High income
Coefficient Elasticity Coefficient Elasticity
Ln Income 4.32** 2.91 3.43** 0.58
G -7.37** -0.23 6.24** 0.78
Constants -3.73** -6.58
Hausmann test 0.00** 0.00**
Chow test 0.00** 0.00**
Prob(F-Stat) 0.00** 0.00**
R2 0.99 0.96
n 90 90
Note: ** significant at 5% level
Based on table 2, Gini index has positive and significant effect on the standard of 5% in economic growth. These results are in accordance with research conducted by Barro (2000), Calderon and Serven (2004), and Hajiji (2010). Its elasticity values 0.27 and 0.32 indicated that an increase in the Gini index is 1% increases the economic growth ranging from 0.27% and 0.32%. Barro (2000) in his study concluded that income inequality can accelerate economic growth in the region.
241
Island have to sacrifice income equity or going on the tradeoff between equity and economic growth.
Joseph (2005) has grouped some of the possible relationship between income inequality and economic growth. Income inequality is good for economic growth caused by an increase in investments from savings. This hypothesis said that the increasing of savings depends on the income. If the income inequality increases, the wealthy regions are able to increase its revenues and further again raise the level of savings. An increase in savings is what will increase investment and improve economic growth (capital fundamentalism argument).
The second reason that influences the economic growth is related to the difference of human capital (Benabou, 1996) and technological progress. In the period that is an area to absorb new technology, so the only employee with high capability that is able to master the technology. They will get higher wages and lead to income inequality. Instead, the new technology will accelerate economic growth.
Java simply describes the reason. As a region with the fastest development in Indonesia, Java Island is a main region that absorbs new technology in Indonesia (compared to other regional in Indonesia). New technologies are coming from outside country most applied first in Java. Supporting by the adequate human resources is the main reason of the selection of Java Island. Supporting by high quality of education especially at the university level, it will lead to new technologies that is controlled by the incoming employment with the best education level. Thus, the income inequality and economic growth can run together.
242
economic growth. The assumption also does not apply to the case of the Java. The redistribution coefficient that is negative also showed that the equality of income redistribution does not fix the income and the economic growth.
GDP per capita (Ln Income) is statistically significant in both models with positive coefficients. The elasticity on the low income model amounted to 2.91. This value is greater than on the table 2 Meanwhile, the elasticity of high income model is 0.58, which is smaller than the value of the Java Island model in table 2. Based on the results, it can be concluded that the district/city with lower GDP per capita has higher elasticity in economic growth. So, the tendency of low-income district/city to afford to catch up the level of GDP per capita of the district/city rich can be realized.
Gini index variable is also statistically significant effect on both models, but with a different sign. In low income model, the Gini index has negative effect while in high income model Gini index has positive effect. The elasticites of each model (low and high income) was-0.23 and 0.78.
Barro (2004) in his research underlined that high inequality occurs only on the rich area and there was no clear relation with poor areas. The results of this study supports the results above where the rich district/city is influenced by high inequality between equity income and economic growth even with higher elasticity, while at the poor district/city was not prove its high inequality between equity income and economic growth that did not happen. These results indicated that at the poor district/city needed equity income to increased economic growth.
Joseph (2005) stated that in low income region, inequality does not exist suggesting that economic growth is caused by improvements in the quality of human capital (education and health) that would be able to increase revenues and the economic growth. The result concluded that the determination of economic growth in the high-income and low-income region is different. In high income, there is a need more capital value to increase economic growth, while in low-income region, district/city need to fix the human resource used to increase the economic growth.
CONCLUSION
Based on the results and a discussion that has been presented before, the conclusions of this research are as follows:
243
2. There is a tradeoff between equity income and economic growth in Java Island. At the district/city that has low-income, the hypothesis is not relevant.
3. Redistribution has negative effect on economic growth and income inequality. Inefficiencies in the tax system became the main reason for the problem.
This study also found that the determinants of economic growth in Java Island and high-income regions are caused by the increasing income inequality. This result is irrelevant to the objectives of the economy to achieve the welfare of society. So, it is needed a stimulus policy that is able to correct the income inequality at the same time with the economic growth. On the development of the low-income regions with income inequality and economic growth have been running correctly. However, it tooks a look out for will be the same pattern appears when the district/city has been in the high income category. In an effort to equitable income distribution, the improvements in the tax system should be done immediately because of the inefficiency of the system aggrevated the condition of income inequality and economic growth. For further research could be improved on the redistribution variable by adding types of tax data and subsidies, to increase the number of district/city on the national level, and use other approach method such as dynamic panel data method.
REFERENCES
Alesina A, Perotti R. 1996. Income Distribution, Political Instability, and Investment.
European Economic Review. 109(2): 465-490.
Barro RJ. 2000. Inequality and Growth in a Panel of Countries. Journal of Economics Growth. 5(1):5- 32.
Benabou R. 1996. Inequality and Growth. Department of Economics and NBER: New York University. Benabou R. 2000. Unequal Societies: Income Distribution and the Social Contract. The American Economic Review. 90(1):96-129.
Benerjee AV, Duflo E. 2003. Inequality and Growth: What Can the Data Say?. Journal of Economic Growth. 8(3): 267-309.
Birdsall N. 2005. Rising Inequality in The New Global Economy. No.2/2005 World Institute for Development Economics and Research. Amerika Serikat (US): Widger Angel.
[BPS] Badan Pusat Statistik. 2014. Indonesia Dalam Angka. Jakarta (ID): BPS.
Calderon C, Serven L. 2004. The Effects of Infrastructure Development on growth and Income Distribution. Central Bank of Chile. Economic Research Division.
244
American Economic Review. 90(4): 869-886.
Galor O, Moav O. 2004. From Physical to Human Capital Accumulation: Inequality and the Process of Development. Review of Economic Studies. 71(4). 1001-26
Direktorat Jenderal Pajak. 2012. Pajak Penghasilan Orang Pribadi untuk Keadilan. [Internet]. [diunduh 8 Agustus 2014]. Tersedia pada:
http://www.pajak.go.id/content/pajak-penghasilan-orangpribadi-untuk-keadi
lan.
Juanda B. 2009. Ekonometrika : Pemodelan dan Pendugaan. Bogor (ID): IPB Press Bogor. Hajiji A. 2010. Keterkaitan antara Pertumbuhan Ekonomi, Ketimpangan Pendapatan, dan
Pengentasan Kemiskinan 2002-2008 [Tesis]. Bogor (ID): Institut Pertanian Bogor. Hidayat S, Panturu AA. 2007. Perumbuhan Ekonomi, Ketidakmerataan Pendapatan, dan
Kemiskinan: Estimasi Parameter Elastisitas Kemiskinan Tingkat Provinsi di Indonesia Tahun 1996-2005. Jakarta: Universitas Indonesia.
Kaldor N. 1957. A Model of Economic Growth. The Economic Journal. 67(268): 591– 624. Koutsoyiannis A. 1977. Theory of Econometrics Second Edition. USA [US]: Harper & Row Publisher, INC.
Manurung S. 2013. Kompleksitas Kepatuhan Pajak. [Internet]. [diunduh 10 Agustus 2014]. Tersedia pada:
http://www.pajak.go.id/content/article/kompleksitas-kepatuhan-pajak. Direktorat Jenderal Pajak.
Meltzer AH, Richard SF. 1981. A Rational Theory of The Size of Government. The Journal of Political Economy. 89(5):9 14-927.
Ostry JD, Berg A, Charalambos GT. 2014. Redistribution, Inequality, and Growth. IMF. Working Paper.
Saint-Paul G, Verdier T. 1993. Education, Democracy and Growth. Journal of Development Economics. 2(2):399-407.
Sinaga RBR. 2012. Pengaruh Pajak Terhadap Pemerataan Pendapatan Masyarakat RegencyKaro Analisis Data Survey Sosial Ekonomi Nasional Tahun 2010 [tesis] Universitas Indonesia.
Todaro MP, Smith SC. 2006. Pembangunan Ekonomi. Edisi Kesembilan. Munandar H, penerjemah; Bernadi D, editor. Jakarta (ID): Penerbit Erlangga. Terjemahan dari:
Economic Development. Ninth Edition.