Petter Lundborg is a professor of economics at Lund University in Sweden. Petter.Lundborg@nek.lu.se. Paul Nystedt is an associate professor of economics at Linköping University in Sweden. Paul.Nystedt@liu .se. Dan- Olof Rooth is a professor of economics at Linnaeus University in Sweden. Dan- Olof.Rooth@lnu .se. The authors thank two anonymous referees and seminar participants at Linnaeus University, Lund Uni-versity, IFAU / Uppsala UniUni-versity, at the ESPE conference in Seville and at the EALE meeting in London for useful comments and suggestions. Research grants from the Centre for Economic Demography at Lund University and the Swedish Council for Working Life and Social Research are gratefully acknowledged. The data in this article belong to Statistics Sweden. Scholars seeking to replicate this work may consult Dan- Olof Rooth, Linnaeus University, 39182 Kalmar, Sweden, beginning August 2014 through July 2017.
[Submitted October 2011; accepted December 2012]
ISSN 0022- 166X E- ISSN 1548- 8004 © 2014 by the Board of Regents of the University of Wisconsin System
T H E J O U R N A L O F H U M A N R E S O U R C E S • 49 • 1
Cognitive and Noncognitive Skills
Petter Lundborg
Paul Nystedt
Dan- Olof Rooth
A B S T R A C T
We use large- scale register data on 450,000 Swedish males who underwent mandatory military enlistment at age 18, and a subsample of 150,000 siblings, to examine why tall people earn more. We show the importance of both cognitive and noncognitive skills, as well as family background and muscular strength for the height- earnings relationship. In addition, we show that a substantial height premium remains after these factors have been accounted for, which originates from very short people having low earnings. This is mostly explained by the sorting of short people into low- paid occupations, which may indicate discrimination by stature.
I. Introduction
associa-tion arises because short people are being discriminated against but two recent studies, Persico, Postlewaite, and Silverman (2004) and Case and Paxson (2008a), attribute the association between height and earnings to mental skills associated with height.1
Despite using the same data source, the two studies reach different conclusions concerning the nature of the underlying mechanisms at work, however. Case and Paxson (2008a) emphasize the role of cognitive skills whereas Persico, Postlewaite, and Silverman (2004) stress the importance of noncognitive (or social) skills. In their analysis of data from the United Kingdom and United States (National Child Develop-ment Study, NCDS, and National Longitudinal Survey of Youth, NLSY, respectively), Persico, Postlewaite, and Silverman (2004) fi nd that teen height essentially explains the association between adult height and hourly wages among white men. In addition, they show that even if cognitive test scores in childhood are correlated with adult earn-ings, these scores do not affect the magnitude of the association between height and earnings. Instead, they argue that the link between teen height and later life earnings runs via participation in activities that build social skills during adolescence. From this perspective, noncognitive skill can be viewed as a mediating factor in the earnings relationship as it results from social processes in which height in youth infl u-ences its development.
Case and Paxson (2008a) use wider inclusion criteria and argue that height growth and cognitive development during childhood are subject to common environmental and nutritional circumstances. Accordingly, the association between height and earn-ings does not refl ect a causal effect of height, but rather that height is correlated with cognitive ability via some underlying third factor affecting both height and earnings. They fi nd that neglect of controlling for cognitive ability substantially biases the esti-mate for height in the earnings regression upwards.2
In this paper, we provide new evidence on why tall people earn more. We contrib-ute to the literature by jointly analyzing the hypotheses offered by Case and Paxson (2008a) and Persico, Postlewaite, and Silverman (2004) on the role of cognitive and noncognitive skills. For this purpose, we exploit data on an unusually large sample of 450,000 Swedish males enlisting for the military between 1984 and 1997. Besides including high- quality composite measures of both cognitive and noncognitive skills, the data include measured height at age 18 and register- based data on adult earnings, which should be more reliable than information obtained from surveys. Because en-listment was mandatory for all males at age 18 during the study period, our data also have an extraordinary degree of representativeness.
In addition, we examine the role that both observed and unobserved family back-ground plays for the relation between height and earnings. Part of the association between height and earnings may simply refl ect that tall people come from advan-taged backgrounds but the previous literature has not been able to fully address this. We therefore exploit data on a large sample of 145,000 sibling brothers who enlisted for the military. As a further contribution, we investigate the importance of muscular
strength. While this factor has not been considered in the economics of height litera-ture to date, we argue there are reasons to believe it could still be of importance for the height- earnings relationship also in the western world.
Finally, we relax the assumption of linearity in the relationship between height and earnings. By estimating models with centimeter fi xed- effects and piecewise- linear spline models, we are able to analyze whether any height- earnings relationship that remains after accounting for control variables and mediating factors could refl ect discrimination against short people or, correspondingly, preferential treatment of tall people. We also investigate the extent to which any such remaining height premium refl ects sorting of short people into low- paid occupations.
Our results demonstrate a substantial association between height and earnings also in a country such as Sweden, with universal healthcare coverage and small health and income inequalities. We then fi nd that half of this raw association is explained by tall people coming from advantaged family backgrounds and having higher cognitive test scores. While this provides some support for the fi ndings of Case and Paxson (2008a), we then also show the importance of noncognitive skills. Arguing that noncognitive skills should be thought of as a mediating factor in the height- earnings relationship, we fi nd this type of skill to explain one fi fth of the height premium, lending some sup-port also to the hypothesis put forward by Persico, Postlewaite, and Silverman (2004). When we also add muscle strength to our analysis, the magnitude of the earnings relationship is further weakened.
Although inclusion of our control and mediating variables reduces the raw associa-tion between height and earnings by as much as three- quarters, we fi nd that a signifi -cant relationship between height and earnings remains. Relaxing the assumption of linearity in the height- earnings relationship shows that this remaining height- earnings association originates from very short people having low earnings. This could be in-dicative of discrimination of short people on the labor market, although we cannot rule out that it instead is a result of some, by us unobserved, productivity enhanc-ing trait beenhanc-ing associated with height. Irrespective of the mechanism, we show that this remaining ”shortness penalty” is explained by short people sorting into low- paid occupations.
This paper is organized as follows. Section II outlines a basic conceptual and em-pirical framework and discusses how cognitive and noncognitive skills as well as muscular strength may be linked to height in late adolescence, thereby potentially infl uencing the association between height and earnings. In Section III we describe our data and provide some descriptive statistics. Our results are presented in Section IV, whereas Section V concludes.
II. Conceptual Framework
In order to conceptualize how the “returns” to height could be inter-preted, consider the following counterfactual framework:
(1) yi≡fi(h),
of as the additional earnings that each additional unit of height generates.3 There are mainly two sorts of mechanisms that would generate such returns. First, the height premium may result from preferential treatment of tall people. In this case, the returns to height refl ect a taste for stature per se on the labor market. Second, the returns may result from any positive effect height brings on productivity, for instance through its effect on the formation of noncognitive skills. Here, it is not height per se that is val-ued on the labor market but rather the skills that result from greater height.
In order to empirically investigate the returns to height, the previous literature has adopted empirical specifi cations of the type:
(2) yi=α+βhi+Xi'γ
+εi
where Xi' denotes a vector of all relevant control and mediating variables and γ denotes
the corresponding regression coeffi cients. Given that no mediating factors are included in Xi' and under the assumption that Cov(h
i, εi) = 0, β would measure the causal return to height. To the extent that the returns to height refl ect the impact of height on productivity- enhancing factors, including these mediating factors in X would reduce the magnitude of β. What remains of β then capture the returns to height as measured through preferential or discriminatory treatment.
As discussed in the introduction, Persico, Postlewaite, and Silverman (2004) argued that noncognitive skills are mediating factors in the relationship between height and earnings. Case and Paxson (2008a) instead argued that the height coeffi cient picks up that tall people earn more because of their greater cognitive skills. If this latter argu-ment is valid, a simple regression of earnings on height would suffer from a standard omitted variables problem, where the estimated β would be biased upward due to the omission of cognitive skills in the regression.
Our discussion so far thus shows that there is a sharp distinction between the two hypotheses when it comes to the underlying mechanisms at work. In the following three sections we deepen our discussion on the role of cognitive, noncognitive skill and muscular strength for the height- earnings association in order to clarify our choice of empirical strategy.
A. Cognitive Skills
A positive association between height and cognitive ability, throughout the human life-span from early childhood to old age, has been documented in numerous studies. (See, for example, Richards et al. 2002; Case and Paxson 2008a, 2008b.) This association was exploited by Case and Paxson (2008a) and formed the basis for their argument that the association between height and earnings largely refl ects the fact that taller people on average have greater cognitive abilities.4 The authors also provide a survey of some of the potential explanations for the positive association between height and cognitive abil-ity. Summarizing, it is postulated that certain growth factors are related to both height and cognitive ability, although there is still substantial uncertainty regarding the exact
3. Note that the concept of the “height premium” refers to an individual and not a population return. That is, we study the effect of a single person being taller (but the population distribution staying the same) rather than a cohort getting taller.
underlying mechanisms. For instance, insulin- like growth factors are believed to infl u-ence body growth at the same time as infl uencing neural growth. It is also assumed that environmental factors, such as maternal smoking during pregnancy, may also explain part of the association between height and cognition. In comparing twins, Black, Dev-ereux, and Salvanes (2007) found a connection between birthweight on the one hand, and IQ test scores and height in late adolescence on the other, again underscoring the importance of the intrauterine environment for adult height as well as cognitive ability.
Based on the basic presumption that an individual’s endowment affects both cogni-tive and height development, Case and Paxson (2008a) postulate that cognicogni-tive ability and the onset of the growth spurt in adolescence should be correlated, which is indeed what they fi nd in their data.5 For boys, cognitive test scores at age 11 are positively associated with height gain in the subsequent fi ve years and negatively associated with height gain from age 16 onwards. Though boys entering their growth spurt late may catch up in height, they will still lag behind cognitively as the relative position, when it comes to intelligence, is rather fi rmly established early in life. This fact may explain why height in adolescence is a stronger predictor of adult earnings than adult height.
Hence, the association between height and cognition has primarily been attributed to common underlying factors, and not to any causal relation between the two. From this respect, cognitive ability should be regarded as a control variable when estimating the height premium.6
B. Noncognitive Skills
Noncognitive skills are commonly referred to in the literature as personal character traits such as motivation, persistence, charm, and leadership abilities. In the labor eco-nomics literature, the term essentially describes a complexity of personal characteris-tics connected to the aspects of one’s persona (apart from pure cognition), potentially affecting productivity.
It seems uncontroversial to presume that noncognitive abilities are valued by em-ployers, co- workers and potential customers in almost any kind of occupation. Indeed, a recent body of research has shown that noncognitive skills are important predictors of various adult socioeconomic outcomes. (See, for example, Heckman and Rubin-stein 2001; Heckman, Stixrud, and Urzua 2006; Borghans et al. 2008; Lindqvist and Vestman 2011.) If height in adolescence is related to the development of noncognitive skills, it is therefore straightforward to formulate a hypothesis where part of the height premium refl ects the returns to noncognitive skills, as in Persico, Postlewaite, and Silverman (2004).
Whereas the linkage between cognition and height has been attributed mainly to biological processes early in life, the connection between noncognitive skills and
5. Endowments are defi ned as environmental conditions (such as health and nutrition), biological factors, genetic factors, and gene- environment interactions.
height has commonly been attributed to social processes, in which taller individuals are treated differently than shorter ones. For instance, a common theory in social psy-chology postulates that taller people are more successful for reasons of interpersonal dominance. (See, for example, Frieze, Olson, and Good 1990.) It then follows that if being tall is an advantage in different competitive situations, this may facilitate the building of self- esteem and social skills in relatively taller individuals. Moreover, children may face different expectations from parents, teachers, other adults, and peers depending on their height. If children react to expectations by complying, such expectations may become self- fulfi lling. For instance, if taller children are perceived and treated as being more mature, when it comes to temperance, responsibility, and planning, they may well be fostered into developing such traits.
As discussed by Persico, Postlewaite, and Silverman (2004), another explanation emphasizes the role of self- esteem, but from a different perspective. Here, the height premium stems from the greater self- image that is achieved through a comparison with a socially determined notion of ideal height. It is then argued that a greater self- image leads to higher achievement through noncognitive factors such as perseverance and social skills. This is related to the fi ndings of Persico, Postlewaite, and Silver-man (2004), where teen height is found to explain a large part of the relationship between height and earnings, and where the premium is reduced when controlling for participation in high school sports and clubs. The latter fi nding causes the authors to conclude that such participation shapes noncognitive skills. This is well in line with Kuhn and Weinberger (2005) who, controlling for cognitive ability, found that self- perceived leadership skills as well as exposure to leadership positions in high school, was positively related to earnings later in life. Moreover, Lindqvist (2012) fi nds that height is positively related to leadership skills, as measured at the Swedish enlistment.
In sum, existing explanations for the association between height and noncognitive skills in general focus on how height may affect the development of noncognitive skills, rather than both being determined by some third, underlying factor. From these respects, noncognitive skill is a mediating factor in explaining the height premium.7
C. Muscular Strength
It has long been known that anthropometric measures such as body height are strongly correlated with muscular strength. (See Everett and Sills 1952 for an early example.) If muscle strength would also have an independent infl uence on earnings, part of the height- earnings relationship would refl ect the association between height and muscle strength. Though admittedly, the direct importance of muscle strength for labor market success has likely declined with the development of society and modern production
processes, there are still a number of reasons why it may be correlated with labor market success in the western world.
First, the development of the muscular system may be related to the same ge-netic predispositions and susceptible to the same environmental conditions as height growth, thereby yielding a positive correlation between the two (Silventoinen et al. 2008).8 To the extent that the same genetic and environment factors also in
fl uence a person’s labor market success, muscle strength would be an important control variable when estimating the height premium.
A second possibility is that tall people to a larger extent participate in activities that not only builds noncognitive skills, as suggested by Persico, Postlewaite, and Silver-man (2004), but also muscle strength, such as sports, and that these same characteris-tics have a labor market return. (See Rooth 2011.) In fact, to the extent that being tall constitutes an advantage in certain sports activities, one would expect tall people to participate to a greater extent. From this perspective, muscle strength would instead be a mediating factor in the height- earnings relationship, because it may partly be caused by being tall.
Finally, it is also possible that male muscle strength signals certain personality traits. Some studies have for instance found that handgrip strength predicts not only physical fi tness but also aggressiveness and dominance (Gallup, White, and Gallup 2007). These traits can be recognized as dimensions of noncognitive skills, which would mean that muscle strength would partly pick up the same factors as direct mea-sures of noncognitive skills.
Even though there are good reasons to believe that muscle strength may play a role in the height- earnings relationship, our discussion also shows there is great uncer-tainty about the mechanisms at work. In our empirical analysis, we will therefore be somewhat agnostic about whether muscle strength mainly plays the role of a control variable or a mediating variable and leave that for future research to investigate.
D. Empirical Framework
Our baseline empirical model relates adult earnings to height at age 18 for the full population and controls only for age:
(3) yi = α + βhi + δai + εi
where i is the index for the individual, h is a measure of individual height in centimeters, and where a indicates age. In this model, β will pick up both the causal return to height, that run through preferential treatment of tall people or through mediating factors, and the infl uence of any omitted control variables that are correlated with height and earn-ings. We will then alter this baseline model by including different control variables and mediating variables into the regression. In particular, the previous section introduced three sets of variables that are of importance in understanding the relationship between height and earnings; cognitive skills, noncognitive skills, and muscular strength. We will also introduce variables indicating family background; that is, parental education
and parental earnings, which will be thought of as control variables, as they may relate to both an individual’s height and earnings. By entering the explanatory variables one by one, starting with the controls, and then together, we can analyze to what extent the relationship between height and earnings in Equation 3 above is affected when account-ing for control variables and mediataccount-ing factors. Our full model can thus be written: (4) yi=α+βhi+Xi'γ
+εi
where X now is the vector of variables measuring age, parental background, cognitive skills, noncognitive skills, and muscle strength, and where γ is the associated vector of regression coeffi cients. In this model, the estimate of β can be interpreted as the returns to height that remains after accounting for the effect of height that runs through noncognitive skills and after controlling for factors associated with, but not caused by, height—that is, cognitive skills and parental background.9 This remaining height premium can then be interpreted as the part of the height premium that runs through preferential treatment of tall people on the labor market, given that all mediating fac-tors and confounding facfac-tors have been accounted for.
Note that in our main empirical analysis, we only include variables that are deter-mined before labor market entry. As argued by Case and Paxson (2008a), controlling for variables such as occupation and postsecondary education would hide part of the height premium if taller individuals sort themselves into certain educations or jobs. However, at the end of the analysis found in Tables 4.1 we will examine the extent to which the remaining height premium works through sorting into occupations and educations.
Our second main specifi cation exploits our data on siblings and can be written as: (5) yij=α+βhij+Xij'γ
+μj+εij
where ij is an index for an individual i in family j and μ represents a family fi xed ef-fect. The fi xed effect captures family characteristics common to all siblings within the same family. Here, identifi cation of the height coeffi cient relies upon sibling variation in height at age 18. In this specifi cation, our estimate of β will not be biased due to any confounding infl uence from unobserved family level factors that are also associated with earnings.
The availability of large- scale sibling data constitutes an important advantage in our analyses. First, height is known to have a very high genetic heritability explaining up to 80 percent of its variation ( Visscher, Hill, and Wray 2008).10 If some of the genes that affect height, via separate channels also affect earnings, this will bias the height coeffi cient, because genes are not observed. However, since biological siblings share on average 50 percent of their genes, our fi xed effects approach therefore ”washes” out some of the genetic infl uence, which may reduce the bias in the height coeffi cient. A similar reasoning applies to the coeffi cients for cognitive skills, noncognitive skills, and muscle strength.
Even though the siblings fi xed effects approach does not fully cancel out the infl u-ence of genetics, the sibling data give us another advantage: Mendellian
randomiza-9. This also assumes that all relevant control variables have been included in the regression.
tion, or the “genetic lottery,” implies that within a family, it is random which child inherits a particular gene.11 Thus, if the variation in height across siblings that remains after accounting for sibling fi xed effects would be mainly genetically determined, we can be confi dent that height variation across siblings is exogenous.12
Second, the sibling approach allows us to difference out confounding environmental factors operating at the family level. Sibling teenagers are likely to share important unobserved factors such as food and nutrition supply in the home, parental practices, and preferences. They are also likely to attend the same school and thus face the same school environment and neighborhood characteristics.13 However, parents may also reinforce or compensate for differences in endowments between siblings by directing various amounts of skill building resources to each child. Empirical evidence from Western countries seems to mainly support the hypothesis that parents try to com-pensate for ability differences between children. (See Almond and Currie 2011 for a recent literature overview.) To the extent that skills and strength are associated with labor market success as well as height, such compensatory practices would dampen the association between height and earnings.
III. Data and Descriptive Statistics
Our empirical analysis is based on a data set constructed by integrating registers from Statistics Sweden (SCB) and the Swedish National Service Administra-tion. The latter contains information on every individual living in Sweden in the year 1999 who enlisted in the military between 1984 and 1997.14 Our study population con-sists of all males who were 28–38 years old in 2003, who enlisted in the military, and for whom there is full information on relevant variables. Enlisting for the military is carried out during a two- day procedure and was mandatory for all male Swedish citi-zens the year they turn 18. Only those with severe handicaps, or institutionalized (due to mental disorders or being in prison), or living abroad, are exempted from enlist-ing.15 It should also be noted that a refusal to enlist results in
fi nes, and eventually in imprisonment. In order to avoid any confounding infl uence of ethnic discrimination, we restrict our analyses to native Swedish males—that is, those born in Sweden to Swedish- born parents.16 Given these restrictions, our study population covers about 92 percent of the total native male Swedish population in the relevant cohorts.
11. To be specifi c, a gene consists of two alleles, where a child randomly inherits one of the two alleles from each parent at the time of conception. (See, for instance, Fletcher and Lehrer 2011.)
12. There still remains the possibility, however, that the genes that affect height also directly affect earnings by some mechanism.
13. Height may also partly be determined by interactions between genes and environment, however. If there are important gene- environment interactions for height within families, the sibling approach would be less helpful in reducing bias.
14. The individuals had to live in Sweden during 1999 because many important variables, such as the enlist-ment information and the family information, are collected from the 1999 population data.
15. Because those in our sample enlisted during the years 1984–97, and earnings are followed up in 2003, we lose a small number of people due to death and emigration. There is no information available on why a particular individual did not enlist.
Our base sample consists of 468,312 individuals. Out of these, 96 percent had posi-tive annual earnings in 2003—that is, 448,702 individuals, which is the sample that we use in our analyses. Hence, there is very little attrition in the data and it more or less covers the entire native born male Swedish population. However, in the main part of the analysis we instead focus on variation between siblings, which reduces the sample to 145,210 individuals. Because the enlistment variables are measured by military personnel, and earnings by tax authorities, our results are not likely to be infl uenced by any reporting bias, which often plagues survey data.
Our measure of annual earnings takes into account income from work, self- employed income, and social insurance benefi ts such as sickness benefi ts and parental benefi ts for the year 2003 and is taken from the tax records. A sensitivity analysis presented in the online appendix, where only incomes from work and self- employed income constitute the measure of earnings, shows that the inclusion of social insurance benefi ts does not affect our results.
Cognitive skill is measured using Enlistment Battery 80, which is a test similar in style to the Armed Forces Qualifi cation Test (AFQT) in the United States and comprises four separate tests, Instructions, Synonyms, Metal Folding, and Technical Comprehension. The cognitive skill variable used in the analysis is a standardized ver-sion of the composite cognitive measure calculated by the military enlistment service, which ranges from one to nine.17
Noncognitive skills are measured through interviews carried out by certifi ed psy-chologists.18 The interview contains assessments of psychological stability and en-durance, capability of taking initiative, responsibility, and social competence. This evaluation results in a composite enlistment score of noncognitive skills, ranging from one to nine, which we then standardize in our analyses. Though the ultimate purpose of the interview is to evaluate the conscript’s ability to perform military service and to function in a war situation, it seems reasonable to assume that the character traits valued by the military psychologists (mentioned above), ought to be appreciated and rewarded also in the labor market.
Handgrip strength is measured as the maximum pressure exerted by the strongest hand squeezing a dynamometer. This variable is standardized when used in our analy-ses. Measuring handgrip strength is a rather cheap and simple procedure that correlates with the muscle strength of other parts of the body; it is therefore a common method for assessing overall muscle strength (for example, Gale et al. 2007).1920
17. The general intelligence factor, G, is the variable used in this study. For more information about the G factor, see Carroll (1993). The separate tests and the composite measure have a correlation above 0.9. 18. Exact details of this part of the enlistment process are not publically revealed and we are merely re-ferred to information on the intentions of the assessment procedure. It should be noted that our measure of noncognitive ability is a strong predictor of earnings, independently of cognitive skills. Lindqvist and Vestman (2011) provide a thorough discussion on the measure of noncognitive skills used in the enlistment process.
19. In the online appendix (at http: // jhr.uwpress .org / ) we also present the distributions for cognitive and noncognitive skills, as well as for muscle strength.
In our regressions, we control for age fi xed effects. Because 99 percent of the con-scripts enlisted at age 18 or 19 (86 and 13 percent, respectively), the age fi xed effects picks up any nonlinearity in the age profi le for earnings as well as anything specifi c for the enlistment year such as changes in the measurement of the enlistment variables. It is therefore reassuring that the results are insensitive to how we handle the age and age- when- enlisting variables; that is, including additional controls for age (fi xed ef-fects) when enlisting, or only including a control for linear age, does not change the results at all.
In a separate analysis, we are also interested in whether the height premium results from tall and short males being sorted into certain occupations or levels of education. For this purpose, we categorize the variable measuring occupation into 115 different occupational groups according to SSYK (Standard for Swedish Occupational Clas-sifi cation), a three- digit occupational classifi cation code similar to the international classifi cation (ISCO). These indicators are then entered as fi xed effects in the regres-sions. A similar procedure is done for education levels according to SUN (Standard for Swedish Educational Classifi cation).
It should be noted that almost everyone who enlisted during our study period also completed military service. For the vast majority of the study sample, the enlistment test results did not affect the decision on whether they would have to do military service or not. Instead, the tests merely infl uence the individual’s placement in the army, meaning that poorer results will typically lead to a less qualifi ed and meriting placement. In this respect the incentives to deliberately underperform in the tests are limited. Still, in the online appendix (http: // jhr.uwpress .org / ) we perform some sensi-tivity tests in order to examine the role of “enlistment fakers” in our results.
Our data also contain information on parental years of schooling and earnings in 1980. For about 12–13 percent of the sample, however, information is missing on these variables. Moreover, for some of the other explanatory variables, information is missing for certain individuals.21 When there is missing information in a cell, we use the variable mean and create an additional binary variable indicator taking on the value one when information is missing and zero otherwise.
Before moving on to the empirical part of our work, we also need to address the age at which height is measured. Both Persico, Postlewaite, and Silverman (2004) and Case and Paxson (2008a) use height measures at different ages in their earnings regressions. From this perspective, a potential limitation of our study is that it only captures height at age 18. Hence, we are not able to assess the relative importance of height status in different childhood ages for earnings in adulthood. However, it should be noted that the association between height at a very young age and adulthood is in the order of 0.7. (See Case and Paxson 2008b.) In addition, if the association between height and earnings only refl ects unobserved factors related to labor market success, inclusion of these factors in the regression should cause the coeffi cient of height to approach zero (Case and Paxson 2008a). This will then be the case irrespective of whether single or multiple measures of height are used. Hence, having only a single measure of height is less problematic, because our aim is to disentangle the importance
of family environment, cognitive skills, noncognitive skills and handgrip strength, respectively, for the height premium.
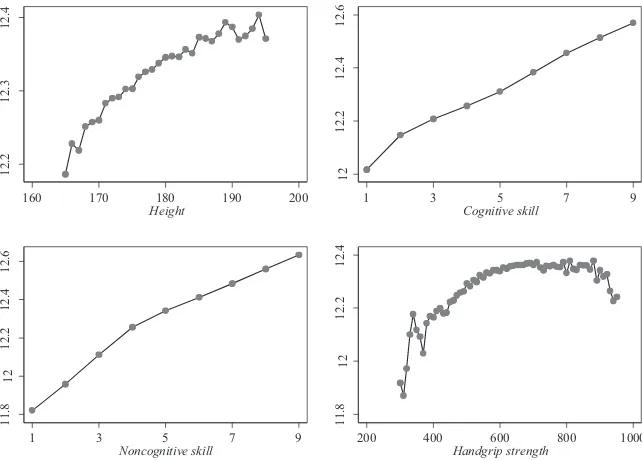
The distributions for our key variables (log) earnings and height (at age 18) for the total population are illustrated in Figure 1. The fi gure shows that earnings rise with height across the entire height distribution and that the earnings per height rise is rather uniformly distributed in the midsection of the height distribution, but is more pronounced below than above mean height.
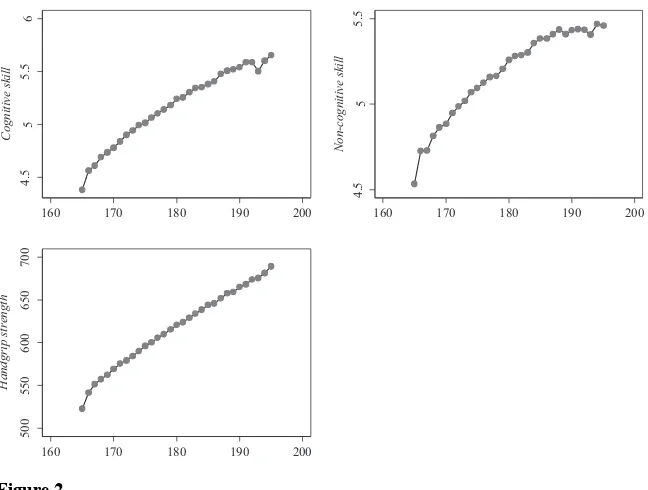
We next address the raw associations between our main explanatory variables and earnings. Figure 1 shows that cognitive and noncognitive skills are strongly, posi-tively, and rather linearly associated with earnings. The relationship between strength and earnings is more concave implying that the positive association weakens in the upper part of the strength distribution. Also, cognitive and noncognitive skills as well as strength correlate positively with height, as shown in Figure 2. Hence, the two measures of mental capacity as well as strength are associated with both height and earnings in a bivariate analysis. Descriptive statistics of the key variables used in the
Figure 1
Logarithm of average annual earnings by height, cognitive skill, noncognitive skill, and handgrip strength. Total population. 28–38 years old in 2003
Notes: The upper- left graph shows average earnings for each centimeter in height. Cognitive skill is the enlistment test score in cognitive ability and the upper- right graph shows average earnings for every value of the cognitive test score (1–9). Noncognitive skill is the psychological evaluation when enlisting and the lower- left graph shows average earnings for every value of the noncognitive measure (1–9). The lower- right graph shows average earnings for every integer of the handgrip strength score.
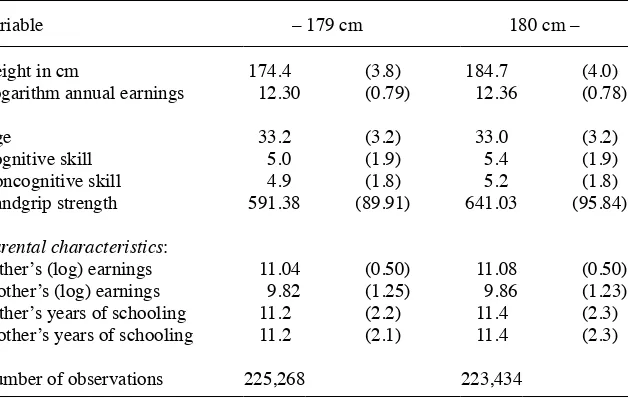
empirical analysis are given in Table 1 for those below and above the median height of 179 cm (5 feet 10 inches).
In the empirical analysis we control for family fi xed effects, hence, using only variation between brothers to identify the earnings- height relationship. As shown in Figure 3, there is a fairly large variation in height, cognitive, and noncognitive skill between brothers.22
IV. Main Results
We start out with the full set of 448,702 observations, including only height and age in the earnings regression; see Table 2. This specifi cation (Model A) serves as our benchmark (henceforth referred to as the “crude” association between height and earnings) and shows that a 10 centimeter increase in height is associated
Figure 2
Average cognitive skill, noncognitive skill and handgrip strength by height. Total population. 28–38 years old in 2003
Notes: The height variable has been trimmed at the 1st and 99th percentile. Cognitive skill is the enlistment test score in cognitive ability, Noncognitive skill is the psychological evaluation when enlisting, and
Handgrip strength is the enlistment test result when squeezing a dynamometer with the strongest hand. The graphs show average skills / strength for each centimeter in height.
22. Descriptive statistics for the sample of brothers is found in Table A1 in the online appendix.
with 6 percent higher earnings.23 In Columns B through H, various variables that may act as either controls or mediating factors in the height- earnings relationship are added. The row in Table 2 denoted “Reduction (%) in the Model A height- earnings as-sociation” contains information about how much the magnitude of this crude estimate is reduced in each subsequent model.
The height- earnings association is slightly reduced—by about one- sixth (to 0.052)—when adding parental socioeconomic characteristics to Model A; see Column B. Parental background, in terms of income and schooling, thus seem to play some role for the height- earnings relationship of their sons.
There may also be unobserved factors operating at the family level that plays an even greater role for the height- earnings relationship (for example, genetics, fam-ily practices, values, and norms). In order to further investigate the role of famfam-ily background, we next turn to our sibling sample. We start by running OLS regressions, without fi xed effects, in order to check if we obtain the same crude height- earnings relationship in this sample as for the full sample; see Column C. The estimated height coeffi cient is actually identical to the one obtained for the full sample. This
Table 1
Descriptive Statistics of the Population Divided at Median Height. Men 28–38 Years Old, 2003.
Variable – 179 cm 180 cm –
Height in cm 174.4 (3.8) 184.7 (4.0)
Logarithm annual earnings 12.30 (0.79) 12.36 (0.78)
Age 33.2 (3.2) 33.0 (3.2)
Cognitive skill 5.0 (1.9) 5.4 (1.9)
Noncognitive skill 4.9 (1.8) 5.2 (1.8)
Handgrip strength 591.38 (89.91) 641.03 (95.84)
Parental characteristics:
Father’s (log) earnings 11.04 (0.50) 11.08 (0.50)
Mother’s (log) earnings 9.82 (1.25) 9.86 (1.23)
Father’s years of schooling 11.2 (2.2) 11.4 (2.3) Mother’s years of schooling 11.2 (2.1) 11.4 (2.3)
Number of observations 225,268 223,434
Notes: Standard deviations in parentheses. The variables measuring cognitive skills, noncognitive skills, and handgrip strength are standardized when used in the empirical analysis.
is reassuring and shows that our sibling sample is likely representative of the greater sample.24
When we introduce sibling fi xed effects (Model D), and thus account for unob-served factors at the family level, the magnitude of the height coeffi cient is reduced from 0.062 to 0.042. This suggests that factors operating at the family level explain about one- third of the crude relationship between height and earnings or, correspon-dently, that the height coeffi cient is upward biased by almost 50 percent when not ac-counting for family background. Moreover, these results suggest that it is both parental socioeconomic factors as well as other circumstances at the family level that matters for the height- earnings relationship.
Next we turn to one of the main themes of the paper: the role played by cognitive and noncognitive skills. Starting with cognitive ability, and holding family background constant, the results from Model E clearly show that this is an important determinant
Figure 3
The distribution of the within- family difference in height, cognitive, and noncognitive skills
Notes: The within- family difference is calculated as the difference between the maximum and minimum value for each variable—that is, between brothers. 92 percent of the data consists of just two brothers within a family.
24. Further, the reductions in the height premium that follows when introducing the explanatory variables— that is, cognitive and noncognitive skills and strength—are similar when analyzing the total data and the sibling data. (See Lundborg, Nystedt, and Rooth 2009.)
0
.0
5
.1
.1
5
0 5 10 15 20
Height
0
.1
.2
.3
.4
0 2 4 6 8
Cognitive skill
0
.1
.2
.3
.4
0 2 4 6 8
Table 2
The Height- Earnings Association per 10 cm Height Increase. Men 28–38 Years Old, 2003. Logarithm of Annual Earnings.
Variable A B C D E F G H
Height 0.062***
(0.002)
0.052*** (0.002)
0.062*** (0.003)
0.042*** (0.006)
0.028*** (0.006)
0.022*** (0.005)
0.015*** (0.006)
0.009 (0.006) Parental characteristics
Father’s (log) earnings — 0.132*** (0.003)
— — — — — —
Mother’s (log) earnings — 0.001 (0.001)
— — — — — —
Father’s years of schooling — 0.007*** (0.001)
— — — — — —
Mother’s years of schooling — 0.008*** (0.001)
— — — — — —
Cognitive skill — — — — 0.101***
(0.004)
0.077*** (0.004)
0.077*** (0.004)
(0.019)*** (0.004)
Noncognitive skill — — — — — 0.075***
(0.003)
0.074*** (0.003)
157 Reduction (%) in the Model A
height- earnings association
16 0 32 55 65 76 85
Occupation fi xed effects No No No No No No No Yes
Sibling fi xed effects No No No Yes Yes Yes Yes Yes
R squared 0.02 0.03 0.02 0.02 0.04 0.05 0.05 0.20
Number of cases 448,702 448,702 145,210 145,210 145,210 145,210 145,210 145,210
of earnings, since a one standard deviation increase in cognitive ability is associated with 10 percent greater earnings. Controlling for cognitive skill also further reduces the magnitude of the height coeffi cient by more than one- third, from 4.2 to 2.8 per-cent. This also implies that even when controlling for family background, neglect of incorporating this type of skill in the earnings equation still biases the estimated height premium upward by 50 percent. Under the assumption that this type of skill, and family background, are the only relevant control variables, we would thus be left with a statistically signifi cant height premium of 2.8 percent. This also means that the estimate of the height premium in Columns A and C was upward biased by more than 100 percent when not accounting for family background and cognitive skills.25,26
In order to understand the mechanisms behind the height premium that remains after including our controls, we next add noncognitive skill as a mediating factor between height and earnings to the regression (Model F), which further reduces the magnitude of the height coeffi cient. Assuming that the height coeffi cient of 2.8 in Model E
re-fl ects the causal effect of height on earnings, our results imply that 20 percent of this effect runs via formation of noncognitive skills.
To what extent does also muscle strength, as measured through handgrip strength, matter for the height- earnings relationship? Though it is uncertain whether handgrip strength should mainly be regarded as a control or mediating variable, adding it to the regression should at least indicate if it matters at all for the height- earnings relation-ship. Doing so (see Column G), we fi rst note that it is a less important predictor of earnings than our skills measures (an increase in handgrip strength by one standard deviation increases earnings by 1.3 percent). Moreover, the coeffi cients of cognitive and noncognitive skills almost remain unchanged by its inclusion. Including muscle strength does, however, result in an additional decline in the magnitude of the height coeffi cient from 2.2 to 1.5, or by about 30 percent. If one believes that muscle strength is a mediating factor between height and earnings, this would imply that about half of the height premium in Model E is mediated through noncognitive skills and strength. Alternatively, if one views handgrip strength as mainly a control variable, the esti-mated height premium in Model F would be upward biased by almost 50 percent.27 Irrespective of the more precise pathways by which strength is linked to the earnings relationship, it does seem to be an important trait, also in the Western world. We leave the correct interpretation to future research.28
25. We also examined if the returns to height are smaller or larger at higher levels of cognitive skills by interacting height with cognitive ability. The point estimate of the interaction term suggested that the returns were greater at higher ability levels, but the estimate was rather small and statistically insignifi cant. 26. For a subsample of the data we have information on the four subtests of the composite cognitive test measure. Using this data we study whether the impact on the height premium varies depending on if more
fl uid- type cognitive tests (spatial ability and logic), which may be less affected by schooling, or less fl uid tests (synonyms and technical comprehension) are controlled for. We fi nd this not to be the case.
27. One could be worried that the noncognitive skill and handgrip strength variables are measuring the same underlying construct since both are expected to capture aspects of noncognitive skills at age 18. Their correlation is only 0.16, however.
Summing up, our results so far shed new light on why tall persons earn more. More than half of the crude relationship is explained by factors that are related to both height and earnings, but not caused by height, such as family background and cogni-tive skills. This latter result thus supports the hypothesis of Case and Paxson (2008a) that tall people earn more partly because they are smarter. Our results also support those of Persico, Postlewaite, and Silverman (2004), however, since we fi nd that non-cognitive skills as a mediating factor explains an important part of the estimated height premium. Adding muscle strength to the equation, our control and mediating variables explains about three- quarters of the crude relationship between height and earnings.
Although we are able to explain a large part of the crude height- earnings relation-ship, there still remains a signifi cant height coeffi cient of 1.5 percent. As we soon will show in Section IV.A below, the remaining height premium seems to be caused by very short males earning less than others. One mechanism through which this result could arise would be if short people sort into lower paid occupations. To shed some light on this possibility, Model H adds occupation fi xed effects to Model G, which results in a further reduction of the height coeffi cient by more than 40 percent to 0.009, and the coeffi cient is now statistically insignifi cant. The crude relationship between height and earnings in Model A is now reduced by more than 85 percent and we are thus able to explain almost the entire crude relationship between height and earnings.29 The sorting of short men into lower- paid occupations may refl ect discrimination, where short men shy away from occupations where employers are perceived to discriminate against them. If this is the case, an important part of the height premium would refl ect tastes for tall people, where sorting into occupations based on one’s height is an important mediating mechanism.30
A. A Nonlinear Height Premium
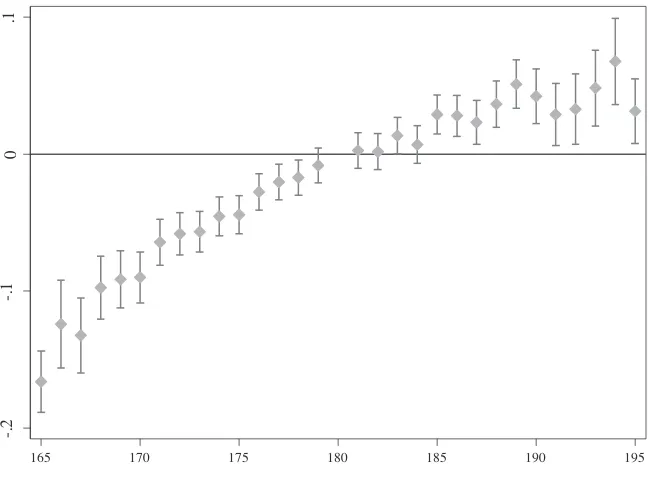
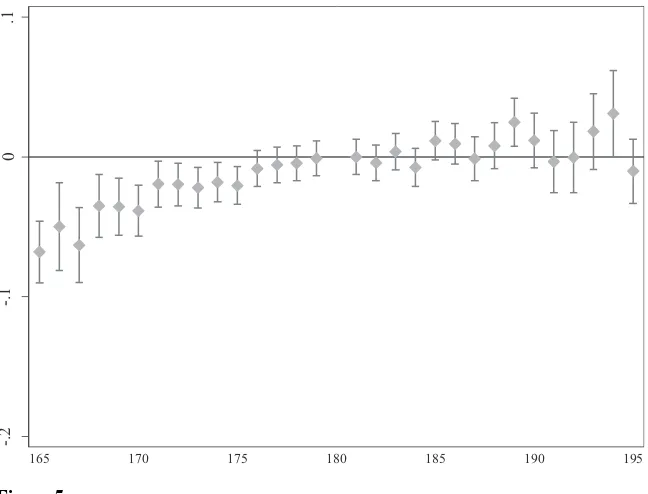
In this section, we relax the restriction of a linear height- earnings relationship by fi rst estimating the relationship between height and earnings using centimeter fi xed effects. Figure 4, which corresponds to the Model A specifi cation of Table 2, shows that the relationship between height and earnings is slightly concave and reveals that what appears as a height premium may rather be interpreted as a penalty for being short because most of the action occurs at the lower part of the height distribution. As more explanatory variables are introduced into the model, the height- earnings relationship weakens in magnitude, but the concavity remains, as shown in Figure 5.31
Estimating the model with centimeter fi xed effects also for the sibling sample is not informative because the confi dence intervals become too wide. Instead, we es-timate piecewise linear models using the visible breaks in the height premium at
29. It is also possible that there is sorting into different education levels by height. The height coeffi cient is only reduced from 0.015 to 0.014, however, when adding education dummies to Model G. Moreover, adding education dummies to Model H does not affect the estimated height coeffi cient.
30. In order to illustrate which occupations short people tend to sort into, we have computed the fractions of people below 170 cm of height per occupational group (results not shown). Short stature is most frequent (11 percent) in the low- skill service sector consisting of cleaners, restaurant assistants, newspaper carriers, etc., whereas it is most uncommon (5 percent) in managerial positions in mid- and large- scale enterprises (such as CEOs, executive managers and directors).
172 / 173, 180 / 181, 188 / 189 revealed in Figure 4.32 This analysis con
fi rms that the height- earnings association is more pronounced the lower the stature, being almost twice as large at the 165–172 height interval compared to the 173–180 height inter-val, while there is no signifi cant height- earnings association above 188 centimeters (Table 3, Model B). As we introduce the skill and strength variables, the relation-ship between height and earnings weakens somewhat at all intervals, but the main picture remains. For instance, the estimates for Model E shows that earnings is only sensitive to variations in height below mean stature (180cm), and the height- earnings association is still the highest for the shortest category, implying that earnings rise with 0.5 percent per centimeter increase in height. However, as for the main analysis in Table 2, all height interval estimates become statistically insignifi cant when we introduce occupation fi xed effects. See Model F, which indicates that an important mechanism of the remaining height premium is to be found in the sorting into different occupations by height.
To conclude, the remaining height premium is mainly due to very short people having low earnings. Hence, in the search for what the remaining height premium
Figure 4
The height- earnings association. Total population data. Model A
Notes: Earning differences relative to height = 180 cm (reference line). Data end coded at bottom / top 1 percent of the height distribution. This regression model corresponds to Model A in Table 2, exchanging the continuous height variable with centimeter fi xed effects.
32. We owe thanks to one of the referees for suggesting using the piecewise linear regression model.
-.2
-.1
0
.1
constitutes, one has to look for theories explaining the earnings- height association at the bottom of the height distribution. We will return to this issue in our discussion.
In order to check the robustness of our results we have conducted a range of sen-sitivity analyses (the implications of which are thoroughly presented in the online appendix available at http: // jhr.uwpress .org / ). Summarizing, the results do not change to any important extent when we exclude a) individuals with low earnings (below 100’ SEK), b) sickness benefi ts from the income measure, c) potential enlistment “fakers” (that is, people scoring very low on any of the analyzed enlistment tests), d) people who were under the age of 30 in 2003 (when income was measured), or e) subdivide the data according to sector of employment (public or private).
V. Summary and Discussion
We show that an additional 10 centimeters in height, which is approxi-mately 4 inches,33 is associated with 6 percent higher annual earnings among Swedish
Figure 5
The height- earnings association. Total population data. Model G
Notes: This regression model uses the full set of variables (corresponds to Model G in Table 2), exchanging the continuous height variable with centimeter fi xed effects.
-.
2
-.1
0
.1
165 170 175 180 185 190 195
T
he
J
ourna
l of H
um
an Re
sourc
es
Table 3
The Height- Earnings Association at Different Height Intervals. Men 28–38 Years Old, 2003. Logarithm of Annual Earnings. Sibling Sample.
Height- earnings association
(per 10 cm increase) at: A B C D E F
165–172 centimeters 0.132*** 0.098*** 0.071*** 0.058** 0.050** 0.033
(0.018) (0.023) (0.023) (0.023) (0.023) (0.021)
173–180 centimeters 0.072*** 0.050*** 0.037*** 0.030** 0.023** 0.015
(0.009) (0.013) (0.013) (0.013) (0.013) (0.012)
181–188 centimeters 0.041*** 0.034** 0.022 0.016 0.010 0.001
(0.010) (0.014) (0.014) (0.014) (0.014) (0.013)
189–195 centimeters 0.013 –0.031 –0.035 –0.035 –0.040 –0.015)
(0.019) (0.026) (0.026) (0.026) (0.026) (0.024)
Sibling fi xed effects No Yes Yes Yes Yes Yes
Occupation fi xed effects No No No No No Yes
Number of cases 145,210
males. This is somewhat lower than the 10 percent height premium in wages found by Persico, Postlewaite, and Silverman (2004) and Case and Paxson (2008a), but could probably be explained by the institutional setting in Sweden, with the existence of “solidarity” wages and a rather narrow wage distribution.34 It should be noted that the association between height and paycheck in the three countries (wages in the United States, United Kingdom and earnings in Sweden) corresponds to the return to one ad-ditional year of schooling in the respective countries—about 10 percent in the United States and United Kingdom (Card 1999) and 6 percent in Sweden (using the data explored in this study). Hence, the height- earnings association in Sweden, though somewhat lower than the wage premiums in the United States and United Kingdom, is still substantial.35
We then turned to the reasons why tall people earn more. Based on the argumentation and evidence presented in the literature we divided the mechanisms into three distinct categories; control factors (family background and cognition), mediating factors (non-cognitive skill) and preferential treatment (discrimination). In addition, we brought in an additional factor, muscle strength, where there is greater uncertainty about its role.
Our results show that there is not one story as to why tall people earn more. Instead, our results support both the fi ndings of Persico, Postlewaite, and Silverman (2004) and Case and Paxson (2008a). As in the latter study, we fi nd that neglect of controlling for cognitive skills severely biases the estimate of the height premium upward. We also show that this result holds even when accounting for family background, which in itself reduces the magnitude of the height coeffi cient by one- third. But also non-cognitive skills matters, as was hypothesized by Persico, Postlewaite, and Silverman (2004). Our results suggest that noncognitive skill mediates a substantial part (about one- fi fth) of the estimated height premium once cognitive skill and family background is controlled for.
As far as we know, the only other paper that has assessed both the role of cognitive and noncognitive skills is Schick and Steckel (2010). Whereas their data is richer in terms of the number of variables collected and the number of tests administrated at different ages, our data has clear advantages in terms of sample size, access to sibling data, and measurement of height and earnings. It is therefore interesting to note the qualitatively similar results obtained in both studies regarding the importance of both types of skills for understanding the height- earnings relation.
Somewhat surprisingly, we also fi nd that muscular strength, also measured at enlist-ment, matters for the estimated height- earnings association. While we do not know whether muscle strength should be regarded as a control variable or mediating vari-able, including it into the earnings equation further reduces the magnitude of the height premium. With our control variables and mediating variables, we are able to account for three quarters of the crude age- adjusted relationship between height and earnings.
34. Sweden has a much more compressed wage structure than the United States. In Sweden, the 90th
per-centile earns approximately twice as much as the 10th percentile, whereas in the United States they earn fi ve
times as much.
Incorporating all our control variables and mediators into the earnings equation, we are still left with a height premium of about 1.5 percent. Closer inspection reveals that this is due to very short people being penalized rather than tall people being re-warded. This may refl ect discrimination against short people in the labor market and we show that this remaining penalty of being short is explained by short people sorting into low- paid occupations. Such behavior may arise if employers discriminate against short people or if short people shy away from perceived discriminatory employers. While discrimination is possible,36 we cannot rule out the remaining “penalty” instead is a result of some unobservable, productivity- enhancing factor being correlated with stature. For instance, if cognition and height are correlated via underlying nutritional and genetic factors, statistical discrimination against short people may arise, and as noted by Case and Paxson (2008a) such discrimination ought to be stronger early in the labor market career.
On a general level, the results presented underline the importance of cognitive and noncognitive skills for understanding how stature relates to labor market success. From this perspective, our results emphasize the importance of benefi cial nutritional and social conditions during early stages of life. If inherently short or physically weak children are discriminated against by being excluded from taking on responsibilities or participating in activities that builds leadership and other types of noncognitive skill, an implication of our results is that school policies, aiming at giving children equal opportunities, should be considered. Moreover, early life interventions that targets nutrition and other factors that are inputs in the production of both cognitive skills and height could lessen the association between a person’s stature and his labor market success. This conclusion is further strengthened by our result suggesting that family background explain a large part of the height- earnings association. Clearly, there is something in the family background of certain children related to both short stature and low earnings potential that does not seem to run through skills, strength, or paren-tal income and schooling.
References
Allen, Hana Lango, Karol Estrada, Guillaume Lettre, Sonja I. Berndt, Michael N. Weedon, Fernando Rivadeneira, Cristen J. Willer, Anne U. Jackson, Sailaja Vedantam, Soumya Raychaudhuri, Teresa Ferreira, Andrew R. Wood, Robert J.Weyant, Ayellet V. Segrè, Eliza-beth K. Speliotes, Eleanor Wheeler, Nicole Soranzo, Ju- Hyun Park, Jian Yang, and Daniel Gudbjartsson et al. 2010. “Hundreds of Variants Clustered in Genomic Loci and Biological Pathways Affect Human Height.” Nature 467(7317):832–38.
Almond, Douglas, and Janet Currie. 2011. “Human Capital Development Before Age Five.” In Handbook of Labor Economics, Vol. 4, Part B, ed. Orley Ashenfelter and David Card, 1315–486. Amsterdam: North Holland.
Antelius, Jesper, and Anders Björklund. 2000. “How Reliable are Register Data for Studies of the Return on Schooling? An Examination of Swedish Data.” Scandinavian Journal of Educational Research 44(4):341–55.
Behrman, Jere R., and Mark R. Rosenzweig. 2004. “Returns to Birthweight.” Review of Economics and Statistics 86(2):586–601.
Black, Sandra E., Paul J. Devereux, and Kjell G. Salvanes 2007. “From the Cradle to the Labor Market? The Effect of Birth Weight on Adult Outcomes.” Quarterly Journal of Economics
122(1):409–39.
Borghans, Lex, Angela L. Duckworth, James J. Heckman, and Bas ter Weel. 2008. “The Eco-nomics and Psychology of Personality Traits.” Journal of Human Resources 43(4):972–1059. Böhlmark, Anders, and Matthew Lindquist. 2006. “Life- Cycle Variations in the Association
Between Current and Lifetime Income: Replication and Extension for Sweden.” Journal of Labor Economics 24(4):879–96.
Card, David. 1999. “The Return to Education.” In Handbook of Labor Economics, eds. Orley Ashenfelter and David Card, 1801–63. Amsterdam: Elsevier.
Carroll, John B. 1993. Human Cognitive Abilities. A Survey of Factor- Analytic Studies. Cam-bridge: University Press.
Case, Anne, and Christine Paxson. 2008a. “Stature and Status: Height, Ability, and Labor Market Outcomes.” Journal of Political Economy 116(3):499–532.
———. 2008b. “Height, Health and Cognitive Function at Older Ages.” American Economic Review: Papers and Proceedings 98(2):463–7.
Cawley, John, James J. Heckman, and Edward Vytlacil. 2001. “Three Observations on Wages and Measured Cognitive Ability.” Labour Economics 8(4):419–42.
Cunha, Flavio, and James J. Heckman. 2008. “Formulating, Identifying and Estimating the Technology of Cognitive and Noncognitive Skill Formation.” Journal of Human Resources
43(4):738–82.
Everett, Peter W., and Frank D. Sills. 1952. “Relationship of Grip Strength to Stature, Somatotype Components, and Anthropometric Measurements of Hand.” Research Quarterly
23(2):161–66.
Fletcher, Jason M., and Steven F. Lehrer. 2011. “Genetic Lotteries within Families.” Journal of Health Economics 30(4):647–59.
Frieze, Irene H., Josephine E. Olson, and Deborah C. Good. 1990. “Perceived and Actual Discrimination in the Salaries of Male and Female Managers.” Journal of Applied Social Psychology 20(1):46–67.
Gale, Catharine R., Christopher N. Martyn, Cyrus Cooper, and Avan A. Sayer. 2007. “Grip Strength, Body Composition, and Mortality.” International Journal of Epidemiology
36(1):228–35.
Gale, Catharine R., Christopher N. Martyn, Samantha Kellingray, Richard Eastell, and Cyrus Cooper. 2001. “Intrauterine Programming of Adult Body Composition.” Journal of Clinical Endocrinology and Metabolism 86(1):267–72.
Gallup Andrew C., Daniel D. White, and Gordon G. Gallup, Jr. 2007. “Handgrip Strength Predicts Sexual Behavior, Body Morphology, and Aggression in Male College Students.”
Evolution and Human Behavior 28:423–29.
Hamermesh, Daniel S., and Jeff E. Biddle. 1994. “Beauty and the Labor Market.” American Economic Review 84(5):1174–94.
Harper, Barry. 2000. “Beauty, Stature and the Labour Market: A British Cohort Study.” Oxford Bulletin of Economics and Statistics 62(1):771–800.
Heckman, James J., and Yona Rubinstein. 2001. “Importance of Noncognitive Skills: Lessons from the GED Testing Program.” American Economic Review 91(2):145–49.
Heckman, James J., Jora Stixrud, and Sergio Urzua. 2006. “The Effects of Cognitive and Noncognitive Abilities on Labor Market Outcomes and Social Behavior.” Journal of Labor Economics 24(3):411–82.
Kuhn, Peter, and Catherine Weinberger. 2005. “Leadership Skills and Wages.” Journal of Labor Economics 23(3):395–436.
Kumlin, Johanna. 2007. “The Sex Wage Gap in Japan and Sweden: The Role of Human Capital, Workplace Sex Composition, and Family Responsibility.” European Sociological Review 23(2):203–21.
Lindqvist, Erik. 2012. “Height and Leadership.” Review of Economics and Statistics
94(4):1191–96.
Lindqvist, Erik, and Roine Vestman. 2011. “The Labor Market Returns to Cognitive and Non-cognitive Ability: Evidence from the Swedish Enlistment.” American Economic Journal: Applied Economics 3(1):101–28.
Loh, Eng Seng. 1993. “The Economic Effects of Physical Appearance.” Social Science Quar-terly 74(2):420–38.
Lundborg, Petter, Nystedt, Paul, and Dan- Olof Rooth. 2009. “The Height Premium in Earn-ings: The Role of Physical Capacity and Cognitive and Non- Cognitive Skills.” IZA Discus-sion Papers #4266. Bonn: Institute for the Study of Labor.
Nordin, Martin, and Dan- Olof Rooth. 2009. “The Employment and Income Gap Between Na-tives and Second- Generation Immigrants in Sweden.” Scandinavian Journal of Economics
111(3):487–510.
Persico, Nicola, Andrew Postlewaite, and Dan Silverman. 2004. “The Effect of Adolescent Experience on Labor Market Outcomes: The Case of Height.” Journal of Political Economy
112(5):1019–53.
Richards, Marcus, Rebecca Hardy, Diana Kuh, and Michael E.J. Wadsworth. 2002. “Birth-weight, Postnatal Growth and Cognitive Function in a National UK Birth Cohort.” Interna-tional Journal of Epidemiology 31(2):342–48.
Rooth, Dan- Olof. 2009. “Obesity, Attractiveness, and Differential Treatment in Hiring. A Field Experiment.” Journal of Human Resources 44(3):710–35.
———. 2011. “Work Out or Out of Work—The Labor Market Return to Physical Fitness and Leisure.” Labour Economics 18(3):399–409.
Schick, Andreas, and Richard H. Steckel. 2010. “Height as a Proxy for Cognitive and Non- Cognitive Ability.” NBER Working Paper No. 16570.
Silventoinen, Karri, Patrik K.E. Magnusson, Per Tynelius, Jaakko Kaprio, and Finn Rasmus-sen. 2008. “Heritability of Body Size and Muscle Strength in Young Adulthood: A Study of One Million Swedish Men.” Genetic Epidemiology 32(4):341–49.
Steckel, Richard H. 1995. “Stature and the Standard of Living.” Journal of Economic Litera-ture 33(4):1903–40.
———. 2009. “Heights and Human Welfare: Recent Developments and New Directions.”
Explorations in Economic History 46(1):1–23.
Thomas, Duncan, and John Strauss. 1997. “Health and Wages: Evidence on Men and Women in Urban Brazil.” Journal of Econometrics 77(1):159–85.