ISSN 2286-4822 www.euacademic.org
Impact Factor: 3.1 (UIF) DRJI Value: 5.9 (B+)
The Molecular Genetic Diversity of Murrah and
Mehsana Buffalo Breeds through ISSR Marker
MTHNA BASHAR ABDULAALI DR.RAM PAL SINGH (Supervisor) DR.NEERAJ (Co-advisor) Department of Animal Husbandry and Dairying Sam Higginbottom Institute of Agriculture, Technology and Sciences (Deemed-to-be-University), Allahabad, U.P. India
Abstract:
An investigation on molecular diversity of Murrah and Mehsana buffalo breeds was done to check primer discriminatory power, banding pattern of primer among fifteen accessions through ISSR. The DNA isolated from 10 ml blood by using the procedure suggested by Hoelzel (1992) who found sufficient for good quality of ISSR analysis. Out of 20 primers used only 15 produced amplicons. The total amplicons generated were 141 with 122 being polymorphic with 86.52% polymorphism. Among Primer A and Primer D could distinguish all the genotypes, the highest discriminatory index (1.0) was obtained. The Jaccard’s similarity coefficient generated on the basis of ISSR profiling showed an average similarity of 45% among all the 10 accessions. The diversity range from 23% to 77%. The SAHN clustering based on UPGMA algorithms has put genotypes in three groups, first one with 4 accessions and second one with 3 accessions and third group with 2 accessions and one accession alone. In conclusion buffalo accession harbors a good diversity. It would be valuable resource for breeding purpose.
Introduction:
The domestic or water buffalo (Bubalus bubalis) belongs to sub-family bovini of the sub-family bovidae genera bubalus and species arni or wild Indian buffalo. Buffalo are believed to have been domesticated around 5000 years ago in the Indus Valley. The water buffalo can mainly be classified as river and swamp type. The domestication of swamp buffalo took place independently in China about 1000 years later. The movement of buffalo to other countries both east and west has occurred. Some of the well-known dairy breeds of buffalo found in India and Pakistan are Murrah, Nili-Ravi, Surti, Jaffarabadi, Bhadawari, Mehsana, Godawari and Pandharpuri. Little attention has been paid to buffalo improvement programs so that despite potential advantages.
Buffalo can live in tropical, humid and dry environments and Buffalo can be adapted in different situations. On hot days buffalo prefer wallowing in mud, and therefore Buffalo prefers rivers and ponds. Buffalo has ability to digest efficiently food having poor nutritional value, such as straw of Hayes or rice. Due to the large size of the rumen, and rumen flora digest more numerous than cows. After onset of heat male combines with female and after a gestation period of 310 days, the female deliver calf and take care about, up to two years from birth.
Mehsana Buffalo: Mehsana breed has been developed from crosses between Murrah and Surti and is present in Mehsana, Sabarjanda and Banaskanta districts of Gujarat state . Animals are of medium size with low set deep body. The head is longer and heavier. The horns usually are less curved at the end compared to Murrah but are longer and could be of irregular shape. The udder is well shaped, the colour is usually black to gray, with white markings often on face, legs or tail-tip. The milk yield is 1200 to 1500 kg per lactation.
Review of Literature:
Molecular markers:
The markers revealing variations at DNA level are referred to as the molecular markers. Molecular markers are found at specific locations of the genome. They are used to flag, the position of a particular gene or the inheritance of a particular characteristic.
Classification of molecular marker:
The markers revealing variations at the DNA level are referred to as the molecular markers and on the basis of techniques used for their detection; these have been classified into two major categories: hybridization-based markers and PCR-based markers.
The hybridization-based markers:
The polymorphisms are then visualized as hybridization bands. The individuals carrying different allelic variants for a locus will show different banding patterns. Hybridization can also be carried out with the probes (e.g., genomic or synthetic oligonucleotide) for the different families of hypervariable repetitive DNA sequences namely, minisatellite (Jeffreys et al., 1985), simple repeats (Ali et al., 1986), Variable Number of Tandem Repeats (VNTR) (Nakamura et al., 1987) and microsatellite (Litt and Luty, 1989) to reveal highly polymorphic DNA Fingerprinting Patterns (DFP).
The PCR-based markers:
These have, however, removed the necessity of probe-hybridization step and have led to the discovery of several useful and easy-to-screen methods. Depending on the type of primers (i.e., primers of specific sequences targeted to a particular region of a genome or primers of arbitrary sequences) used for PCR, these markers can be further sub-divided into the following 2 groups:
The sequence-targeted PCR assays:
In this assay system, a particular fragment of interest is amplified using a pair of sequence-specific primers. In this category, PCR-RFLP or Cleaved Amplified Polymorphic Sequence (CAPS) analysis is a useful technique for screening of sequence variations that give rise to the polymorphic RE sites. Such analysis involves amplification of a specific region of DNA encompassing the polymorphic RE site and digestion of the amplified DNA fragment with the respective RE.
Refractory Mutation System (ARMS) (Newton et al., 1989) and Oligonucleotide Ligation Assay (OLA) (Landegren et al., 1988) are used. These assays are based on the principle of high specificity of PCR to selectively amplify specific alleles using primers that match the nucleotide sequence of one but mismatch the sequence of other allele. The sequence-targeted PCR approach is also employed to reveal Simple Sequence Length Polymorphism (SSLP), using a pair of primers that flank the Simple Sequence Repeat (SSR) motifs. If cloned and sequenced microsatellite loci can be subjected to PCR amplification and such microsatellite loci can be recovered by PCR such loci are termed as Sequence Tagged Microsatellite Site (STMS) (Beckmann and Soller, 1990) markers.
The arbitrary PCR assays:
In this assay system, however unlike the standard PCR protocol, randomly designed single primer is used to amplify a set of anonymous polymorphic DNA fragments. It is based on the principle that when the primer is short (usually 8-10 mm) there is a high probability that priming may take place at several sites in the genome that are located within amplifiable distance and are in inverted orientation. Polymorphism detected using this method is called Randomly Amplified Polymorphic DNA (RAPD) (Williams et al., 1990). Based on this principle, several techniques which do not require any prior sequence knowledge have been developed. However, they differ in number and length of primers used, stringency of PCR conditions and the method of fragment separation and detection. In Arbitrary Primed PCR (AP-PCR) (Welsh and McClelland, 1990), slightly longer primer is used (e.g., universal M13 primer) and amplification products are detected by radiactive or nonradioactive method following polyacrylamide gel electrophoresis.
which reveals relatively greater number of amplification fragments by polyacrylamide gel electrophoresis and silver staining. All these techniques having similar features can be described by a common term Multiple Arbitrary Amplicon Profiling (MAAP) (Caetano-Anolles et al., 1992). Besides these, a number of modifications of the basic MAAP assays (namely, template endonuclease cleavage MAAP and RAPD-RFLP) have been developed as well.
In addition to arbitrary primers, semi-arbitrary primers designed on the basis of RE sites or sequences that are interspersed in the genome such as repetitive sequence elements (Alu repeats or SINEs), microsatellites and transposable elements are also used. In the Amplified Fragment Length Polymorphism (AFLP) assay (Zabeau, 1993), template DNA is digested with two REs and the resulting restriction fragments are then ligated with adapters and subsequently, PCR amplification is carried out using specially designed primers which comprise; a unique part corresponding to selective bases and a common part corresponding to the adapters and the RE site. Microsatellite-Primed PCR (MAP-PCR) assay is carried out using microsatellite as the primer.
Materials and Methods:
Amount of DNA (µg / µl) = A260 x 50 x dilution factor 1000
Statistical Analysis for Similarity Coefficient:
The scores (0 or 1) for each band obtained from photograph were entered in the form of a rectangular data matrix (qualitative data matrix). The pair-wise association coefficients were calculated from qualitative data matrix using Jaccard’s similarity coefficient. The equation for calculating Jaccard’s similarity coefficients ‘F’ between two samples A and B is:
f = nxy / (n1 – nz)
Where,
nxy = Number of bands common to sample A and sample B.
n1 = Total number of bands present in all samples.
nz = Number of bands not present in sample A or B but found
in other samples.
Cluster analysis for the genetic distance was then carried out using UPGMA (Unweighted Pair Group Method with Arithmetic Mean) clustering method. The genetic distances obtained from cluster analysis through UPGMA were used to construct a dendrogram, depicting the relationships of the accessions using computer program NTSYS pc version 2.02 (Rohlf, 1998).
Discriminatory power of primer:
d=1-
Where,
N – is the total number of accessions in the sample population s – is the total number of types of banding patterns obtained nj– is the number of accessions belonging to the jth type
The probability that a single accession sampled at random will belong to the jth group is n/N. The probability that two accessions sampled consecutively will belong to that group is nj (nj – 1)/N (N - 1). These probabilities were being summed for all the accessions to give the probability that any two consecutively sampled accessions will be of the same type. This summation can be subtracted from 1 to give the equation above. No correction factor for the relatively small sample size of accessions was made. The discriminatory power of each primer was calculated through on - line calculator available on the
web, the site of which is
(http://www.insilico.ehu.es/mini_tool/discriminatory_power). Depending on the type of banding patterns generated by each primer, each type of banding pattern was labeled with an alphabet. Thus, the capacity of each primer to generate different types of banding patterns and the frequency of each banding pattern in the 12 accessions was calculated.
Polymorphic Information Value:
Genetic diversity was calculated at each locus for allelic Polymorphism Information Content (PIC), based on allelic frequencies among all 12 accession analyzed. The PIC values for each RAPD were estimated by determining the frequency of alleles per locus using the following formula: PIC =1− Σ xi2
Results and Discussion:
DNA isolation, purification and ISSR analysis:
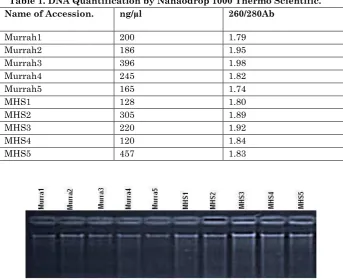
Blood was collected and prepared for DNA isolation by using the procedure suggested by Hoelzel (1992). Each accession 2ML blood was taken as source of DNA and stored in K3 EDTA tube for DNA isolation with ice cooling pack and treated with RNase to eliminate RNA. DNA concentration was measured by UV-absorbance method. The integrity of the isolated DNA was verified by visualization of DNA on Agarose gel (0.8%). A single sharp band was observed for isolated DNA for all the 12 accession. The quality of DNA was determined as the ratio A260/ A280, which ranged from 1.8 to 1.9, which is indicative of good quality DNA. (Table 1)
Table 1. DNA Quantification by Nanaodrop 1000 Thermo Scientific. Name of Accession. ng/µl 260/280Ab
Murrah1 200 1.79
Murrah2 186 1.95
Murrah3 396 1.98
Murrah4 245 1.82
Murrah5 165 1.74
MHS1 128 1.80
MHS2 305 1.89
MHS3 220 1.92
MHS4 120 1.84
MHS5 457 1.83
Discriminatory power and pic value of various primers:
The banding pattern generated and polymorphism reflected in these patterns was used to identify the accessions taken for present study. All the 15 amplifying primers produced 111 banding patterns for 10 different accessions ranging from 2 banding pattern primer E to 10 banding patterns Primer D and Primer A .The Primer D and Primer A primers produced unique patterns for all the ten accession; they could distinguish all the genotypes collectively. The ability of a primer to distinguish between unrelated accessions can be determined by the number of types (pattern types) defined by the primer and the relative frequencies of their types. We have calculated a single numerical index of discrimination (D) based on the probability that two unrelated genotypes amplified from the test population will be placed into different typing groups. The value of D is one when all the patterns are unique and 0 when patterns generated for all the varieties contain monomorphic bands.
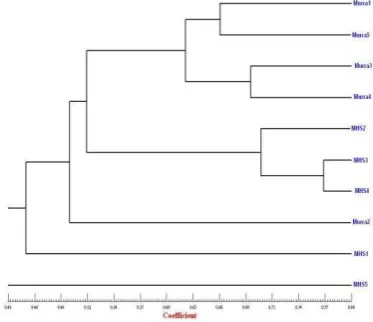
Genetic relationship among the accessions and cluster analysis:
Figure 4. Dendogram showing relationship among 10 buffalo accessions generated by UPGMA analysis based on 15 single ISSR primers amplicons.
Genetic similarity estimates based on ISSR banding patterns were calculated using method of Jaccard’s coefficient analysis (Figure 4). The similarity coefficient matrix generated was subjected to algorithm. “Unweighted Pair Group Method for Arithmetic Average (UPGMA)” to generate clusters using NTSYS 2.02 pc program (Rohlf, 1998). The dendrogram showing relationship among various accessions was constructed using these clusters (Figure 4). The Jaccard’s pair wise similarity coefficient values ranged from average similarity of 0.45 % and range between 33 % (between murrah5 and MHS5) to 77 % (between MHS3 and MHS4) among all the 10 accession of buffalo. Pair wise similarity was fixed between the 10 accessions, (See Jaccard’s similarity coefficient matrix) vice versa.
Murrah 4 and Murrah 5). Major Cluster two containing 3 accession (MHS2, MHS3 and MHS4). Third group’s minor groups have two accessions of MHS1 and MHS5. The Murrah 2 was found between Group two and groups 3.
Diversity within and between Groups of accession:
Figure 5. Jaccard’s Similarity coefficient developed from 15 ISSR primer amplicons generated amongst the five Murrah and five Mehsana buffalos.
The Murrah accession, minimum 49 % similarity (51% diversity) recorded between Murrah 2 and Murrah 4 and 69 % similarity (31 % diversity) recorded between Murrah 3 and Murrah 4.The Mehsana (MHS) accessionwas minimum 44 % similarity between MHS1 to MHS5 (56% diversity) and maximum similarity 77 % (23 % diversity) between MHS3 and MHS4. Between groups genetic similarity vs. diversity between groups was recorded 33% between Murrah 5 and MHS 5. Maximum 57% for Murrah 3and MHS 3.
Discussion:
the marker systems available for diversity study at DNA level is ISSR. The results obtained for molecular level studies to assess the genetic diversity have been discussed in the following section.
DNA isolation:
Intact high molecular weight nuclear DNA is essential for most of molecular studies. Though ISSR analysis can be performed with little sheared DNA, a minimum of intact templates are still needed. Earlier methods of DNA isolation involving sodium dodecyl sulfate (SDS) and various enzymes were not only costlier but also cumbersome, time consuming and yield less plant DNA. Blood was collected and prepared for DNA isolation by using the procedure suggested by (Hoelzel 1992). The molecular weight of the DNA was intact as visualized on 0.8 percent agarose gel. Since DNA isolated from all the accessions has occupied a position in the gel corresponding to clear non- sheared single band DNA. The bands of DNA were observed to be sharp; no streaking or very less streaking is suggestive of negligible DNA shearing (Henry, 1997; Sambrook, 1989).
ISSR analysis:
The primers have successfully been used to amplify random fragments from many perennial buffalo species. In the present study 20 primers were used from series of primers as per their availability in the laboratory.
Out of twenty total primers used to generate amplicons on screening. Five primers did not give any amplification. Such problems of non-amplification have also been reported in different crops, viz. soybean (Baranek et al., 2002; Chouwdhary et al., 2000), apple (Koller et al., 1993); Rhododendron spp. (Jayanti et al., 2000); in pandorea (Jain et al., 1999); stone fruits (Gao et al., 2001); and in datepalm by (Javouhey et al., 2000; Sedra et al., 1998). Nevertheless arbitrary primers have generated significant information in order to characterize and estimate variability in various species.
Most of the primers produced amplicons below 500bp to 1500bp range, though a few amplicons crossed 1.5-kb range. The size and pattern of amplicons have been found to be species and primer dependent by many of the workers (Sropaoraya et al., 2001; Toaruan et al., 1997), which corresponds to the finding of the present study. Not only the sizes of fragments were variable but number of bands generated by different primers were also much variable 5 band ( primer E), 6 band ( primer L and O) ,7 band ( primer I), 9 band (Primer C and H ) 10 band ( primer A , D , F , K and N ) 11band in( primer G) . 12 band (primer M) and Maximum to 13 (primer B and J), generally more the number of fragments generated higher could be number of polymorphic bands expected.
Genetic relationship among the genotypes and cluster analysis:
The Jaccard similarity coefficient generated on the basis of ISSR profiling showed an average similarity of 0.45% and range between 23 % (between Murrah 5 and MHS5) to 77% (between MHS3 and MHS4) among all the 10 accession of buffalo. The level of diversity within a population is important for the adaptability of the species. In case of buffalo accession both within and between populations diversity is very high and makes it adaptive in wider range of climatic conditions. This is evident from their suitability to grow in various seasons and diverse regions covering various continents of world.
The SAHN clustering based on UPGMA algorithms has put the genotypes in three groups, First group containing four accession (Murrah 1, Murrah 3, Murrah 4 and Murrah 5) and second group containing three accession (MHS2 , MHS3, MHS4) thirds group with MHS1 and Murrah2. MHS5 were most diverse accession. The high within group diversity comparable to the level of between group diversity has resulted in poor grouping indicating that accession were quite diverse.
Summary:
The present investigation aimed to study genetic diversity, primer discriminatory power and banding pattern of primer among fifteen accession of buffalos at molecular level could be summarized as follows:
1. The DNA isolated from 10 ml blood by using the procedure that suggested by Hoelzel (1992) , who found sufficient for good quality of ISSR analysis.
3. The primers; Primer A and Primer D could distinguish all the genotypes, the highest discriminatory index (1.0) was obtained.
4. The Jaccard Similarity Coefficient generated on the basis of ISSR profiling showed an average similarity of 0.45.% among all the 10 accessions.
5. The diversity within and between groups of accession has represented the range from 23% to 77% .
6. The SAHN clustering based on UPGMA algorithms has put genotypes in Four groups i.e. one with 4 accessions, another with 3 accessions and third group with 2 and one accession alone.
7. In conclusion buffalo accession harbors a great deal of diversity. It would be valuable resource for breeding purpose.
In conclusion buffalo accession harbors a great deal of diversity. It would be valuable resource for breeding purpose.
Conclusions:
The screening for the molecular genetic diversity among murrah and mehsana buffalo breed it is total were scored 10, out of which the jaccard’s pairwise similarity coefficient values ranged from average similarity of 0.45 % and range between 23 % (between murrah5 and mhs5) to 77 % (between mhs3 and mhs4) among all the 10 accession of buffalo. pair wise similarity was fixed between the 10 accessions, (see jaccard’s similarity coefficient matrix) vice versa.
and mhs 5. The murrah 2 was found between group two and groups 3.
REFERENCES
Ali, S., C.R. Muller and J.T. Epplen. 1986. “DNA finger printing byoligonucleotide probes specific for simple repeats.” Hum. Genet. 4: 239-243.
Amano, T., 1985. “Difference-frequency laser spectroscopy of molecularions with a hollow-cathode cell: extended analysis of the band of H2D+.” J. Opt. Soc. Am. B 2(5): 790.
Amano, T., K. Kurogi, K. Tanaka, T. Namikawa, Y. Yamamotoand, C.B. Locet et al. 1998. “Constitution of genes controlling bloodprotein types of Vietnam native water buffaloes and their phylogenic study.” Rep. Soc. Res. Native Livestock 16: 33-48.
Amano, T., K. Nozawa, T. Namikawa, M.A. Hasnath, K.G. Mostafaand, M.O. Faruque. 1984. “Blood Protein Polymorphism of WaterBuffaloes in Bangladesh.” In Genetic Studies on the Breed Differentiation of Native Domestic Animals in Bangladesh, edited by T. Amano, 25-42. Tokyo: Tokyo University of Agriculture.
Amano, T., Y. Miyakoshi, T. Takada, Y. Kikkawa and H. Suzuki. 1994. “Genetic variants of ribosomal DNA and mitochondrial DNA between swamp and river buffaloes.” Anim. Genet. 25:29-36.
Aravindakshan, T.V., A.M. Nainar and S.N. Sivaselvam. 2000. “Polymorphism in exon 2 of the BuLA-DRB3 gene in Indianbuffalo (Bubalusbubalis var. indicus) detected by PCR-RFLP.” Anim. Sci. 70: 221-226.
dehydrogenase (NADP+), catalase and esterase.” Aust. J. Biol. Sci. 30: 127-140.
Beckmann, J.S. and M. Soller. 1990. “Toward a unified approach to genetic mapping of eukaryotes based on sequence tagged microsatellite sites.” Nat. Biotechnol. 8: 930-932.
Bhat, P.P., B.P. Mishra, and P.N. Bhat. 1990. “Polymorphism of mitochondrial DNA (mtDNA) in cattle and buffaloes.” Biochem. Genet. 28: 311-318.
Botstein, D., R.L. White, M. Skolnick, and R.W. Davis. 1980. “Construction of a genetic linkage map in man using restriction fragment length polymorphisms.” Am. J. Hum. Genet. 32: 314-331.
Caetano-Anolles, G., B.J. Bassam and P.M. Gressoff. 1991. “DNA amplification fingerprinting using very short arbitrary oligonucleotide primers.” BioTechnology 9: 553-557.
Caetano-Anolles, G., B.J. Bassam and P.M. Gresshoff. 1992. “DNA fingerprinting: MAAPing out a RAPD redefinition?”BioTechnology 10: 937-937.
Chavananikul, V. 1989. “Cytogenetic aspect of crossbreeding in Buffalo.” Paper presented in the International Symposium on Buffalo Genotypes for Small Farms in Asia. UPM, Kuala Lumpur, Malaysia.
Chikuni, K., T. Tabata, M. Saito, and M. Monma. 1994. “Direct sequencing of the water buffalo (Bubalusbubalis) k-casein gene.”Anim.Sci. Technol. 65: 652-655.
Dallas, J.F. 1988. “Detection of DNA “fingerprints" of cultivated rice by hybridization with a human minisatellite DNA probe.”Proc. Natl. Acad. Sci. USA 85:6831–6835.
Giri, K.V. and N.C. Pillai. 1956. “Multiple haemoglobins in the blood of animals.”Nature 178: 1057-1057.
Grodzicker, T., J. Williams, P. Sharp and J. Sambrook. 1974. “Physical mapping of temperature-sensitive mutations of adenoviruses.” Cold Spring Harb. Symp. Quant. Biol. 39: 439-446.
Gupta, P. and R. Chaudhury. 1978. “Robertsonian changes in hromosome of Indian Murrah buffalo.” Nucleus 21: 80-97.
Harisah, M., T.I. Azmi, T.A. Bangso, M. Hilmi, and M.K. Vidyadaranet. 1989. “Chromosome make up of water buffalo breed-types of South East Asia.” Paper presented in the International Symposium on Buffalo Genotypes for small farms in Asia. UPM, Kuala Lumpur, Malaysia. Hillel, J., et al. 1990. “Genomic selection application of DNA