5 - 1
Desain
Barang dan Jasa 5
MANAJEMEN OPERASI:
Manajemen Keberlangsungan & Rantai Pasokan
Operations Management:
Sustainability & Supply Chain Management
5 - 2
Tujuan Pembelajaran
1. Mendefinisian siklus hidup produk (product life cycle) 2. Mendeskripsikan sistem pengembangan produk 3. Membuat rumah kualitas (house of quality)
4. Menjelaskan bagaimana kompetisi berbasis waktu (time- based) diimplementasikan oleh OM
5. Mendeskripsikan bagaimana barang dan jasa didefinisikan oleh OM
6. Mendeskripsikan dokumen-dokumen yang diperlukan untuk produksi.
7. Menjelaskan bagaimana partisipasi pelanggan dalam desain dan penyampaian (delivery) jasa
8. Mengaplikasikan pohon keputusan untuk masalah- masalah produk
5 - 3
► Pasar global
► Sistem CAD 3 dimensi
► Mengurangi waktu pengembangan produk
► Mengurangi masalah yang berhubungan dengan peralatan
► Mengurangi masalah yang berhubungan dengan produksi
► Produksi di lini perakitan
► JIT
Regal Marine
5 - 4
► Keberadaan sebuah organisasi/perusahaan adalah untuk menyediakan barang dan jasa bagi masyarakat
► Produk-produk yang hebat adalah kunci keksuksesan bagi setiap organisasi
► Organisasi yang unggul umumnya hanya fokus pada produk inti saja (Honda → mesin, Michelin → ban, Intel → Microprocessor)
► Pelanggan itu membeli kepuasan, tidak sekedar fisik barang maupun jasa tertentu saja.
► Desain produk merupakan hal yang fundamental bagi strategi organisasi yang implikasinya meliputi seluruh fungsi operasi.
Pemilihan Barang dan Jasa
5 - 5
►
Barang dan jasa adalah dasar dari keberadaan sebuah organisasi
►
Produk yang memiliki siklus hidup terbatas dan dapat diprediksi, maka perusahaan harus terus-menerus mencari, merancang, dan mengembangkan produk baru
►
Produk baru akan memberikan kontribusi pendapatan secara substansial
►
Produk baru tidak selalu sukses di pasaran
5 - 6
Semakin tinggi persentase penjualan produk baru (terhadap produk2nya yang lain) dalam 5 tahun terahir, semakin besar kemungkinan perusahaan tersebut menjadi pemimpin industri.
50% – 40% – 30% – 20% – 10% –
0% – Pemimpin
industri Sepertiga
atas Sepertiga
kedua Sepertiga
bawah
Posisi perusahaan dalam industrinya Persentasi penjualan produk-produk baru
5 - 7
Tujuan dari keputusan produk adalah untuk mengembangkan dan mengimplementasikan strategi produk yang memenuhi permintaan
pasar dengan sebuah keunggulan bersaing
Keputusan Produk
5 - 8
Pilihan Strategi Produk
►
Differentiation
► Shouldice Hospital, Mbah Jingkrak, Bu Fat, Mak Icih
►
Low cost
► Taco Bell, D’Cost
►
Rapid response
► Toyota
5 - 9
Product Life Cycles
►
Siklus hidup produk: harian (kaos konser), bulanan (baju musiman, batu akik), tahunan (laptop, elektronik), puluhan tahun (Airbus A330)
►
Fungsi operasi harus dapat memperkenalkan produk baru dengan sukses.
5 - 10
Product Life Cycle
Arus Kas negatif
Pengenalan Pertumbuhan Matang Penurunan
Penjualan, biaya, dan arus kas
Biaya pengembangan dan produksi
Arus Kas
Pendapatan bersih (profit) Pendapatan penjualan
Kerugian
5 - 11
Siklus Hidup dan Strategi
Fase Pengenalan
► Masih mencari celah yang pas (fine tuning) sehingga memunculkan biaya- biaya yang tidak biasa untuk:
1. Penelitian
2. Pengembangan produk
3. Modifikasi dan perbaikan proses 4. Pengembangan suplier
5 - 12
Fase Pertumbuhan
►
Desain produk mulai stabil
►
Mulai memerlukan peramalan kapasitas yang efektif
►
Penambahan atau peningkatan
kapasitas mungkin diperlukan
5 - 13
Fase Matang
►
Kompetitor mulai bermunculan
►
Volume produksi yang tinggi, produk yang inovatif mungkin dibutuhkan
►
Perbaikan pengendalian biaya, mengurangi pilihan-pilihan, mengurangi lini produk
5 - 14
Fase Penurunan
►
Jika sudah tidak bisa memberi kontribusi khusus bagi
organisasi, maka sudah saatnya untuk menghentikan produk tersebut
5 - 15
Product-by-Value Analysis (Analisis Poduk Berdasar Nilai)
►
Buat daftar urutan produk secara descending (menurun) sesuai dengan kontribusi rupiahnya bagi perusahaan
►
Buat daftar kontribusi rupiah tahunan masing-masing produk tersebut
►
Ini dapat membantu manajemen mengevaluasi strategi-strategi alternatif
5 - 16
Membangun Produk Baru
1. Memahami pelanggan 2. Perubahan ekonomi
3. Perubahan sosial dan demografi 4. Perubahan teknologi
5. Perubahan politik dan hukum 6. Praktik pasar, standar profesional,
suplier, distributor Yang harus diperhatikan:
5 - 17
Lingkup tim pengem-
bangan produk
Tahap Pengembangan Produk
Lingkup bagi tim desain dan
rekayasa
Evaluasi Pengenalan Uji Pasar Spesifikasi fungsional
Review desain Spesifikasi produk Kebutuhan Pelanggan Fisibilitas
Konsep
5 - 18
Quality Function Deployment (QFD)
‒ Penyebaran Fungsi Kualitas ‒
▶ Adalah proses menetapkan “apa yang diinginkan konsumen” dan
menerjemahkannya menjadi atribut
“bagaimana agar tiap area fungsional dapat memahami dan memenuhi kebutuhan konsumen”.
▶ Tool implementasi QFD: rumah kualitas (house of quality) yaitu sebuah teknik grafis untuk menjelaskan hubungan antara
keinginan konsumen dan produk (barang atau jasa).
5 - 19
1. Mengidentifikasi keinginan pelanggan
2. Mengidentifikasi atribut-atribut tentang bagaimana barang/jasa akan memenuhi keinginan pelanggan 3. Menghubungkan Langkah 1 & 2
4. Mengidentifikasi relasi antar atribut
5. Menetapkan tingkat kepentingan pelanggan 6. Mengevaluasi produk-produk pesaing
7. Membandingan performa/kinerja terhadap atribut- atribut teknis yang diinginan
Tahapan QFD:
5 - 20
QFD: House of Quality
Matriks relasi Bagaimana untuk memenuhi keinginan
pelanggan Relasi antar atribut
Penilaian pesaing
Evaluasi teknis Nilai-nilai target
Apa yang diinginan pelanggan
Peringkat kepentingan pelanggan
Bobot peringkat
5 - 21
Contoh House of Quality
Tim Anda ditugasi untuk mendesain sebuah kamera baru untuk PT. Great Cameras, Inc.
Langkah pertamanya adalah membangun sebuah rumah kualitas (House of Quality)
5 - 22
Peringkat kepentingan
pelanggan (5 = tertinggi)
Ringan 3
Mudah digunakan 4
Reliabel/Handal 5
Mudah dipegang/digenggam 2
Resolusi tinggi 1
Apa yang diinginan pelanggan
What the Customer Wants
Relationship Matrix
Technical Attributes and
Evaluation How to Satisfy Customer Wants
Interrelationships
Analysis of Competitors
5 - 23 What the
Customer Wants
Relationship Matrix
Technical Attributes and
Evaluation How to Satisfy Customer Wants
Interrelationships
Analysis of Competitors
Ebutuhan daya listrik rendah Komponen aluminium Auto focus Auto exposure (Pencahayaan otomatis) Jumlah pixels besar Desain Ergonomic Bagaimana untuk
memuaskan pelanggan
5 - 24
Ringan 3
Mudah digunakan 4
Reliabel/Handal 5
Mudah dipegang/digenggam 2
Resolusi tinggi 1
What the Customer Wants
Relationship Matrix
Technical Attributes and
Evaluation How to Satisfy Customer Wants
Interrelationships
Analysis of Competitors
Relasi kuat Relasi sedang Relasi rendah
Matriks relasi
5 - 25
Ebutuhan daya listrik rendah Komponen aluminium Auto focus Auto exposure (Pencahayaan otomatis) Jumlah pixels besar Desain Ergonomic Relasi antar atribut
(yang bisa kita buat)
What the Customer Wants
Relationship Matrix
Technical Attributes and
Evaluation How to Satisfy Customer Wants
Interrelationships
Analysis of Competitors
5 - 26
Peringat terboboti
Ringan 3
Mudah digunakan 4
Reliabel/Handal 5
Mudah dipegang/digenggam 2
Resolusi tinggi 1
Peringkat kepentingan kita 22 9 27 27 32 25
What the Customer Wants
Relationship Matrix
Technical Attributes and
Evaluation How to Satisfy Customer Wants
Interrelationships
Analysis of Competitors
5 - 27
Perusahaan A Perusahaan B
G P
G P
F G
G P
P P
Ringan 3
Mudah digunakan 4
Reliabel/Handal 5
Mudah dipegang/digenggam 2
Resolusi tinggi 1
Peringat kepentingan kita 22 5 How well do competing
products meet customer wants
What the Customer Wants
Relationship Matrix
Technical Attributes and
Evaluation How to Satisfy Customer Wants
Interrelationships
Analysis of Competitors
5 - 28 What the
Customer Wants
Relationship Matrix
Technical Attributes and
Evaluation How to Satisfy Customer Wants
Interrelationships
Analysis of Competitors
Nilai target (Atribut teknis)
Evaluasi teknis
Perusahaan A 0.7 60% yes 1 ok G Perusahaan B 0.6 50% yes 2 ok F
Kita 0.5 75% yes 2 ok G
2 circuits Failure 1 per 10,000 Panel ranking
0.5 A 75% 2’ to ∞
5 - 29
House of Quality Lengkap
Low electricity requirements Aluminum components Auto focus Auto exposure High number of pixels Ergonomic design Company A Company B
Lightweight 3
Easy to use 4
Reliable 5
Easy to hold steady 2 High resolution 1 Our importance ratings
G P G P F G G P P P
Target values (Technical attributes)
Technical evaluation
Company A 0.7 60% yes 1 ok G Company B 0.6 50% yes 2 ok F Us 0.5 75% yes 2 ok G 0.5 A 75% 2’ to ∞ 2 circuits Failure 1 per 10,000 Panel ranking 22 9 27 27 32 25
5 - 30
Rangkaian Rumah Kualitas
Menyebarkan sumberdaya melalui organisasi dalam memenuhi kebutuhan pelanggan
Proses produksi
Rencana kualitas
House 4
Komponen2spesifik Proses produksi
House 3
Karakteristikdesain Komponen2
spesifik
House 2
Kebutuhanpelanggan Karakteristik
desain
House 1
5 - 31
Pengorganisasian Pengembangan Produk
►
Secara tradisional– departemen yang berbeda-beda
► Tugas dan tanggung jawab didefinisikan
► Sulit untuk berfikir maju
►
A Champion (Juara)
► Manajer produk memandu produk melalui sistem pengembangan produk dan organisasi terkait
5 - 32
►
Pendekatan Tim
► Bersifat lintas fungsi (cross-function) – diwakili dari seluruh disiplin/fungsi
► Tim pengembangan produk, tim desain untuk manufakturabiitas, tim rekayasa nilai
►
Pendekatan “whole organization” ala Jepang
► Tidak mengenal divisi-divis organisasi
5 - 33
Manufakturabilitas dan Rekayasa Nilai
► Manfaat:
1. Mengurangi komplesitas produk 2. Mengurangi dampak lingkungan 3. Standarisasi tambahan untuk komponen 4. Perbaikan aspek fungsional produk
5. Perbaikan desain kerja dan keselamatan kerja 6. Perbaikan untuk pemeliharaan produk 7. Desain yang robust
5 - 34
Pengurangan biaya sebuah Bracket melalui Rekayasa Nilai
Figure 5.5
5 - 35
Isu-isu tentang Desain Produk
► Desain robust
► Desain modular
► Computer-aided design (CAD)
► Computer-aided manufacturing (CAM)
► Virtual reality technology
► Value analysis
► Sustainability and Life Cycle Assessment (LCA)
5 - 36
Robust Design
►
Produk didesain sedemikian rupa sehingga perubahan/variasi kecil dalam produksi atau perakitan tidak akan berdampak negatif terhadap produk
►
Biasanya menghasilkan produk
dengan biaya yang lebih rendah
namun dengan kualitas yang lebih
tinggi
5 - 37
Desain Modular
►
Produk didesain dalam kompononen- komponen yang mudah tersegmentasi
►
Menambah fleksibilitas untuk produksi dan pemasaran
►
Peningkatan kemampuan untuk memenuhi kebutuhan pelanggan
5 - 38
► Using computers to design products and prepare engineering documentation
► Shorter development cycles, improved accuracy, lower cost
► Information and designs can be deployed
worldwide
Computer Aided Design (CAD)
5 - 39
►Design for Manufacturing and Assembly (DFMA)
► Solve manufacturing problems during the design stage
►3-D Object Modeling
► Small prototype development
►CAD through the internet
►International data exchange through STEP
Extensions of CAD
5 - 40
Computer-Aided Manufacturing (CAM)
►
Utilizing specialized computers and program to control manufacturing equipment
►
Often driven by the CAD system
(CAD/CAM)
5 - 41
1. Product quality 2. Shorter design time
3. Production cost reductions 4. Database availability 5. New range of capabilities
Benefits of CAD/CAM
5 - 42
Virtual Reality Technology
►
Computer technology used to develop an interactive, 3-D model of a product from the basic CAD data
►
Allows people to ‘see’ the finished design before a physical model is built
►
Very effective in large-scale designs such as plant layout
5 - 43
Value Analysis
►
Focuses on design improvement during production
►
Seeks improvements leading either to a better product or a product which can be produced more economically with less environmental impact
5 - 44
Sustainability and Life Cycle Assessment (LCA)
► Sustainability means meeting the needs of the present without compromising the ability of future generations to meet their needs
► LCA is a formal evaluation of the environmental impact of a product
5 - 45
Product Development Continuum
►
Product life cycles are becoming shorter and the rate of technological change is increasing
►
Developing new products faster can result in a competitive advantage
►
Time-Based Competition
5 - 46
Product Development Continuum
Internal Cost of product development Shared Lengthy Speed of product development Rapid and/
or Existing
High Risk of product development Shared
External Development Strategies Alliances Joint ventures
Purchase technology or expertise by acquiring the developer
Internal Development Strategies Migrations of existing products Enhancements to existing products New internally developed products
Figure 5.6
5 - 47
Product Development Continuum
►
Purchasing technology by acquiring a firm
► Speeds development
► Issues concern the fit between the acquired organization and product and the host
►
Joint Ventures
► Both organizations learn
► Risks are shared
5 - 48
Product Development Continuum
►
Through Alliances
► Cooperative agreements between independent organizations
► Useful when technology is developing
► Reduces risks
5 - 49
Defining a Product
►
First definition is in terms of functions
►
Rigorous specifications are developed during the design phase
►
Manufactured products will have an engineering drawing
►
Bill of material (BOM) lists the components of a product
5 - 50
Monterey Jack Cheese
(a) U.S. grade AA. Monterey cheese shall conform to the following requirements:
(1) Flavor. Is fine and highly pleasing, free from undesirable flavors and odors.
May possess a very slight acid or feed flavor.
(2) Body and texture. A plug drawn from the cheese shall be reasonably firm.
It shall have numerous small mechanical openings evenly distributed throughout the plug. It shall not possess sweet holes, yeast holes, or other gas holes.
(3) Color. Shall have a natural, uniform, bright and attractive appearance.
(4) Finish and appearance—bandaged and paraffin-dipped. The rind shall be sound, firm, and smooth providing a good protection to the cheese.
Code of Federal Regulation, Parts 53 to 109, General Service Administration
5 - 51
►
Engineering drawing
► Shows dimensions, tolerances, and materials
► Shows codes for Group Technology
►
Bill of Material
► Lists components, quantities and where used
► Shows product structure
Product Documents
5 - 52
Engineering Drawings
Figure 5.8
5 - 53
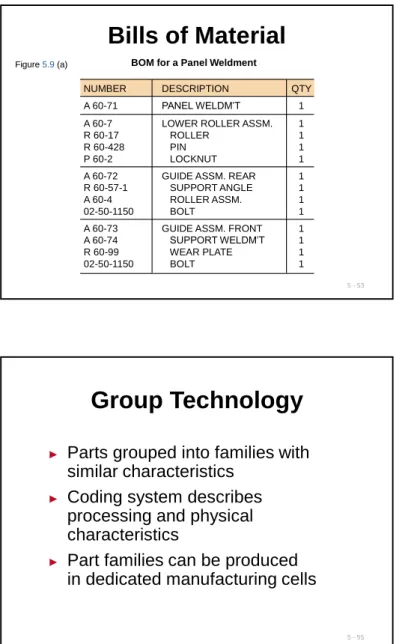
Bills of Material
BOM for a Panel Weldment
NUMBER DESCRIPTION QTY
A 60-71 PANEL WELDM’T 1
A 60-7 LOWER ROLLER ASSM. 1
R 60-17 ROLLER 1
R 60-428 PIN 1
P 60-2 LOCKNUT 1
A 60-72 GUIDE ASSM. REAR 1
R 60-57-1 SUPPORT ANGLE 1
A 60-4 ROLLER ASSM. 1
02-50-1150 BOLT 1
A 60-73 GUIDE ASSM. FRONT 1
A 60-74 SUPPORT WELDM’T 1
R 60-99 WEAR PLATE 1
02-50-1150 BOLT 1
Figure 5.9 (a)
5 - 54
Bills of Material
Hard Rock Cafe’s Hickory BBQ Bacon Cheeseburger
DESCRIPTION QTY
Bun 1
Hamburger patty 8 oz.
Cheddar cheese 2 slices
Bacon 2 strips
BBQ onions 1/2 cup
Hickory BBQ sauce 1 oz.
Burger set
Lettuce 1 leaf
Tomato 1 slice
Red onion 4 rings
Pickle 1 slice
French fries 5 oz.
Seasoned salt 1 tsp.
11-inch plate 1
HRC flag 1
Figure 5.9 (b)
5 - 55
►
Parts grouped into families with similar characteristics
►
Coding system describes processing and physical characteristics
►
Part families can be produced in dedicated manufacturing cells
Group Technology
5 - 56
Group Technology Scheme
Figure 5.10 (a) Ungrouped Parts
(b) Grouped Cylindrical Parts (families of parts) Grooved Slotted Threaded Drilled Machined
5 - 57
1. Improved design
2. Reduced raw material and purchases 3. Simplified production planning and
control
4. Improved layout, routing, and machine loading
5. Reduced tooling setup time, work-in- process, and production time
Group Technology Benefits
5 - 58
Documents for Production
►
Assembly drawing
►
Assembly chart
►
Route sheet
►
Work order
►
Engineering change notices (ECNs)
5 - 59
Assembly Drawing
►
Shows exploded view of product
►
Details relative locations to show how to assemble the product
Figure 5.11 (a)
5 - 60
Assembly Chart
1 2 3 4 5 6 7 8 9 10 11
R 209 Angle R 207 Angle Bolts w/nuts (2) R 209 Angle R 207 Angle
Bolt w/nut R 404 Roller Lock washer Part number tag Box w/packing material Bolts w/nuts (2)
SA 1
SA 2
A1
A2
A3
A4 A5 Left bracket assembly
Right bracket assembly
Poka-yoke inspection
Figure 5.11 (b) Identifies the point of production where components flow into subassemblies and ultimately into the final product
5 - 61
Route Sheet
Lists the operations and times required to produce a component
Setup Operation Process Machine Operations Time Time/Unit
1 Auto Insert 2 Insert Component 1.5 .4
Set 56
2 Manual Insert Component .5 2.3
Insert 1 Set 12C
3 Wave Solder Solder all 1.5 4.1
components
to board
4 Test 4 Circuit integrity .25 .5
test 4GY
5 - 62
Work Order
Instructions to produce a given quantity of a particular item, usually to a schedule
Work Order
Item Quantity Start Date Due Date
Production Delivery
Dept Location
157C 125 5/2/08 5/4/08
F32 Dept K11
5 - 63
Engineering Change Notice (ECN)
►
A correction or modification to a product’s definition or documentation
► Engineering drawings
► Bill of material
Quite common with long product life cycles, long manufacturing lead times, or rapidly
changing technologies
5 - 64
Configuration Management
►
The need to manage ECNs has led to the development of configuration management systems
►
A product’s planned and changing
components are accurately identified
and control and accountability for
change are identified and maintained
5 - 65
Product Life-Cycle Management (PLM)
► Integrated software that brings together most, if not all, elements of product design and manufacture
► Product design
► CAD/CAM, DFMA
► Product routing
► Materials
► Assembly
► Environmental
5 - 66
Service Design
►
Service typically includes direct interaction with the customer
►
Process – chain – network (PCN) analysis focuses on the ways in which processes can be designed to optimize interaction between firms and their customers
5 - 67
Process-Chain-Network (PCN) Analysis
Figure 5.12
5 - 68
Process-Chain-Network (PCN) Analysis
▶ Direct interaction region includes process steps that involve interaction between participants
▶ The surrogate (substitute) interaction region includes process steps in which one participant is acting on another participant’s resources
▶ The independent processing region includes steps in which the supplier and/or the customer is acting on resources where each has
maximum control
5 - 69
Process-Chain-Network (PCN) Analysis
▶ All three regions have similar operating issues but the appropriate way of handling the issues differs across regions
▶ Service operations exist only within the area of direct and surrogate interaction
▶ PCN analysis provides insight to aid in positioning and designing processes that can achieve strategic objectives
5 - 70
Adding Service Efficiency
▶ Service productivity is notoriously low partially because of customer
involvement in the design or delivery of the service, or both
▶ Complicates product design
5 - 71
Adding Service Efficiency
▶ Limit the options
▶Improves efficiency and ability to meet customer expectations
▶ Delay customization
▶ Modularization
▶Eases customization of a service
5 - 72
Adding Service Efficiency
▶ Automation
▶Reduces cost, increases customer service
▶ Moment of truth
▶Critical moments between the customer and the organization that determine customer satisfaction
5 - 73
Documents for Services
►
High levels of customer interaction necessitates different
documentation
►
Often explicit job instructions
►
Scripts and storyboards are other techniques
5 - 74
First Bank Corp. Drive-up Teller Service Guidelines
• Be especially discreet when talking to the customer through the microphone.
• Provide written instructions for customers who must fill out forms you provide.
• Mark lines to be completed or attach a note with instructions.
• Always say “please” and “thank you” when speaking through the microphone.
• Establish eye contact with the customer if the distance allows it.
• If a transaction requires that the customer park the car and come into the lobby, apologize for the inconvenience.
5 - 75
Application of Decision Trees to Product Design
►
Particularly useful when there are a series of decisions and outcomes which lead to other decisions and outcomes
5 - 76
Application of Decision Trees to Product Design
1. Include all possible alternatives and states of nature - including “doing nothing”
2. Enter payoffs at end of branch
3. Determine the expected value of each branch and “prune” the tree to find the alternative with the best expected value
Procedure
5 - 77 (.6)
Low sales (.4) High sales (.6) Low sales
(.4) High sales
Decision Tree Example
Purchase CAD
Hire and train engineers
Do nothing
Figure 5.13
5 - 78 (.6) Low sales
(.4) High sales
Decision Tree Example
Purchase CAD
(.6) Low sales
(.4) High sales Hire and train engineers
Do nothing
$2,500,000 Revenue
– 1,000,000 Mfg cost ($40 x 25,000) – 500,000 CAD cost
$1,000,000 Net $800,000 Revenue
– 320,000 Mfg cost ($40 x 8,000) – 500,000 CAD cost – $20,000 Net loss
EMV (purchase CAD system) = (.4)($1,000,000) + (.6)(– $20,000)
Figure 5.13
5 - 79 (.6) Low sales
(.4) High sales
Decision Tree Example
Purchase CAD
(.6) Low sales
(.4) High sales Hire and train engineers
Do nothing
$2,500,000 Revenue
– 1,000,000 Mfg cost ($40 x 25,000) – 500,000 CAD cost
$1,000,000 Net $800,000 Revenue
– 320,000 Mfg cost ($40 x 8,000) – 500,000 CAD cost – $20,000 Net loss
$388,000
EMV (purchase CAD system) = (.4)($1,000,000) + (.6)(– $20,000)
= $388,000
Figure 5.13
5 - 80 (.6)
Low sales (.4) High sales (.6) Low sales
(.4) High sales
Decision Tree Example
Purchase CAD
$388,000
Hire and train engineers
$365,000
Do nothing $0
$0 Net
$800,000 Revenue
– 400,000 Mfg cost ($50 x 8,000) – 375,000 Hire and train cost
$25,000 Net $2,500,000 Revenue
– 1,250,000 Mfg cost ($50 x 25,000) – 375,000 Hire and train cost $875,000 Net
$2,500,000 Revenue
– 1,000,000 Mfg cost ($40 x 25,000) – 500,000 CAD cost
$1,000,000 Net $800,000 Revenue
– 320,000 Mfg cost ($40 x 8,000) – 500,000 CAD cost – $20,000 Net loss
Figure 5.13
5 - 81
Transition to Production
►Know when to move to production
► Product development can be viewed as evolutionary and never complete
► Product must move from design to production in a timely manner
►Most products have a trial production period to insure producibility
► Develop tooling, quality control, training
► Ensures successful production
5 - 82
Transition to Production
► Responsibility must also transition as the product moves through its life cycle
► Line management takes over from design
► Three common approaches to managing transition
► Project managers
► Product development teams
► Integrate product development and manufacturing organizations
5 - 83 All rights reserved. No part of this publication may be reproduced, stored in a retrieval system, or
transmitted, in any form or by any means, electronic, mechanical, photocopying, recording, or otherwise, without the prior written permission of the publisher.
Printed in the United States of America.