DAFTAR PERTANYAAN PENELITIAN TENTANG
PENGARUH KUALITAS PELAYANAN JASA PENDIDIKAN TERHADAP
KEPUASAN SISWA PADA MA MIFTAHUL ULUM MAKARTI JAYA
1.
Dalam rangka menyelesaikan studi kami di Politeknik Negeri Sriwijaya,
kami mengharapkan kesediaan saudara/I dalam membantu menjawab
pertanyaan yang telah tersedia secara objektif. Atas kesediaannya kami
ucapkan terima kasih.
2.
Semua
informasi/jawaban
dan
identitas
Saudara/I
dijamin
kerahasiaannya.
I.
IDENTITAS RESPONDEN
Jawablah pertanyaan berikut ini dengan member
i tanda (√ ) pada kolom yang
telah tersedia
Nama
:
Jenis Kelamin : L P
Kelas
: X XI XII
Jurusan
: IPA IPS
II.
PETUNJUK
Beri tanda centang (√) pada salah satu jawaban
dari beberapa alternative
pilihan jawaban yang tersedia.
SB
B
CB
TB
STB
: Sangat Baik (5)
: Baik (4)
: Cukup Baik (3)
: Tidak Baik (2)
: Sangat Tidak Baik (1)
SP
P
CP
TP
STP
: Sangat Puas (5)
: Puas (4)
: Cukup Puas (3)
: Tidak Puas (2)
Daftar Pertanyaan Variabel X (Kualitas Layanan)
Pertanyaan
Kualitas Jasa
STB
(1)
TB
(2)
CB
(3)
B
(4)
SB
(5)
Tangible
(Bentuk Fisik)
1.
Tata letak gedung atau kondisi ruangan
2.
Kenyamanan dan kebersihan ruang
kelas
3.
Kelengkapan media pembelajaran
(laboratorium, alat-alat praktek,
proyektor, dll)
4.
Penyediaan dan kelengkapan fasilitas
lainnya (perpustakaan, UKS, tempat
parkir kendaraan, lapangan olahraga,
tempat ibadah, toilet dll)
5.
Kebersihan dan kenyamanan fasilitas
lainnya (perpustakaan, UKS, tempat
parkir kendaraan, lapangan olahraga,
tempat ibadah, toilet dll)
Reliability
(Kehandalan)
6.
Keaktifan guru dalam proses belajar
mengajar
7.
Kemampuan guru dalam proses belajar
mengajar
8.
Ketepatan guru dalam memulai
pelajaran
9.
Ketepatan dalam pemberian nilai pada
rapot
10.
Penanganan proses administrasi yang
cepat
Responsivness
(Daya Tanggap)
11. Kesungguhan guru dalam mengajar
12.
Guru bersedia dalam menjawab
pertanyaan siswa
14.
Pihak sekolah bersedia dalam
menanggapi keluhan siswa
15.
Penyampaian informasi yang cepat, tepat
dan jelas
Assurance
(Jaminan)
16. Guru memiliki pengalaman yang luas
17.
Guru dan karyawan dapat dipercaya
oleh siswa
18.
Kesopanan karyawan dalam melayani
siswa
19.
Guru memiliki pengetahuan yang luas
20.
Kemudahan dalam menggunakan
fasilitas yang ada
Empathy
(Empati)
21.
Keramahan guru dan staff dalam
memperlakukan siswa tanpa
memandang status sosial
22.
Petugas UKS dan perpustakaan dengan
ramah melayani siswa yang
membutuhkan
23. Guru memahami setiap kesulitan siswa
24.
Guru bersedia membantu dalam
memahami setiap pelajaran
Daftar Pertanyaan Variabel Y (Kepuasan Siswa)
Pertanyaan
Kepuasan Siswa
STP
(1)
TP
(2)
CP
(3)
P
(4)
SP
(5)
1.
Perasaan puas terhadap ketersediaan
peralatan dan teknologi yang dibutuhkan
2.
Perasaan puas terhadap kehandalan guru
dalam proses belajar mengajar
3.
Perasaan puas terhadap keaktifan guru
dan karyawan dalam menanggapi
masalah siswa
4.
Perasaan puas terhadap kenyamanan
saat belajar didalam ruang kelas
5.
Frequencies
Statistics
X11 X12 X13 X14 X15
N Valid 43 43 43 43 43
Missing 0 0 0 0 0
X11
Frequency Percent Valid Percent
Cumulative
Percent
Valid 1 1 2,3 2,3 2,3
2 1 2,3 2,3 4,7
3 7 16,3 16,3 20,9
4 14 32,6 32,6 53,5
5 20 46,5 46,5 100,0
Total 43 100,0 100,0
X12
Frequency Percent Valid Percent
Cumulative
Percent
Valid 2 1 2,3 2,3 2,3
3 11 25,6 25,6 27,9
4 24 55,8 55,8 83,7
5 7 16,3 16,3 100,0
Total 43 100,0 100,0
X13
Frequency Percent Valid Percent
Cumulative
Percent
Valid 1 1 2,3 2,3 2,3
3 19 44,2 44,2 46,5
4 21 48,8 48,8 95,3
5 2 4,7 4,7 100,0
X14
Frequency Percent Valid Percent
Cumulative
Percent
Valid 2 1 2,3 2,3 2,3
3 11 25,6 25,6 27,9
4 23 53,5 53,5 81,4
5 8 18,6 18,6 100,0
Total 43 100,0 100,0
X15
Frequency Percent Valid Percent
Cumulative
Percent
Valid 1 1 2,3 2,3 2,3
2 1 2,3 2,3 4,7
3 9 20,9 20,9 25,6
4 22 51,2 51,2 76,7
5 10 23,3 23,3 100,0
Total 43 100,0 100,0
Frequencies
Statistics
X21 X22 X23 X24 X25
N Valid 43 43 43 43 43
Missing 0 0 0 0 0
X21
Frequency Percent Valid Percent
Cumulative
Percent
Valid 2 5 11,6 11,6 11,6
3 12 27,9 27,9 39,5
4 20 46,5 46,5 86,0
5 6 14,0 14,0 100,0
X22
Frequency Percent Valid Percent
Cumulative
Percent
Valid 2 5 11,6 11,6 11,6
3 12 27,9 27,9 39,5
4 20 46,5 46,5 86,0
5 6 14,0 14,0 100,0
Total 43 100,0 100,0
X23
Frequency Percent Valid Percent
Cumulative
Percent
Valid 1 1 2,3 2,3 2,3
2 1 2,3 2,3 4,7
3 10 23,3 23,3 27,9
4 27 62,8 62,8 90,7
5 4 9,3 9,3 100,0
Total 43 100,0 100,0
X24
Frequency Percent Valid Percent
Cumulative
Percent
Valid 2 1 2,3 2,3 2,3
3 15 34,9 34,9 37,2
4 20 46,5 46,5 83,7
5 7 16,3 16,3 100,0
X25
Frequency Percent Valid Percent
Cumulative
Percent
Valid 3 19 44,2 44,2 44,2
4 17 39,5 39,5 83,7
5 7 16,3 16,3 100,0
Total 43 100,0 100,0
Frequencies
Statistics
X31 X32 X33 X34 X35
N Valid 43 43 43 43 43
Missing 0 0 0 0 0
X31
Frequency Percent Valid Percent
Cumulative
Percent
Valid 3 11 25,6 25,6 25,6
4 26 60,5 60,5 86,0
5 6 14,0 14,0 100,0
Total 43 100,0 100,0
X32
Frequency Percent Valid Percent
Cumulative
Percent
Valid 2 1 2,3 2,3 2,3
3 13 30,2 30,2 32,6
4 24 55,8 55,8 88,4
5 5 11,6 11,6 100,0
X33
Frequency Percent Valid Percent
Cumulative
Percent
Valid 2 3 7,0 7,0 7,0
3 11 25,6 25,6 32,6
4 26 60,5 60,5 93,0
5 3 7,0 7,0 100,0
Total 43 100,0 100,0
X34
Frequency Percent Valid Percent
Cumulative
Percent
Valid 2 1 2,3 2,3 2,3
3 20 46,5 46,5 48,8
4 20 46,5 46,5 95,3
5 2 4,7 4,7 100,0
Total 43 100,0 100,0
X35
Frequency Percent Valid Percent
Cumulative
Percent
Valid 1 1 2,3 2,3 2,3
3 19 44,2 44,2 46,5
4 20 46,5 46,5 93,0
5 3 7,0 7,0 100,0
Total 43 100,0 100,0
Frequencies
Statistics
X41 X42 X43 X44 X45
N Valid 43 43 43 43 43
X41
Frequency Percent Valid Percent
Cumulative
Percent
Valid 2 2 4,7 4,7 4,7
3 15 34,9 34,9 39,5
4 18 41,9 41,9 81,4
5 8 18,6 18,6 100,0
Total 43 100,0 100,0
X42
Frequency Percent Valid Percent
Cumulative
Percent
Valid 3 14 32,6 32,6 32,6
4 27 62,8 62,8 95,3
5 2 4,7 4,7 100,0
Total 43 100,0 100,0
X43
Frequency Percent Valid Percent
Cumulative
Percent
Valid 3 15 34,9 34,9 34,9
4 25 58,1 58,1 93,0
5 3 7,0 7,0 100,0
Total 43 100,0 100,0
X44
Frequency Percent Valid Percent
Cumulative
Percent
Valid 3 13 30,2 30,2 30,2
4 22 51,2 51,2 81,4
5 8 18,6 18,6 100,0
X45
Frequency Percent Valid Percent
Cumulative
Percent
Valid 1 1 2,3 2,3 2,3
2 1 2,3 2,3 4,7
3 13 30,2 30,2 34,9
4 25 58,1 58,1 93,0
5 3 7,0 7,0 100,0
Total 43 100,0 100,0
Frequencies
Statistics
X51 X52 X53 X54 X55
N Valid 43 43 43 43 43
Missing 0 0 0 0 0
X51
Frequency Percent Valid Percent
Cumulative
Percent
Valid 2 2 4,7 4,7 4,7
3 15 34,9 34,9 39,5
4 23 53,5 53,5 93,0
5 3 7,0 7,0 100,0
Total 43 100,0 100,0
X52
Frequency Percent Valid Percent
Cumulative
Percent
Valid 1 1 2,3 2,3 2,3
2 3 7,0 7,0 9,3
3 20 46,5 46,5 55,8
4 19 44,2 44,2 100,0
X53
Frequency Percent Valid Percent
Cumulative
Percent
Valid 3 19 44,2 44,2 44,2
4 22 51,2 51,2 95,3
5 2 4,7 4,7 100,0
Total 43 100,0 100,0
X54
Frequency Percent Valid Percent
Cumulative
Percent
Valid 2 2 4,7 4,7 4,7
3 14 32,6 32,6 37,2
4 25 58,1 58,1 95,3
5 2 4,7 4,7 100,0
Total 43 100,0 100,0
X55
Frequency Percent Valid Percent
Cumulative
Percent
Valid 3 13 30,2 30,2 30,2
4 21 48,8 48,8 79,1
5 9 20,9 20,9 100,0
Total 43 100,0 100,0
Frequencies
Statistics
Y1 Y2 Y3 Y4 Y5
N Valid 43 43 43 43 43
Y1
Frequency Percent Valid Percent
Cumulative
Percent
Valid 2 2 4,7 4,7 4,7
3 8 18,6 18,6 23,3
4 32 74,4 74,4 97,7
5 1 2,3 2,3 100,0
Total 43 100,0 100,0
Y2
Frequency Percent Valid Percent
Cumulative
Percent
Valid 3 8 18,6 18,6 18,6
4 29 67,4 67,4 86,0
5 6 14,0 14,0 100,0
Total 43 100,0 100,0
Y3
Frequency Percent Valid Percent
Cumulative
Percent
Valid 3 11 25,6 25,6 25,6
4 31 72,1 72,1 97,7
5 1 2,3 2,3 100,0
Total 43 100,0 100,0
Y4
Frequency Percent Valid Percent
Cumulative
Percent
Valid 3 10 23,3 23,3 23,3
4 25 58,1 58,1 81,4
5 8 18,6 18,6 100,0
Y5
Frequency Percent Valid Percent
Cumulative
Percent
Valid 3 10 23,3 23,3 23,3
4 22 51,2 51,2 74,4
5 11 25,6 25,6 100,0
Frequencies
Statistics
Kelas
N Valid 43
Missing 0
Kelas
Frequency Percent Valid Percent
Cumulative
Percent
Valid 1.00 9 20.9 20.9 20.9
2.00 14 32.6 32.6 53.5
3.00 20 46.5 46.5 100.0
Total 43 100.0 100.0
Frequencies
Statistics
Jurusan
N Valid 43
Missing 0
Jurusan
Frequency Percent Valid Percent
Cumulative
Percent
Valid 1.00 1 2.3 2.3 2.3
2.00 42 97.7 97.7 100.0
Frequencies
Statistics
Jenis Kelamin
N Valid 43
Missing 0
Jenis Kelamin
Frequency Percent Valid Percent
Cumulative
Percent
Valid 1.00 16 37.2 37.2 37.2
2.00 27 62.8 62.8 100.0
Rekapitulasi Hasil Kuesioner
Pertanyaan
Kualitas Jasa
STB
(1)
TB
(2)
CB
(3)
B
(4)
SB
(5)
Tangible
(Bentuk Fisik) X
11.
Tata letak gedung atau kondisi ruangan
-
-
9
14
20
2.
Kenyamanan dan kebersihan ruang
kelas
-
1
11
24
7
3.
Kelengkapan media pembelajaran
(laboratorium, alat-alat praktek,
proyektor, dll)
1
-
19
21
2
4.
Penyediaan dan kelengkapan fasilitas
lainnya (perpustakaan, UKS, tempat
parkir kendaraan, lapangan olahraga,
tempat ibadah, toilet dll)
-
1
11
23
8
5.
Kebersihan dan kenyamanan fasilitas
lainnya (perpustakaan, UKS, tempat
parkir kendaraan, lapangan olahraga,
tempat ibadah, toilet dll)
1
1
9
22
10
Reliability
(Kehandalan) X
26.
Keaktifan guru dalam proses belajar
mengajar
-
5
12
20
6
7.
Kemampuan guru dalam proses belajar
mengajar
-
1
9
28
5
8.
Ketepatan guru dalam memulai
pelajaran
1
1
10
27
4
9.
Ketepatan dalam pemberian nilai pada
rapot
-
1
15
20
7
10.
Penanganan proses administrasi yang
Pertanyaan
Kualitas Jasa
STB
(1)
TB
(2)
CB
(3)
B
(4)
SB
(5)
Responsivness
(Daya Tanggap) X
311.
Kesungguhan guru dalam mengajar
-
-
11
26
6
12.
Guru bersedia dalam menjawab
pertanyaan siswa
-
1
13
24
5
13. Staf untuk membantu kebutuhan siswa
-
3
11
26
3
14.
Pihak sekolah bersedia dalam
menanggapi keluhan siswa
-
1
20
20
2
15.
Penyampaian informasi yang cepat,
tepat dan jelas
-
1
19
20
3
Assurance
(Jaminan) X
416. Guru memiliki pengalaman yang luas
-
2
15
18
8
17.
Guru dan karyawan dapat dipercaya
oleh siswa
-
-
14
27
2
18.
Kesopanan karyawan dalam melayani
siswa
-
-
15
25
3
19. Guru memiliki pengetahuan yang luas
-
-
13
22
8
20.
Kemudahan dalam menggunakan
Pertanyaan
Kualitas Jasa
STB
(1)
TB
(2)
CB
(3)
B
(4)
SB
(5)
Empathy
(Empati) X
521.
Keramahan guru dan staff dalam
memperlakukan siswa tanpa
memandang status sosial
-
2
15
23
2
22.
Petugas UKS dan perpustakaan dengan
ramah melayani siswa yang
membutuhkan
1
3
20
19
-
23. Guru memahami setiap kesulitan siswa
-
-
19
22
2
24.
Guru bersedia membantu dalam
memahami setiap pelajaran
-
2
14
25
2
25.
Kepedulian guru terhadap siswa yang
mengalami masalah
-
-
13
21
9
Sumber: Hasil pengolahan data primer (2017)
Pertanyaan
Sikap Konsumen (Y)
Kepuasan Siswa
STP
(1)
TP
(2)
CP
(3)
P
(4)
SP
(5)
1.
Perasaan puas terhadap ketersediaan
peralatan dan teknologi yang dibutuhkan
-
2
8
32
1
2.
Perasaan puas terhadap kehandalan guru
dalam proses belajar mengajar
-
-
8
29
6
3.
Perasaan puas terhadap keaktifan guru
dan karyawan dalam menanggapi
masalah siswa
-
-
11
31
1
4.
Perasaan puas terhadap kenyamanan
saat belajar didalam ruang kelas
-
-
10
25
8
5.
Perasaan puas terhadap kesungguhan
dan perhatian guru dan karyawan
Correlations
Correlations
X11 X12 X13 X14 X15 Bukti Fisik
X11 Pearson Correlation 1 ,494** ,344* ,338* ,050 ,723**
Sig. (2-tailed) ,001 ,024 ,027 ,750 ,000
N 43 43 43 43 43 43
X12 Pearson Correlation ,494** 1 ,249 ,381* -,099 ,609**
Sig. (2-tailed) ,001 ,108 ,012 ,528 ,000
N 43 43 43 43 43 43
X13 Pearson Correlation ,344* ,249 1 ,403** ,045 ,606**
Sig. (2-tailed) ,024 ,108 ,007 ,777 ,000
N 43 43 43 43 43 43
X14 Pearson Correlation ,338* ,381* ,403** 1 ,471** ,792**
Sig. (2-tailed) ,027 ,012 ,007 ,001 ,000
N 43 43 43 43 43 43
X15 Pearson Correlation ,050 -,099 ,045 ,471** 1 ,480**
Sig. (2-tailed) ,750 ,528 ,777 ,001 ,001
N 43 43 43 43 43 43
Bukti Fisik Pearson Correlation ,723** ,609** ,606** ,792** ,480** 1
Sig. (2-tailed) ,000 ,000 ,000 ,000 ,001
N 43 43 43 43 43 43
**. Correlation is significant at the 0.01 level (2-tailed).
Correlations
Correlations
X21 X22 X23 X24 X25 Kehadalan
X21 Pearson Correlation 1 1,000** ,104 ,192 -,091 ,741**
Sig. (2-tailed) ,000 ,505 ,218 ,560 ,000
N 43 43 43 43 43 43
X22 Pearson Correlation 1,000** 1 ,104 ,192 -,091 ,741**
Sig. (2-tailed) ,000 ,505 ,218 ,560 ,000
N 43 43 43 43 43 43
X23 Pearson Correlation ,104 ,104 1 ,353* ,382* ,579**
Sig. (2-tailed) ,505 ,505 ,020 ,012 ,000
N 43 43 43 43 43 43
X24 Pearson Correlation ,192 ,192 ,353* 1 ,441** ,653**
Sig. (2-tailed) ,218 ,218 ,020 ,003 ,000
N 43 43 43 43 43 43
X25 Pearson Correlation -,091 -,091 ,382* ,441** 1 ,466**
Sig. (2-tailed) ,560 ,560 ,012 ,003 ,002
N 43 43 43 43 43 43
Keadaan Pearson Correlation ,741** ,741** ,579** ,653** ,466** 1
Sig. (2-tailed) ,000 ,000 ,000 ,000 ,002
N 43 43 43 43 43 43
**. Correlation is significant at the 0.01 level (2-tailed).
Correlations
Correlations
X31 X32 X33 X34 X35
Daya
Tanggap
X31 Pearson Correlation 1 ,213 ,233 -,080 ,041 ,475**
Sig. (2-tailed) ,169 ,133 ,610 ,794 ,001
N 43 43 43 43 43 43
X32 Pearson Correlation ,213 1 ,377* -,146 ,407** ,670**
Sig. (2-tailed) ,169 ,013 ,349 ,007 ,000
N 43 43 43 43 43 43
X33 Pearson Correlation ,233 ,377* 1 ,132 ,037 ,636**
Sig. (2-tailed) ,133 ,013 ,401 ,814 ,000
N 43 43 43 43 43 43
X34 Pearson Correlation -,080 -,146 ,132 1 ,266 ,399**
Sig. (2-tailed) ,610 ,349 ,401 ,085 ,008
N 43 43 43 43 43 43
X35 Pearson Correlation ,041 ,407** ,037 ,266 1 ,638**
Sig. (2-tailed) ,794 ,007 ,814 ,085 ,000
N 43 43 43 43 43 43
Daya Tanggap Pearson Correlation ,475** ,670** ,636** ,399** ,638** 1
Sig. (2-tailed) ,001 ,000 ,000 ,008 ,000
N 43 43 43 43 43 43
**. Correlation is significant at the 0.01 level (2-tailed).
Correlations
Correlations
X41 X42 X43 X44 X45 Jaminan
X41 Pearson Correlation 1 ,102 ,046 ,155 ,122 ,550**
Sig. (2-tailed) ,514 ,771 ,321 ,435 ,000
N 43 43 43 43 43 43
X42 Pearson Correlation ,102 1 ,562** ,473** -,068 ,620**
Sig. (2-tailed) ,514 ,000 ,001 ,663 ,000
N 43 43 43 43 43 43
X43 Pearson Correlation ,046 ,562** 1 ,497** -,010 ,637**
Sig. (2-tailed) ,771 ,000 ,001 ,949 ,000
N 43 43 43 43 43 43
X44 Pearson Correlation ,155 ,473** ,497** 1 ,102 ,726**
Sig. (2-tailed) ,321 ,001 ,001 ,513 ,000
N 43 43 43 43 43 43
X45 Pearson Correlation ,122 -,068 -,010 ,102 1 ,439**
Sig. (2-tailed) ,435 ,663 ,949 ,513 ,003
N 43 43 43 43 43 43
Jaminan Pearson Correlation ,550** ,620** ,637** ,726** ,439** 1
Sig. (2-tailed) ,000 ,000 ,000 ,000 ,003
N 43 43 43 43 43 43
Correlations
Correlations
X51 X52 X53 X54 X55 Empati
X51 Pearson Correlation 1 ,155 -,137 ,002 -,264 ,327*
Sig. (2-tailed) ,322 ,379 ,988 ,088 ,032
N 43 43 43 43 43 43
X52 Pearson Correlation ,155 1 ,145 ,112 -,079 ,566**
Sig. (2-tailed) ,322 ,354 ,473 ,615 ,000
N 43 43 43 43 43 43
X53 Pearson Correlation -,137 ,145 1 ,353* ,251 ,616**
Sig. (2-tailed) ,379 ,354 ,020 ,104 ,000
N 43 43 43 43 43 43
X54 Pearson Correlation ,002 ,112 ,353* 1 -,025 ,568**
Sig. (2-tailed) ,988 ,473 ,020 ,875 ,000
N 43 43 43 43 43 43
X55 Pearson Correlation -,264 -,079 ,251 -,025 1 ,374*
Sig. (2-tailed) ,088 ,615 ,104 ,875 ,014
N 43 43 43 43 43 43
Empati Pearson Correlation ,327* ,566** ,616** ,568** ,374* 1
Sig. (2-tailed) ,032 ,000 ,000 ,000 ,014
N 43 43 43 43 43 43
*. Correlation is significant at the 0.05 level (2-tailed).
Correlations
Correlations
Y1 Y2 Y3 Y4 Y5
Kepuasan
Siswa
Y1 Pearson Correlation 1 ,177 -,218 ,156 ,305* ,455**
Sig. (2-tailed) ,256 ,159 ,317 ,047 ,002
N 43 43 43 43 43 43
Y2 Pearson Correlation ,177 1 ,305* ,374* ,354* ,670**
Sig. (2-tailed) ,256 ,047 ,013 ,020 ,000
N 43 43 43 43 43 43
Y3 Pearson Correlation -,218 ,305* 1 ,345* ,227 ,464**
Sig. (2-tailed) ,159 ,047 ,024 ,143 ,002
N 43 43 43 43 43 43
Y4 Pearson Correlation ,156 ,374* ,345* 1 ,622** ,795**
Sig. (2-tailed) ,317 ,013 ,024 ,000 ,000
N 43 43 43 43 43 43
Y5 Pearson Correlation ,305* ,354* ,227 ,622** 1 ,814**
Sig. (2-tailed) ,047 ,020 ,143 ,000 ,000
N 43 43 43 43 43 43
Kepuasan Siswa Pearson Correlation ,455** ,670** ,464** ,795** ,814** 1
Sig. (2-tailed) ,002 ,000 ,002 ,000 ,000
N 43 43 43 43 43 43
*. Correlation is significant at the 0.05 level (2-tailed).
Reliability
Case Processing Summary
N %
Cases Valid 43 100,0
Excludeda 0 ,0
Total 43 100,0
a. Listwise deletion based on all variables in the
procedure.
Reliability Statistics
Cronbach's Alpha N of Items
,752 6
Item-Total Statistics
Scale Mean if
Item Deleted
Scale Variance if
Item Deleted
Corrected
Item-Total Correlation
Cronbach's Alpha
if Item Deleted
X11 34,56 19,776 ,612 ,696
X12 34,88 22,010 ,510 ,729
X13 35,21 22,074 ,507 ,730
X14 34,86 20,551 ,728 ,694
X15 34,84 22,425 ,332 ,753
Bukti Fisik 19,37 6,477 1,000 ,632
Reliability
Case Processing Summary
N %
Cases Valid 43 100,0
Excludeda 0 ,0
Total 43 100,0
a. Listwise deletion based on all variables in the
procedure.
Reliability Statistics
Cronbach's Alpha N of Items
Item-Total Statistics
Scale Mean if
Item Deleted
Scale Variance if
Item Deleted
Corrected
Item-Total Correlation
Cronbach's Alpha
if Item Deleted
X21 33,35 20,471 ,648 ,699
X22 33,35 20,471 ,648 ,699
X23 33,23 22,421 ,468 ,736
X24 33,21 21,884 ,557 ,723
X25 33,26 23,385 ,342 ,755
Kehadalan 18,49 6,589 1,000 ,642
Reliability
Case Processing Summary
N %
Cases Valid 43 100,0
Excludeda 0 ,0
Total 43 100,0
a. Listwise deletion based on all variables in the
procedure.
Reliability Statistics
Cronbach's Alpha N of Items
,714 6
Item-Total Statistics
Scale Mean if
Item Deleted
Scale Variance if
Item Deleted
Corrected
Item-Total Correlation
Cronbach's Alpha
if Item Deleted
X31 32,95 12,998 ,336 ,708
X32 33,07 11,828 ,553 ,662
X33 33,16 11,901 ,505 ,670
X34 33,30 13,359 ,248 ,723
X35 33,28 11,825 ,503 ,669
Reliability
Case Processing Summary
N %
Cases Valid 43 100,0
Excludeda 0 ,0
Total 43 100,0
a. Listwise deletion based on all variables in the
procedure.
Reliability Statistics
Cronbach's Alpha N of Items
,723 6
Item-Total Statistics
Scale Mean if
Item Deleted
Scale Variance if
Item Deleted
Corrected
Item-Total Correlation
Cronbach's Alpha
if Item Deleted
X41 33,70 13,121 ,383 ,705
X42 33,72 13,635 ,525 ,692
X43 33,72 13,396 ,536 ,686
X44 33,56 12,491 ,626 ,659
X45 33,79 13,979 ,270 ,729
Jaminan 18,72 4,016 1,000 ,511
Reliability
Case Processing Summary
N %
Cases Valid 43 100,0
Excludeda 0 ,0
Total 43 100,0
a. Listwise deletion based on all variables in the
procedure.
Reliability Statistics
Cronbach's Alpha N of Items
Item-Total Statistics
Scale Mean if
Item Deleted
Scale Variance if
Item Deleted
Corrected
Item-Total Correlation
Cronbach's Alpha
if Item Deleted
X51 32,56 9,633 ,121 ,672
X52 32,86 8,504 ,388 ,600
X53 32,58 8,630 ,485 ,585
X54 32,56 8,633 ,407 ,598
X55 32,28 9,396 ,164 ,663
Empati 18,09 2,658 1,000 ,181
Reliability
Case Processing Summary
N %
Cases Valid 43 100,0
Excludeda 0 ,0
Total 43 100,0
a. Listwise deletion based on all variables in the
procedure.
Reliability Statistics
Cronbach's Alpha N of Items
,759 6
Item-Total Statistics
Scale Mean if
Item Deleted
Scale Variance if
Item Deleted
Corrected
Item-Total Correlation
Cronbach's Alpha
if Item Deleted
Y1 35,14 13,742 ,326 ,763
Y2 34,93 12,781 ,577 ,725
Y3 35,12 13,962 ,361 ,761
Y4 34,93 11,828 ,719 ,693
Y5 34,86 11,456 ,738 ,683
Regression
Variables Entered/Removeda
Model Variables Entered
Variables
Removed Method
1 Empati, Daya
Tanggap, Bukti
Fisik, Kehadalan,
Jaminanb
. Enter
a. Dependent Variable: Kepuasan Siswa
b. All requested variables entered.
Model Summary
Model R R Square
Adjusted R
Square
Std. Error of the
Estimate
1 .457a .209 .202 1.864
a. Predictors: (Constant), Empati, Daya Tanggap, Bukti Fisik, Keadaan,
Jaminan
ANOVAa
Model Sum of Squares Df Mean Square F Sig.
1 Regression 34.019 5 6.804 2.958 .038b
Residual 128.586 37 3.475
Total 162.605 42
a. Dependent Variable: Kepuasan Siswa
Coefficientsa
Model
Unstandardized Coefficients
Standardized
Coefficients
T Sig. B Std. Error Beta
1 (Constant) 13.102 4.241 3.089 .004
Bukti Fisik .191 .160 .158 2.036 .042
Kehandalan .257 .154 .263 2.190 .031
Daya Tanggap .335 .169 .345 2.971 .011
Jaminan .105 .131 .139 .984 .055
Empati .268 .147 .341 2.591 .029
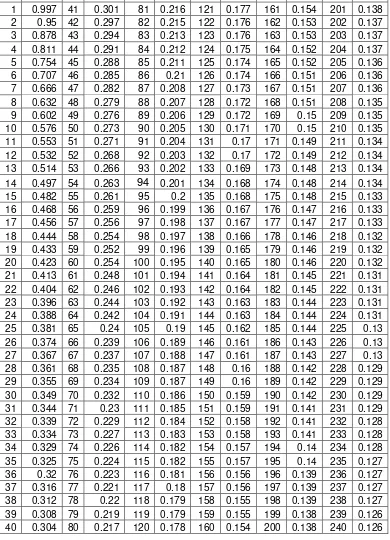
Tabel r Product Moment
Pada Sig.0,05 (Two Tail)
N
r
N
r
N
r
N
r
N
r
N
r