Full Terms & Conditions of access and use can be found at
http://www.tandfonline.com/action/journalInformation?journalCode=cbie20
Download by: [Universitas Maritim Raja Ali Haji] Date: 18 January 2016, At: 21:42
Bulletin of Indonesian Economic Studies
ISSN: 0007-4918 (Print) 1472-7234 (Online) Journal homepage: http://www.tandfonline.com/loi/cbie20
Labour market dimensions of poverty in Indonesia
Armida S. Alisjahbana & Chris Manning
To cite this article: Armida S. Alisjahbana & Chris Manning (2006) Labour market dimensions of poverty in Indonesia , Bulletin of Indonesian Economic Studies, 42:2, 235-261, DOI:
10.1080/00074910600873674
To link to this article: http://dx.doi.org/10.1080/00074910600873674
Published online: 20 Aug 2006.
Submit your article to this journal
Article views: 247
View related articles
Bulletin of Indonesian Economic Studies, Vol. 42, No. 2, 2006: 235–61
ISSN 0007-4918 print/ISSN 1472-7234 online/06/020235-27 © 2006 Indonesia Project ANU DOI: 10.1080/00074910600873674
LABOUR MARKET DIMENSIONS
OF POVERTY IN INDONESIA
Armida S. Alisjahbana* Chris Manning*
Padjadjaran University, Bandung Australian National University
This paper focuses on labour market issues relevant to poverty alleviation. Pat-terns of participation, unemployment and employment are examined among the poor compared with the non-poor in general, among urban and rural households, and among various socio-demographic groups. Using data from the 2002 National Socio-Economic Survey, the paper fi nds that low participation in the workforce and high unemployment, while important, are less closely related to poverty sta-tus than expected, especially among spouses of household heads. However, sec-tor of employment and underemployment are closely associated with poverty, especially for those in informal jobs in urban areas; in rural areas, the poor are heavily concentrated in agriculture. Among the poor, young people and females are more likely to be under employed and to work in agriculture than prime-age workers. The data suggest that labour market policies that tend to protect those in formal sector employment are unlikely to reduce poverty much, if at all.
INTRODUCTION
Study of the labour market dimensions of poverty is a surprisingly neglected sub-ject in the now voluminous academic literature on the poor in Indonesia, and in related policy documents.1 In one sense this is not surprising. Labour market
par-ticipation can be conceived of as an intermediate variable for poverty alleviation on both the supply and the demand side: on the supply side, it intervenes between poverty status and policies that seek to address the welfare of households (such as social expenditures on education and health); on the demand side, it intervenes between poverty status and changes in demand that affect output. Policy mak-ers have typically focused on supply and demand determinants, assuming that labour markets will act as a conduit through which growth and economic and social policies have an impact on the welfare of the poor.
However, labour market imbalance, refl ected in unemployment,
under-employment or low earnings (relative to the earnings of people with similar human capital in similar jobs), can contribute independently to poverty. The poor may be more affected by low levels of mobility, and have less capacity to
under-* This paper had its origins in a note prepared for the World Bank offi ce in Jakarta on the labour dimensions of poverty in Indonesia. The authors would like to thank an anony-mous referee for insightful comments on the paper.
1 Important exceptions are Huppi and Ravallion (1991) and Smith et al. (2002).
236 Armida S. Alisjahbana and Chris Manning
take job searches or bargain with employers, than the non-poor. At the same time, it is useful for policy makers not only to understand the dimensions of labour market problems experienced by the poor, but also to ask which socio-demo-graphic groups among the poor feel labour market diffi culties most acutely.
Specifi cally, we are interested in the extent to which the poor suffer, relative to
the non-poor, as a result of low participation in the workforce (including through unemployment or underemployment), rather than as a result of the kinds of jobs they hold. We also focus on the extent to which labour market participation among the poor, compared with the non-poor, might differ between urban and rural areas, and by gender and age. It might be expected, for example, that the differences will be greater in urban areas, where there is a wider range of jobs and skills, than in rural areas; it is also reasonable to expect the differences between the poor and non-poor in labour market participation to be greater among groups who are likely to be more vulnerable in the labour markets, especially females, young people and less educated people.2
Policy approaches to poverty alleviation should be based in part on an under-standing of some of these relationships. For example, if the issue is mainly low participation and high unemployment rather than the kinds of jobs held by the poor, then greater emphasis might be given to making it easier for individuals to enter the labour market (through improved information, greater mobility and so on), rather than adopting strategies that seek to raise living standards among those already in work. Or, if the poor in certain demographic groups, such as females or youth, are over-represented among the unemployed and low wage earners, then anti-poverty strategies might concentrate on these demographic groups. The focus would be on examining which factors—such as low mobility, inadequate human capital or ‘discrimination’ (statistical or otherwise)—might contribute to high levels of poverty among females or young people in particular.
This paper addresses several of these issues. It focuses on data from the National Socio-Economic Survey (Susenas) for 2002, but also makes some comparisons with data from the Susenas undertaken in 1996, just before the economic crisis of 1997–98. These data allow us to examine the labour force characteristics of the poor, the near-poor and the non-poor, distinguished according to levels of con-sumption in relation to the offi cial poverty line set by the central statistics agency
(BPS). Other labour force data are taken from the National Labour Force Surveys (Sakernas) for various years. Poor people are those falling below the BPS poverty lines for urban and rural areas by province based on the 2002 Susenas (18% of all individuals in 2002).3 The near-poor are defi ned as all persons above the poverty
line in the fi rst two quintiles of consumption per capita (that is, the remaining 2%
of the fi rst quintile and all of the second quintile).4
2 Some of these issues are addressed in the international literature, although even here there is a remarkable paucity of studies dealing with the labour market dimensions of poverty. Lipton (1983) is probably the most comprehensive study. See also Quibria (1993), Mazumdar (1994) and the section on labour in Winters, McCulloch and McKay (2004). 3 In 2002, the poverty lines were Rp 130,000 (approximately $14) and Rp 97,000 (approxi-mately $11) per capita per month, in urban and rural areas respectively.
4 In some of the later empirical analysis we combined the poor and near-poor into one group, since we found very little difference between these two groups in terms of labour
Labour market dimensions of poverty in Indonesia 237
In the second section, we discuss some general dimensions of poverty in Indo-nesia and other developing countries in relation to the labour market. This is followed by an overview of labour market conditions in Indonesia in 2002. The
fi ndings of a logit analysis focusing on the labour market characteristics of poor
households are summarised in the fourth section. The fi fth section looks at
partici-pation rates, unemployment and underemployment among the poor, and other labour market dimensions of poverty: the types of jobs held by the poor and earn-ings per hour. In the discussion we pay special attention to the labour market characteristics of females and young people aged 15–24, in contrast to prime-age male workers. The former two groups typically demonstrate substantial variation in labour market participation and outcomes across regions and countries, and over time. We then examine regional dimensions of poverty status in relation to labour market characteristics, and some changing aspects of this relationship over time. Some policy implications are given in the concluding section.
LABOUR MARKETS AND POVERTY: SOME KEY RELATIONSHIPS
One of the most valuable entitlements of the poor is access to a stable job with a suffi cient income stream. In Indonesia, as in other developing countries, lack of
access to such jobs distinguishes the poor from more fortunate members of soci-ety. Typically, inadequate access may take two forms: less than full involvement in work by household members, and engagement in activities where the returns to labour are low and/or uncertain. The fi rst is typically refl ected in low labour force
participation or activity rates, unemployment or underemployment—what we might refer to as the ‘participation problem’. The second concerns the nature of the jobs undertaken, or the ‘earnings-cum-productivity problem’, as manifested in the kinds of jobs people hold by occupation, industry and work status—wage or non-wage, formal or informal (Lipton 1983).
From the standpoint of economic analysis and policy, and for determining priorities in anti-poverty programs, one challenge is to identify which problem dominates—the participation problem or the earnings-cum-productivity prob-lem—and to fi nd correlates of each. In a perfectly operating labour market, the fi rst problem would not exist, since people would have access to jobs at a level of
remuneration where the labour market clears. Nor would earnings differ between similar jobs requiring comparable skills, in the same regional or national labour market. In practice, a host of frictions in the labour market means that workers are unable to move seamlessly from one job to another (Bhaskar, Manning and To 2002; Ehrenberg and Smith 2006: ch. 5).In addition to pecuniary costs related to distance, other factors such as imperfect information and poor social networks, the high psychological costs of moving from one job to another and discrimina-tion may contribute to both low participadiscrimina-tion and segmented labour markets.5
force patterns. Both differed quite signifi cantly from the non-poor, however, in many la-bour market dimensions.
5 Differences in wages for similar jobs, which might be considered evidence of labour mar-ket segmentation, are inherent in decisions made by profi t-maximising employers: wages vary partly because fi rms incur different quasi-fi xed labour costs (for example, hiring and fi ring costs, contributions to pension funds and fi rm-specifi c investment in training).
238 Armida S. Alisjahbana and Chris Manning
It is arguable that labour market frictions resulting from the cost of moving from one job to another, and which are refl ected in low participation or
remu-neration among working-age persons, are likely to be greater for the poor. Where people are living close to the subsistence level, the risks and psychological costs of movement are high relative to the potential incomes of such people.
Contrasts between urban and rural labour markets and by sex
In developing countries like Indonesia, wage employment is only part—some-times a small part—of the labour market; self-employed and family workers, commonly considered part of the informal sector, account for a signifi cant
pro-portion of the workforce. Urban labour markets tend to display a wider range of earnings between enterprises and within the informal sector than rural labour markets, even after differences in individual and job characteristics are taken into account (Mazumdar 1994). The greater availability of formal work in towns and cities is refl ected in signifi cant urban–rural differences in the key participation
variables: labour force participation rates tend to be lower and unemployment rates higher in urban areas – especially among women, many of whom are ‘sec-ondary’ workers.
What then are the key relationships between the labour market and poverty in urban, mainly non-agricultural sectors likely to be, compared with rural, mainly agricultural activities? In an earlier study, Rodgers (1989) summarised the fi
nd-ings of several studies on poverty and urban labour markets in Latin America and Asia, including Indonesia, conducted in the 1980s. Three main fi ndings emerged
from this research.
• Labour force participation rates tended to be high among the poor, although poor health and related factors had a negative infl uence on participation by
some households (Rodgers 1989: 13).
• The poor tended to experience higher rates of unemployment than the non-poor. In general, none of the studies cited by Rodgers confi rmed the so-called
‘luxury’ unemployment hypothesis, which contends that better-off individuals experience higher rates of unemployment than the poor (who cannot afford to be without a job). However, even if rates were not necessarily higher among the non-poor, relatively well-educated youth were an important segment of the unemployed, especially in several Asian countries (Rodgers 1989: 17). • The poor tended to be concentrated in low-income occupations with uncertain
work, especially in ‘unprotected’ wage jobs, self-employment, and family work in small-scale production and low-income activities such as hawking, shoe-shining and the like (Rodgers 1989: 21).
In these urban contexts, higher levels of education (in part acting as a signalling or screening device for employers), more contacts and more extensive social net-works, access to credit, location (close to a major industrial or service centre) and work experience in the formal sector all tended to be negatively related to poverty (Rodgers 1989: 13).
In rural areas, poverty was much more likely to be associated with lack of access to land among individuals who were dependent on the agricultural sector for a high proportion of their household income (Quibria 1993). The poor were typically over-represented among farm labourers, and under-represented among
Labour market dimensions of poverty in Indonesia 239
individuals who had found work in small-scale business operations or who had migrated on a temporary basis (involving commuting, or circular or seasonal migration) to fi nd jobs in towns. As research in Indonesia has also found (Hart
1986; White and Wiradi 1989), there was a close correlation between access to land and earnings outside agriculture: individuals in larger land-owning households tended to earn a high proportion of household income from non-farm activities.
We examine whether some of these propositions apply to Indonesia in the sub-sequent sections of the paper.
THE INDONESIAN LABOUR MARKET IN 2002
In discussing the relationship between participation in the labour market and poverty, it is important to bear in mind the structure of the labour market and the economic context prevailing in 2002, the year of the Susenas survey on which our analysis is based. In Indonesia, the informal sector—defi ned as including
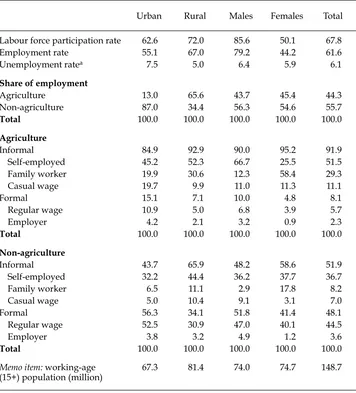
all self-employed and family workers as well as casual wage employees—made up 92% of agricultural employment and 52% of non-agricultural employment in 2002 (table 1).6 Just over 70% of the total workforce was employed in this sector.
Rates of poverty can be expected to be higher than in the formal sector, given that many job seekers resort to self-employed or casual work, or work in small family enterprises, owing to the relative lack of regular wage employment opportunities (Mazumdar 1994).7
The structure of employment differed signifi cantly between urban and rural
areas and by sex: urban informal employment accounted for just over half of all jobs compared with close to 75% in rural areas, and females were more heavily concentrated in informal jobs. Not surprisingly, these contrasts partly refl ect the
dominance of agriculture in rural areas, where self-employment and family work on small farms predominate, and in which females play a major role.8 However,
even in the non-agricultural sector, informal employment is considerably higher in rural than in urban areas in the Indonesian case (table 1).
By 2002 the economy had largely recovered from the crisis, although per cap-ita income levels were still below those prevailing immediately before the crisis.
6 This defi nition of the informal sector, which lumps less skilled workers together with highly skilled professionals, is only a rough approximation. However, given that only around 10% of all self-employed workers, casual wage employees and family workers had a post-secondary education in 2002 (according to the Sakernas), it should give a reasonable estimate of the size of the informal sector.
7 It should be noted nevertheless that entry into some informal sector activities may be diffi cult because they tend to be dominated by specifi c ethnic groups or people from a par-ticular region. This can partly be explained by activity-specifi c knowledge and imperfect information fl ows beyond the insider group, as well as possible discrimination in favour of insiders in the price and quality of inputs and in other aspects of business operation. It is also the case that earnings are not always higher in the formal sector than in the informal sector, especially where activity in the latter involves higher skill levels and signifi cant capital investments.
8 See, for example, Booth (2003) on the distribution of employment according to farm size based on the agricultural census conducted in 1993.
240 Armida S. Alisjahbana and Chris Manning
Macroeconomic conditions were far from stable in this fi rst year of the
Mega-wati government, and Indonesia was still experiencing a signifi cant net outfl ow
of capital.9 Poverty incidence, however, had almost recovered to pre-crisis levels:
according to offi cial (revised) data, the proportion of the population below the
poverty line had fallen back to 18% from a high of 23% in 1999, compared with 15% in 1996, just before the crisis.
9 See, for example, Waslin (2003) and MacIntyre and Resosudarmo (2003).
TABLE 1 Labour Market Structure by Urban/Rural Area and by Sex, 2002 (%)
Urban Rural Males Females Total
Labour force participation rate 62.6 72.0 85.6 50.1 67.8
Employment rate 55.1 67.0 79.2 44.2 61.6
Unemployment ratea 7.5 5.0 6.4 5.9 6.1
Share of employment
Agriculture 13.0 65.6 43.7 45.4 44.3
Non-agriculture 87.0 34.4 56.3 54.6 55.7
Total 100.0 100.0 100.0 100.0 100.0
Agriculture
Informal 84.9 92.9 90.0 95.2 91.9
Self-employed 45.2 52.3 66.7 25.5 51.5
Family worker 19.9 30.6 12.3 58.4 29.3
Casual wage 19.7 9.9 11.0 11.3 11.1
Formal 15.1 7.1 10.0 4.8 8.1
Regular wage 10.9 5.0 6.8 3.9 5.7
Employer 4.2 2.1 3.2 0.9 2.3
Total 100.0 100.0 100.0 100.0 100.0
Non-agriculture
Informal 43.7 65.9 48.2 58.6 51.9
Self-employed 32.2 44.4 36.2 37.7 36.7
Family worker 6.5 11.1 2.9 17.8 8.2
Casual wage 5.0 10.4 9.1 3.1 7.0
Formal 56.3 34.1 51.8 41.4 48.1
Regular wage 52.5 30.9 47.0 40.1 44.5
Employer 3.8 3.2 4.9 1.2 3.6
Total 100.0 100.0 100.0 100.0 100.0
Memo item: working-age (15+) population (million)
67.3 81.4 74.0 74.7 148.7
a Based on the pre-2001 defi nition of unemployment, which excludes discouraged workers, those
establishing a new business and those not yet started in a new job.
Source: Sakernas, 2002.
Labour market dimensions of poverty in Indonesia 241
In line with the slow recovery in investment, most labour indicators suggest Indonesia was experiencing a major problem in formal sector job creation. While the overall unemployment rate in 2002 (6.1% according to the pre-2001 defi nition)
was 20% above rates in the pre-crisis period (although still quite low by devel-oping country standards), most of the new jobs after the crisis were created in agriculture and the informal sector. Agricultural employment increased by over 1% p.a. between 1996/97 and 2002/03—faster than the growth in non-agricul-tural jobs—after declining in the decade before the crisis.10 The share of non-wage
employees in non-agricultural employment rose from 50% to 56%, while the share of wage employees fell by a similar percentage over the same period. In absolute terms the latter sector actually lost over 1 million jobs during this period. This marked a signifi cant reversal of pre-crisis trends, when the formal sector was the
major source of employment growth, expanding by over 5% p.a. over the decade from 1986/87 to 1996/97.
Finally, the Indonesian government embarked on an aggressive minimum wage policy to restore and increase real wages after a sharp decline during the crisis, in addition to radically rewriting labour protection laws to introduce a number of new minimum standards for wage workers. By 2002, real minimum wages were already 30–50% higher in real terms in major urban centres (Jakarta, Bandung and Surabaya) than they had been immediately before the crisis (Manning 2003).
OVERALL RELATIONSHIPS:
A STATISTICAL ANALYSIS OF LABOUR AND POVERTY
A logit regression model was employed, using the 2002 Susenas data, to identify the variables associated with household poverty status, taking poor and near-poor households as the reference category.11 The model seeks to incorporate the
key labour market relationships that could be expected to be associated with pov-erty, most importantly the activities of the household head and participation in work by other household members.12 A set of other control variables was also
included in the equation, such as the age, gender and education of the household head, the household dependency ratio and locational characteristics.
Table 2 provides parameter estimates of the logit estimation for all households, single-headed households and households with married couples. The key vari-able was the labour market status of the household head: whether he or she was in the labour market and, if in the labour market, in what sector and whether fully employed or underemployed. Households in which the head was fully employed
10 These trends are all based on data from the annual Sakernas; see Alisjahbana and Man-ning (2005) for a fuller exposition.
11 Casual observation suggests that near-poor households have much in common with poor households. We tested the model for all households with married heads, taking poor households, rather than the poor and near-poor, as the reference group. The signs were the same for all coeffi cients, and the parameter values very similar in most cases; statistical signifi cance was also similar for all variables in both cases. However, the parameter values were smaller for the sex (male) variable, and larger (negative) for urban areas.
12 We do not address the issue of causality in this model. That is, the logit model does not distinguish whether poverty is a cause or a consequence of various labour market charac-teristics.
242
Armida S.
Alisjahbana and Chris Manning
TABLE 2 The Probablility of Being Non-Poor, 2002a
Variable All Households Single-headed Households Married Couple Households
Coef. Std Err.
Z m.e.b Coef. Std
Err.
Z m.e.b Coef. Std
Err.
Z m.e.b
Household head characteristics
Age –0.10 0.00 –34.79 *** –0.02 –0.09 0.01 –10.60 *** –0.02 –0.09 0.00 –26.42 *** –0.02
Age squaredc 0.00 0.00 37.07 *** 0.00 0.00 0.00 11.76 *** 0.00 0.00 0.00 26.98 *** 0.00
Sex
Male –0.32 0.02 –16.02 *** –0.07 0.39 0.04 9.50 *** 0.06 0.15 0.24 0.61 0.04
Schooling (reference variable: primary or less)
Primary or less –0.01 0.01 –0.76 0.00 0.04 0.05 0.76 0.01 0.17 0.02 10.12 *** 0.04
Junior secondary 0.54 0.02 31.72 *** 0.11 0.44 0.08 5.87 *** 0.07 0.66 0.02 31.86 *** 0.15
Senior secondary & above 0.96 0.02 53.61 *** 0.18 0.19 0.04 4.59 *** 0.03 0.84 0.02 45.98 *** 0.19
Labour force status (reference variable: in non-agriculture, IFS & fully employed)
Outside workforce –0.34 0.02 –19.08 *** –0.08 –0.39 0.05 –7.40 *** –0.07 –0.45 0.02 –21.68 *** –0.11
Unemployed –0.42 0.02 –18.21 *** –0.10 –0.91 0.07 –13.17 *** –0.18 –0.44 0.03 –16.44 *** –0.11
Professional, managerial & clerical 1.09 0.03 32.63 *** 0.19 0.84 0.14 5.84 *** 0.11 0.75 0.04 20.73 *** 0.16 In agriculture & underemployed –0.83 0.05 –16.05 *** –0.20 –1.09 0.16 –6.95 *** –0.23 –0.86 0.06 –14.23 *** –0.21 In agriculture & fully employed –0.67 0.02 –39.14 *** –0.15 –0.91 0.06 –15.22 *** –0.18 –0.60 0.02 –29.81 *** –0.15 In non–agriculture, FS
& underemployed
–0.56 0.09 –6.06 *** –0.13 –0.90 0.27 –3.32 *** –0.19 –0.58 0.11 –5.47 *** –0.14
In non–agriculture, IFS & underemployed
–0.51 0.08 –6.77 *** –0.12 –0.79 0.25 –3.20 *** –0.16 –0.58 0.09 –6.75 *** –0.14
In non–agriculture, FS & fully employed
0.26 0.02 14.35 *** 0.06 –0.08 0.07 –1.17 –0.01 0.13 0.02 6.30 *** 0.03
Labour market dimensions of poverty in Indonesia
243
Spouse characteristics
Labour force status (reference variable: in non–agriculture, IFS)
Outside workforce 0.27 0.03 10.23 *** 0.07
Unemployed 0.58 0.04 14.79 *** 0.13
Professional, managerial & clerical 1.51 0.07 23.24 *** 0.28
In agriculture –0.61 0.02 –25.91 *** –0.15
In non-agriculture, FS 0.12 0.03 3.95 *** 0.03
Household characteristics
Dependency ratiod –2.25 0.02 –92.68 *** –0.49 –2.12 0.06 –34.86 *** –0.36 –2.40 0.03 –79.46 *** –0.58
Employment ratioe 0.62 0.02 28.38 *** 0.14 2.19 0.07 30.23 *** 0.37 1.21 0.04 28.93 *** 0.29
Location characteristics
Urban–rural (reference variable: rural)
Urban 0.04 0.01 2.70 *** 0.01 0.04 0.04 0.86 0.01 –0.10 0.02 –6.37 *** –0.02
Region (reference variable: Eastern Indonesia)
Sumatra 0.56 0.02 24.50 *** 0.12 0.93 0.07 13.51 *** 0.14 0.50 0.03 19.04 *** 0.12
Java–Bali 0.32 0.02 14.59 *** 0.07 0.42 0.06 6.50 *** 0.07 0.12 0.03 4.66 *** 0.03
Kalimantan 1.00 0.03 37.84 *** 0.18 0.71 0.08 8.56 *** 0.10 1.05 0.03 34.94 *** 0.22
Sulawesi 0.46 0.03 18.64 *** 0.09 0.37 0.07 4.95 *** 0.06 0.40 0.03 13.90 *** 0.09
Constant 2.84 0.08 36.34 *** 0.00 1.43 0.25 5.75 *** 0.00 1.88 0.25 7.43 *** 0.00
No. of observations 187,783 23,078 138,742
Likelihood ratio statistic 26,317 *** 3,177 *** 23,091 ***
Coef. = coeffi cient; std err. = standard error; Z = Z statistic; m.e. = marginal effect; IFS = in the informal sector; FS = in the formal sector.
* = signifi cant at 10%; ** = signifi cant at 5%; *** = signifi cant at 1%.
a Bivariate division of the dependent variable into two groups: poor and near-poor (combined), and non-poor. The poor and near-poor is the omitted category. b Marginal effect is the rate of change in the probability of a household being non-poor due to a unit change in the regressor. Marginal effects are evaluated at the regressor means.
c The estimated coeffi cients on this variable were all 0.001.
d Dependency ratio = ratio of children aged less than 15 to number of working-age persons in each household. e Employment ratio = ratio of employed persons to number of working-age persons in each household.
Source: Susenas, 2002.
244 Armida S. Alisjahbana and Chris Manning
in the informal sector, outside agriculture, were chosen as the reference category. Most of the implied relationships were as expected between the main ‘explana-tory’ variables on the one hand (the labour market characteristics of the house-hold head and the spouse of the head, as well as the participation of househouse-hold members in the labour market) and poverty status on the other. Fully employed formal sector workers in the non-agricultural sector, and professional, managerial and clerical employees, were more likely to be among the non-poor, while those in all other labour force categories were less likely to live in non-poor households than the reference group. These latter categories comprised household heads who were outside the workforce, unemployed, employed as agricultural workers (both fully employed and underemployed) and underemployed in the non-agricultural formal sector. All coeffi cients were signifi cant at the 1% level. Underemployed
family heads working in agriculture were especially likely to be in households below or close to the poverty line.
Three results stand out with regard to the labour market and employment sta-tus of the household head. First, household heads outside the workforce, and those who were unemployed, were less likely to be non-poor (a negative
coef-fi cient in table 2); that is, they were more likely to be members of a poor or
near-poor household. Second, people employed in agriculture—regardless of whether they were fully employed or underemployed—were similarly more likely to be poor or near-poor. And third, the underemployed were also more likely to be poor or near-poor, irrespective of whether they worked in the formal or informal sector. All these results are relative to the reference group of households whose heads were fully employed in the informal, non-agricultural sector.
The fi rst fi nding is not controversial. The second reminds us of the extent to
which attachment to the agricultural sector in many parts of Indonesia (especially Java–Bali and Eastern Indonesia) is associated with limited access to fertile land, and with uncertain and low-paid employment.13 The third challenges the notion
that formal sector work per se is likely to lift individuals out of poverty; the utilisa-tion of labour in terms of hours worked, in addiutilisa-tion to productivity and wages, also matters considerably.
Other labour market characteristics tested in the regression included the number of employed persons in the household (employment ratio in table 2) and the labour force status of the spouse of the household head (in households in which the head was married; see last fi ve columns in table 2). As might be
expected, the number of working household members was positively related to the probability of being non-poor; a higher employment ratio would mean that households could take advantage of additional sources of income from working household members.
However, the variable measuring the spouse’s labour force status produced some unexpected results.14 In contrast to household heads, spouses outside the
labour market and unemployed spouses were more likely to be among the non-poor (a positive coeffi cient in table 2) than spouses in the reference group (those
employed in informal work outside agriculture). These fi ndings provide some
13 See especially World Bank (1983), Hart (1986) and Breman and Wiradi (2001). 14 As might be expected, a high proportion of spouses were female.
Labour market dimensions of poverty in Indonesia 245
support for the ‘luxury unemployment’ hypothesis—that spouses of the house-hold head are more likely to be outside the workforce, or looking for work, pre-cisely because they are less likely to work out of economic necessity. However, like household heads, spouses employed in the formal, non-agricultural sector, or working as professionals, managers and clerks, were more likely to belong to non-poor households.
Among other characteristics of the household head, higher levels of education were strongly associated with the probability of a household escaping poverty, but the age and sex variables gave mixed results. The probability of being non-poor was higher if the household head had at least a junior secondary education, relative to those who had a primary education or less. The coeffi cients for junior
secondary, and for senior secondary or higher education, were both positive and signifi cant, with that for the latter being larger than that for the former, as one
would expect. Surprisingly, however, the probability of households being non-poor was negatively related to the age of household head up to age 45.5 years, and positively related beyond this (bearing in mind the positive coeffi cient on the
age-squared variable). The Z statistics show that both the age and age-squared coeffi cients are signifi cant at the 1% level; on the other hand, the marginal effects
are very small, suggesting that the overall relationship between age of household head and household poverty status is of trivial importance once all the other fac-tors are accounted for.15 Male household heads were more likely to be among
the non-poor (a positive coeffi cient) in the equation for single-headed households
and households with married heads but, surprisingly, not for the sample contain-ing all households.
Turning to household characteristics, table 2 shows that poor and near-poor households were more likely to have a higher dependency ratio; that is, house-holds were more likely to be poor if they had more children relative to the number of household members of working age (i.e. all those aged 15 years and above). A set of locational variables indicates the expected positive and signifi cant effect of
urban location on a household’s probability of being non-poor, although the
coef-fi cient is small and the sign is reversed for urban households that include
mar-ried couples. Similarly, the probability of being in a poor household was lower for households located in Java–Bali, Sumatra, Kalimantan and Sulawesi than for those located in the poorer regions of Eastern Indonesia. Among the island groups, the marginal effect for all households was much larger for Kalimantan and Sumatra than for Java–Bali.
To summarise, the labour force and work characteristics of the household head and spouse are signifi cantly correlated with poverty status (i.e. being poor or
near-poor), even after we control for a range of other personal and household characteristics. Whether household heads work, and the sector in which they work, are important, and participation in the non-agricultural sector in particular (whether in the formal or informal sector) is associated with a higher probability of being non-poor. Participation by spouses per se tends to matter much less than
15 The unexpected negative sign for age may be the result of a positive association be-tween age and attachment to the informal sector. Proportionately fewer young people were employed in the informal sector than in the formal sector in 2002; the opposite was the case for older people.
246 Armida S. Alisjahbana and Chris Manning
the participation of household heads. For spouses, the nature of work is much more closely correlated with poverty status. We examine some of these relation-ships in more detail in the following section.
PATTERNS OF LABOUR FORCE PARTICIPATION, EMPLOYMENT AND EARNINGS
One might expect the poor in Indonesia to share many of the labour market char-acteristics of the poor in other developing countries discussed earlier, given the patterns of participation, unemployment and employment shown in table 1: mod-erate unemployment rates but much higher underemployment, and a substantial share of the workforce employed in agriculture and in the informal sector. How-ever, there were some specifi c characteristics of the labour market that might be
expected to contribute to rather different patterns: slowing labour force growth rates from the 1990s; relatively low unemployment rates among prime-age work-ers; quite high female participation rates; and a sustained period of rapid eco-nomic growth, brought to an end by the crisis in 1997–98 (Manning 2003).
In the logit analysis we have seen that most of the labour market variables were signifi cant and had the expected signs for household heads, although there were
some unexpected results for the spouse of the household head. Here we exam-ine some of these relationships in greater detail, focusing on three sub-groups in the population: females; youth (aged 15–24); and prime-age males (aged 25–59). Both of the fi rst two groups typically contain a signifi cant proportion of
second-ary workers, that is, workers other than the main breadwinner in the household. In addition, we examine participation and employment among the poor in urban and rural locations in greater detail, before turning briefl y to a consideration of
some regional dimensions and trends over time.
Participation rates, unemployment and underemployment
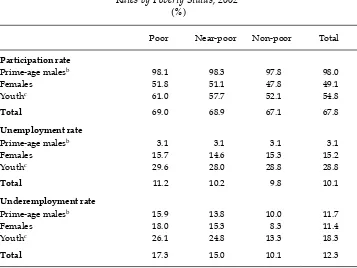
Indonesia is not unlike many other developing countries in that the main labour market correlates of poverty appear to be sector of employment and work sta-tus rather than the extent of participation in the workforce. Participation and unemployment rates were relatively uniform across expenditure classes in 2002 (table 3).16 The major exception was participation by young people: individuals
aged 15–24 in poor and near-poor households displayed signifi cantly higher
par-ticipation rates than youth in non-poor households.
In contrast to participation and unemployment rates, underemployment was signifi cantly higher among the poor and near-poor than among the non-poor.17
16 Following BPS, we include in the unemployed category those not working but looking for work, and also people neither working nor looking for work but available for work (‘discouraged’ workers). There are some conceptual problems in including discouraged workers as unemployed, especially without reference to reservation wages (Suryadarma, Suryahadi and Sumarto 2005). Discouraged workers are more likely to include older, ru-ral and female people, who are also likely to be more heavily represented in poor house-holds.
17 The underemployed are defi ned here as those working more than one but less than 35 hours per week, and looking for more work.
Labour market dimensions of poverty in Indonesia 247
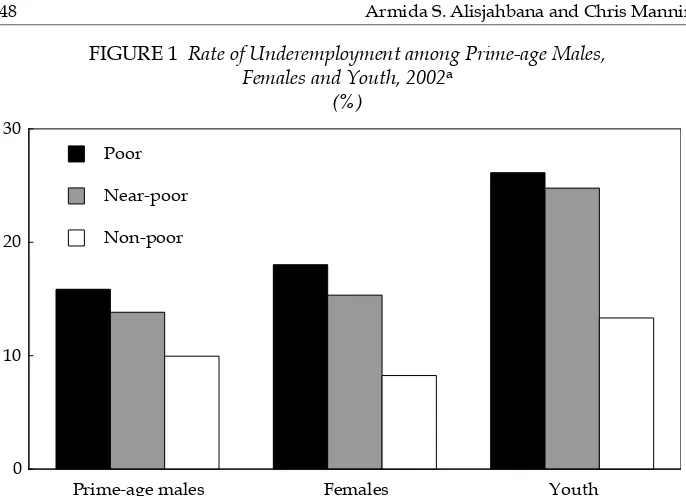
Figure 1 shows that underemployment was especially high among females and young people in poorer households compared with the same groups in non-poor households.
Thus, in terms of participation in work, the main differences between poor and non-poor households were experienced most sharply among youth and, to a lesser extent, females. Younger people from poor and near-poor families who were just out of school, or in families unable to afford schooling, were much more likely to be in the workforce and, if they did work, to be underemployed, than their bet-ter-off contemporaries.18 Higher participation among poor youth is presumably
18 Note that full-time students are classifi ed as being outside the labour force (along with housewives and the infi rm), provided they are not looking for work. Anyone who works a minimum of one hour a week is considered to be employed, even though the principal activity may be school, university or household work.
TABLE 3 Participation, Unemployment and Underemployment Rates by Poverty Status, 2002a
(%)
Poor Near-poor Non-poor Total
Participation rate
Prime-age malesb 98.1 98.3 97.8 98.0
Females 51.8 51.1 47.8 49.1
Youthc 61.0 57.7 52.1 54.8
Total 69.0 68.9 67.1 67.8
Unemployment rate
Prime-age malesb 3.1 3.1 3.1 3.1
Females 15.7 14.6 15.3 15.2
Youthc 29.6 28.0 28.8 28.8
Total 11.2 10.2 9.8 10.1
Underemployment rate
Prime-age malesb 15.9 13.8 10.0 11.7
Females 18.0 15.3 8.3 11.4
Youthc 26.1 24.8 13.3 18.3
Total 17.3 15.0 10.1 12.3
a Participation rate = labour force/working-age population. Unemployment rate = unemployed/
labour force (using the 2002 revised defi nition, which includes discouraged workers).
Underemploy-ment rate = population working less than 35 hours per week and prepared to take on more work/total employed. All three are expressed as percentages.
b Prime-age males are workers aged 25–59. c Youth are workers aged 15–24.
Source: Authors’ calculations, based on the 2002 Susenas.
248 Armida S. Alisjahbana and Chris Manning
partly a refl ection of above-average school dropout rates among the poor, and
higher rates of school participation among the non-poor.
Consistent with the fi ndings of the logit model above, the ‘luxury’
unem-ployment hypothesis does not appear to be confi rmed as a dominant feature of
employment in Indonesia, even if a relatively high proportion of young and better-educated people dominates among the unemployed.19 Labour markets do not
clear for many younger, disadvantaged people as well, suggesting that policies that support job creation for these groups could contribute to poverty reduction.
It is worth mentioning that even though underemployment was a greater prob-lem in rural areas, and unemployment in urban areas (among all income classes),20
younger and female workers in poor households were especially disadvantaged by shorter hours of work relative to their better-off counterparts in towns and cities. Thus 15–20% of younger and female workers in poor urban households worked less than 35 hours per week and were searching for more work. In con-trast, only around 5% of such workers in non-poor urban households were under-employed and looking for more work.
19 See, for example, Manning and Junankar (1998).
20 For example, according to the 2002 Susenas, 19% of females were unemployed and 8% were underemployed in urban areas, compared with 12% and 14% respectively in rural areas.
FIGURE 1 Rate of Underemployment among Prime-age Males, Females and Youth, 2002a
(%)
Prime-age males Females Youth
0 10 20 30
Poor
Near-poor
Non-poor
a Prime-age males are workers aged 25–59; youth are workers aged 15–24.
Source: Authors’ calculations, based on the 2002 Susenas.
Labour market dimensions of poverty in Indonesia 249
Patterns of employment and earnings
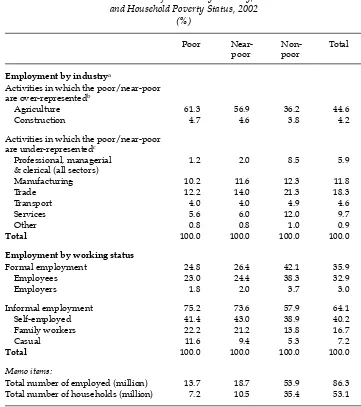
In relation to employment, the differences between household expenditure groups were signifi cant for households with members working in agriculture
and in the informal sector, as earlier studies of poverty in Indonesia have sug-gested (Huppi and Ravallion 1991; Smith et al. 2002). These patterns are evident in the proportion of workers from poor households, compared with those from
TABLE 4 Distribution of Workers by Industry, Work Status and Household Poverty Status, 2002
Activities in which the poor/near-poor are over-representedb
Agriculture 61.3 56.9 36.2 44.6
Construction 4.7 4.6 3.8 4.2
Activities in which the poor/near-poor are under-representedc
Professional, managerial & clerical (all sectors)
1.2 2.0 8.5 5.9
Manufacturing 10.2 11.6 12.3 11.8
Trade 12.2 14.0 21.3 18.3
Formal employment 24.8 26.4 42.1 35.9
Employees 23.0 24.4 38.3 32.9
Employers 1.8 2.0 3.7 3.0
Informal employment 75.2 73.6 57.9 64.1
Self-employed 41.4 43.0 38.9 40.2
Family workers 22.2 21.2 13.8 16.7
Casual 11.6 9.4 5.3 7.2
Total 100.0 100.0 100.0 100.0
Memo items:
Total number of employed (million) 13.7 18.7 53.9 86.3 Total number of households (million) 7.2 10.5 35.4 53.1
a The distribution of workers by industry excludes professional, managerial and clerical workers. b Over-represented = the proportion of poor/near-poor employed is greater than the proportion of
the total employed in this activity.
c Under-represented = the proportion of poor/near-poor employed is less than the proportion of the
total employed in this activity.
Source: Authors’ calculations, based on the 2002 Susenas.
250 Armida S. Alisjahbana and Chris Manning
non-poor households, employed in agriculture and the informal sector—the lat-ter especially among casual employees and, to a lesser extent, family workers (table 4). The distribution of the near-poor also differed from that of the non-poor in this respect.
Outside agriculture, however, the poor were more heavily concentrated than the non-poor only in construction. In contrast, they were under-represented among white-collar workers and in trade and services (although less so in manu-facturing), in both urban and rural areas. As suggested in some of the studies of poverty discussed above, both self-employed and family workers were less likely to be members of poor households if they worked outside agriculture than if they worked within it.21
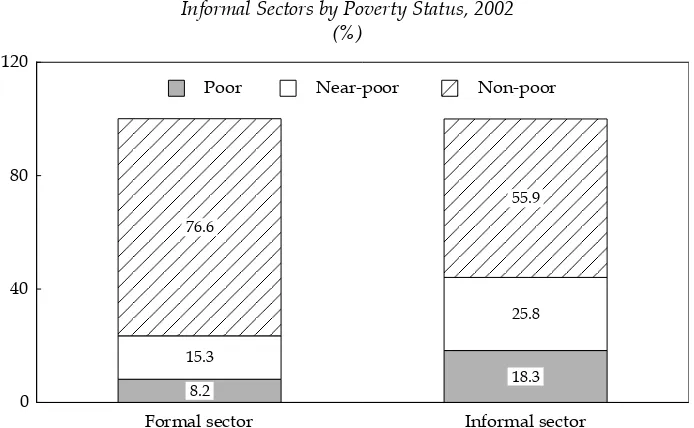
The fi ndings for manufacturing are surprising, given that movements out of
agriculture into industry are commonly believed to be associated with improved wages and living standards. These results are partly explained by differences in the poverty status of formal and informal sector workers within manufacturing.22
Thus, as shown in fi gure 2, there was a higher probability of manufacturing
work-ers who were self-employed, family workwork-ers or casual employees being attached to poor or near-poor households. Nevertheless, at the same time, a signifi cant
number of formal sector workers in manufacturing (close to 25%) were members
21 Half of all informal sector workers in agriculture are attached to poor households; this proportion falls to one-third for informal workers in non-agricultural jobs.
22 Bear in mind that many manufacturing plants are cottage industries employing less than fi ve workers (often working on an irregular basis and consisting largely of family members). Approximately 40% of all employees in manufacturing were working in cottage enterprises in 2002.
FIGURE 2 Distribution of Manufacturing Workers between Formal and Informal Sectors by Poverty Status, 2002
(%)
Formal sector Informal sector
0 40 80 120
8.2 15.3 76.6
18.3 25.8 55.9
Poor Near-poor Non-poor
Source: Authors’ calculations, based on the 2002 Susenas.
Labour market dimensions of poverty in Indonesia 251
of poor or near-poor households. The large majority were regular wage employ-ees rather than casual workers. It seems likely that many of them worked in small and cottage industries in rural areas, where reservation wages were more likely to be set by standards in agriculture than in modern industry.
Within the informal sector, casual wage workers were more likely than either family workers or the self-employed to be members of poor households. Thus it is important to underline the fact, emphasised in several studies of India in particu-lar, that the contrast in poverty among various work status groups is not merely a question of whether people are engaged in wage or non-wage employment.23 The kind of wage employment also matters.
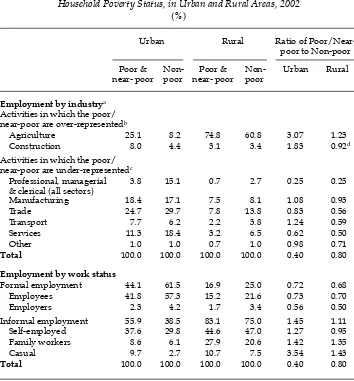
The data also reveal some important differences in the participation of individ-uals in poor/near-poor and non-poor households in urban compared with rural areas. Workers in poor and near-poor urban households were heavily concen-trated in several non-agricultural sectors, especially construction and transport, in which short-term contracts and low-income urban jobs such as becak (trishaw) driving are common. This is shown by the ratio of the share of the poor/near-poor to that of the non-poor in particular sectors (table 5). Thus, for example, almost twice (1.83 times) as many poor as non-poor urban workers were employed in construction. On the other hand, workers from poor urban households were rel-atively under-represented in trade (including restaurants and hotels) and serv-ices.
However, among poor and non-poor workers, the pattern of participation in jobs outside agriculture was different for rural areas. In general, the data provide some indication that most non-farm sectors, even construction and transport, offer more opportunities for households to move out of poverty in rural areas, com-pared to the greater bunching of poor workers in some non-agricultural sectors in cities and towns. Trade in particular is a good example of a sector in which the proportion of poor individuals employed in rural areas was considerably smaller than that of the non-poor (nearly half); in urban areas the situation was different, with a similar share of poor/near-poor and non-poor being employed in trade. Many of the former presumably earned an income from hawking or other itiner-ant activities in middle-class neighbourhoods.
To what extent do employed persons in poor/near-poor households differ from the non-poor in terms of work patterns by age and sex? Agriculture was over-represented among the poor, especially among prime-age males, but also among youth and females (data not shown in table 5). It is instructive neverthe-less that a smaller proportion of prime-age males in poor/near-poor rural fami-lies was employed in both manufacturing and construction, compared with other demographic groups and with prime-age males in poor households who were engaged in the same sectors in towns and cities. While a surprisingly high propor-tion of poor workers was represented in both these sectors overall, in rural areas they probably consisted mainly of secondary workers, that is, youth and female workers, rather than main breadwinners of households.
23 See especially the earlier research by Breman (1980) and Harriss (1981a, 1981b).
252 Armida S. Alisjahbana and Chris Manning
Average earnings
While there were important differences in both the extent and nature of participa-tion in the labour market among individuals from poor and non-poor households, these contrasts tell only part of the story. In addition, the disparity in earnings per hour of regular employees was particularly marked. (The Susenas does not report the earnings of informal sector workers, or those of non-regular wage workers.)
TABLE 5 Distribution of Workers by Industry, Work Status and Household Poverty Status, in Urban and Rural Areas, 2002
(%)
Agriculture 25.1 8.2 74.8 60.8 3.07 1.23
Construction 8.0 4.4 3.1 3.4 1.83 0.92d
Activities in which the poor/ near-poor are under-representedc
Professional, managerial & clerical (all sectors)
3.8 15.1 0.7 2.7 0.25 0.25
Manufacturing 18.4 17.1 7.5 8.1 1.08 0.93
Trade 24.7 29.7 7.8 13.8 0.83 0.56
Transport 7.7 6.2 2.2 3.8 1.24 0.59
Services 11.3 18.4 3.2 6.5 0.62 0.50
Other 1.0 1.0 0.7 1.0 0.98 0.71
Total 100.0 100.0 100.0 100.0 0.40 0.80
Employment by work status
Formal employment 44.1 61.5 16.9 25.0 0.72 0.68
Employees 41.8 57.3 15.2 21.6 0.73 0.70
Employers 2.3 4.2 1.7 3.4 0.56 0.50
Informal employment 55.9 38.5 83.1 75.0 1.45 1.11
Self-employed 37.6 29.8 44.6 47.0 1.27 0.95
Family workers 8.6 6.1 27.9 20.6 1.42 1.35
Casual 9.7 2.7 10.7 7.5 3.54 1.43
Total 100.0 100.0 100.0 100.0 0.40 0.80
a The distribution of workers by industry excludes professional, managerial and clerical workers. b Over-represented = the proportion of poor/near-poor employed is greater than the proportion of
the total employed in this activity.
c Under-represented = the proportion of poor/near-poor employed is less than the proportion of the
total employed in this activity.
d The poor/near-poor are slightly under-represented in rural areas in construction.
Source: Authors’ calculations, based on the 2002 Susenas.
Labour market dimensions of poverty in Indonesia 253
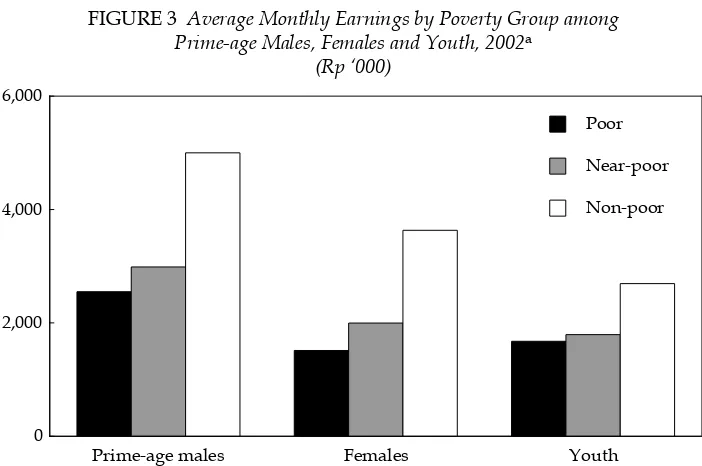
While differences between the poor and near-poor were relatively small, hourly earnings among non-poor households were on average close to 2.5 times those reported for the poor in urban areas, and twice those of the poor in rural areas. Similar disparities were evident for population sub-groups (fi gure 3). The
differ-ences were especially large among employees in rural households and for females. In the case of females, wages earned by regular employees in poor households were barely half those of female employees in all households. These data suggest that serious disadvantage helps explain the poverty status of many households containing females and young people engaged in regular wage employment.
REGIONAL DIMENSIONS
While participation rates among the poor differed only slightly across regions, the poor constituted a far higher proportion of the unemployed on Java–Bali than in the other regions (table 6). This can be attributed in part to the much higher share of total employment in towns and cities on Java–Bali compared with other regions in Indonesia. The poor also represented a larger share of the underemployed on Java–Bali than in the other regions.24
The informal sector was smaller on Java–Bali. This refl ects both the region’s
smaller agricultural sector, where many self-employed and family workers (who
24 Overall rates of underemployment were nevertheless higher in several of the more ag-riculturally based Outer Island regions, notably Sulawesi and Eastern Indonesia (over 20% in both regions), than on Java–Bali.
FIGURE 3 Average Monthly Earnings by Poverty Group among Prime-age Males, Females and Youth, 2002a
(Rp ‘000)
Prime-age males Females Youth
0 2,000 4,000 6,000
Poor
Near-poor
Non-poor
a Refers to regular wage employees.
Source: Authors’ calculations, based on the 2002 Susenas.
254 Armida S. Alisjahbana and Chris Manning
are classifi ed as informal) are concentrated, and its more developed
manufactur-ing and service sectors. Nevertheless, the contrast between the poor and non-poor with regard to participation in the agricultural sector and the informal sector was also greater on Java–Bali (i.e. there was higher participation in both sectors by individuals from poor than non-poor households).
The contrast between regions was slightly different, however, for hourly earn-ings of regular wage workers. The differences with regard to earnearn-ings among the poor and non-poor were substantial in all regions, Nevertheless, the contrast was again greatest on Java–Bali. The latter in part refl ects higher average earnings
TABLE 6 Participation, Unemployment and Underemployment Rates and Sector of Employment for People in Poor Households, by Major Island Group, 2002
(%)
Participation 68.6 69.8 73.1 66.2 72.4 69.0
Unemployment 11.2 11.7 9.6 12.8 8.2 11.2
Underemployment 17.9 13.4 14.0 20.1 21.8 17.3
Ratios of rates for the poor to total ratesa
Participation 1.02 1.01 1.03 1.03 0.97 1.02
Unemployment 1.18 1.07 1.01 0.92 0.84 1.11
Underemployment 1.52 1.21 1.11 1.31 1.09 1.41
Sector of employment
Agriculture 55 71 75 77 79 62
Non-agriculture 45 29 25 23 21 38
Total 100 100 100 100 100 100
Formal sector 29 24 18 14 12 25
Informal sector 71 76 82 86 88 75
Total 100 100 100 100 100 100
Ratio of rates for the poor to total ratesa
Agriculture 1.4 1.2 1.3 1.3 1.1 1.3
Non-agriculture 0.7 0.7 0.6 0.6 0.7 0.7
Formal sector 0.7 0.7 0.5 0.5 0.7 0.7
Informal sector 1.3 1.1 1.2 1.2 1.1 1.2
Share of people in poor households in total employed
16 15 11 19 25 16
a Total rates omitted for brevity.
Source: Authors’ calculations, based on the 2002 Susenas.
Labour market dimensions of poverty in Indonesia 255
among the non-poor on Java–Bali, which can be attributed to better education on the supply side, and a more differentiated employment structure in the Outer Island regions. On Java–Bali, average earnings were 2.5 times higher among regu-lar employees in non-poor than poor households, compared with a smaller but still substantial difference of 1.5–2.0 times in the other regions. The most consist-ent characteristic of the poor in all regions was low earnings, refl ecting the
con-centration of the poor in relatively low-wage sectors of employment.
There were some important regional differences in labour market character-istics among the poor and non-poor. The contrasts were more marked on rela-tively land-scarce Java–Bali than in the other major Outer Island groups (Sumatra, Kalimantan, Sulawesi and Eastern Indonesia). In part this can be related to land scarcity, higher levels of urbanisation and higher levels of participation in non-agricultural activities on Java–Bali, and hence greater differentiation in labour markets than in other regions.
TRENDS, 1996–2002
How have the labour market characteristics of the poor changed since the crisis of 1997–98? Given the slow growth in formal sector employment since then, it might be expected that in 2002 the poor would be more concentrated in agriculture and in low earnings activities outside agriculture. However, a comparison of the data for 1996 and 2002 suggests there has been relatively little change in the labour market characteristics of individuals from poor households compared with those from other (near-poor and non-poor) households.
For this comparison over time, there is a slight change in the way we defi ne
poor households. Here, the ‘poor’ refers to the fi rst quintile (the bottom 20%) of
the income distribution in both 1996 and 2002 (in contrast to the bottom 18%, as defi ned by the offi cial poverty line of 2002, in tables 1–6). However, the term
‘non-poor’ covers the top 60% (the top three quintiles) of the population in all tables. Overall, for all employed people, changes in patterns of involvement in the workforce were small between 1996 and 2002 (table 7). Participation rates fell slightly, while unemployment rose and underemployment fell. A small decline in agriculture’s share of employment was offset by rises in the shares of people employed in manufacturing, trade and other sectors, but not services. The fall in the share of agricultural jobs was experienced by all groups—poor and non-poor alike—although the non-poor registered the largest relative decline.
Participation rates among actual and potential workforce participants from poor households fell between 1996 and 2002 and unemployment rose; underemploy-ment fell, however. The former two changes suggest an increase in labour market pressures experienced by poor households, while the latter implies improvement. The fall in underemployment is probably related partly to changes in sector of employment. By 2002 the poor were less likely than the population as a whole to be engaged in agriculture, where underemployment tends to be highest, and more likely to have found jobs in construction, manufacturing and trade.
Bearing in mind changes in the defi nition of the workforce and
unemploy-ment since 1996 (see notes to table 7), it would not be advisable to read too much into these changes. The overwhelming impression is one of relative stability in labour market participation among those from poor households. In 1996 the poor
256
Armida S.
Alisjahbana and Chris Manning
TABLE 7 Labour Market Characteristics of Workers in Poor, Near-poor and Non-poor Households, 1996 and 2002a
(%)
1996 2002 Ratio of Poor to
All Households
Poor Near-poor Non-poor Total Poor Near-poor Non-poor Total 1996 2002
Participation rate 69.8 68.8 63.4 67.3 67.2 66.5 63.2 65.6 1.04 1.02
Unemployment rateb 3.0 3.7 5.5 4.1 5.4 5.8 6.3 5.8 0.73 0.93
Underemployment ratec 49.1 44.6 33.4 42.4 41.0 37.0 25.9 34.6 1.16 1.18
Employment by industry
Agriculture 73.0 63.5 35.7 45.4 68.6 57.4 29.8 44.7 1.61 1.53
Manufacturing 7.6 9.5 11.8 10.9 8.9 11.4 14.6 12.6 0.69 0.70
Construction 3.5 4.6 5.0 4.8 4.0 4.5 4.4 4.3 0.74 0.92
Trade 7.3 10.7 20.2 16.9 9.7 14.4 24.2 18.8 0.43 0.52
Services 5.5 7.3 19.8 15.6 4.7 6.7 18.2 12.6 0.35 0.37
Other 3.2 4.3 7.6 6.4 4.1 5.6 8.7 7.0 0.49 0.59
Total 100.0 100.0 100.0 100.0 100.0 100.0 100.0 100.0
Memo item: Total employment (million)
17.1 17.1 46.4 80.6 19.8 18.7 47.9 86.5
a Poor and near-poor = fi rst and second (two lowest) household quintiles.
b Based on the pre-2001 defi nition of unemployment, which excludes discouraged workers, those establishing a new business and those not yet started in a new job. c Underemployment refers to individuals working less than 35 hours per week, regardless of whether or not they were looking for more work. (Unlike the data for 2002 presented in earlier tables, part-time employees not searching for more work are included among the underemployed according to this defi nition, in both 1996 and 2002.)
Source: Susenas, 2002.
Labour market dimensions of poverty in Indonesia 257
were most heavily concentrated in agriculture and in the informal sector outside agriculture (data not shown in table 7), and this remained so in 2002. While the crisis was a major shock to Indonesian labour markets, by 2002 the relationship between the basic structural characteristics of the market and poverty appeared to have been restored. Raising earnings through increased labour productivity in agriculture, and opening up new employment opportunities in better jobs outside agriculture and the informal sector, remain the major labour market challenges in seeking to reduce levels of poverty.
CONCLUSIONS AND POLICY IMPLICATIONS
This paper has examined the relationship between the labour market characteris-tics of working-age people and the poverty status of the households to which they belong, focusing on data from the Susenas. It is set in the context of relatively slow growth in modern sector jobs since the economic crisis of 1997–98. We focused on three key issues raised in the literature. First, we investigated the extent to which low participation in the labour force—including both unemployment and under-employment—rather than the kinds of jobs undertaken was associated with the poverty status of individuals of working age. Second, we examined contrasts in the extent and patterns of participation of the poor in urban versus rural labour markets, both in agricultural and non-agricultural jobs. And third, we considered differences in labour market involvement and earnings between various demo-graphic groups among the poor compared with the non-poor, focusing in particu-lar on females, youth and prime-age males. All of these issues are relevant to the impact of broader development strategies on the welfare of the poor, and to the creation of better-targeted pro-poor programs.
On the fi rst issue, superfi cial inspection of the data suggests that
non-participa-tion or low participanon-participa-tion in the workforce is a less important correlate of poverty status than sector of employment, work status (i.e. attachment to the formal or informal sector) and associated earnings in the formal sector. However, multi-variate analysis using a logit model showed that participation in the workforce and unemployment of the household head tended to be associated with being poor or near-poor. Among the participation variables, the intensity of work (prox-ied by underemployment) appeared to be more directly related to poverty than participation rates or unemployment. In this respect Indonesia differed from sev-eral other developing countries, where the poor experience high unemployment rates in urban areas in particular, compared with the non-poor. Further, non-par-ticipation in the workforce and unemployment of the spouse of the household head were not found to be statistically signifi cant correlates of household poverty.
One possible interpretation is that spouses (mainly female) in better-off house-holds are not forced into less preferred jobs in order to make ends meet, unlike in poorer households.
With regard to the kind of work undertaken, individuals from poor house-holds were more likely to be found working in agriculture and the informal sec-tor. Although not examined in the multivariate analysis, low average earnings per hour appeared to be the major factor associated with poverty among wage workers (in addition to underemployment).
258 Armida S. Alisjahbana and Chris Manning
Turning to urban–rural differences, we found that employment in certain non-agricultural sectors, such as transport and construction, was much more likely to be associated with a higher incidence of poverty in urban than in rural areas. Many poor workers were engaged in the informal sector—in poorly remunerated and uncertain self-employed work, as family workers or as casual labourers. It is likely that many of these were rural–urban migrant workers who preferred the higher absolute incomes available to them in towns and cities, but who were poor compared with other urban residents. In rural areas, in contrast, the poor were not over-represented in most non-agricultural sectors, and were signifi cantly
under-represented in some, such as construction, trade and transport. They were, how-ever, much more heavily concentrated in agriculture among all work status groups in the informal sector: self-employed, family workers and casual labourers.
Finally, among population sub-groups, unemployed and underemployed younger household members, and underemployed females, were more heavily concentrated in poor households, especially in urban areas. Young people in poor households in particular showed a very low level of participation in non-agricultural work (outside construction). Differences in earnings between employ-ees in poor and non-poor households were especially large for employemploy-ees in rural households and for females.
We also looked briefl y at regional dimensions of the labour market in relation
to poverty status and changes in the labour market attributes of the poor over time. Across regions, the most obvious contrasts were between densely populated and more industrialised Java–Bali and all the major Outer Island groups. Among working-age people in poor households, unemployment, underemployment and participation in the agricultural sector and the informal sector were higher, and the earnings differential with the non-poor greater, on Java–Bali relative to other regions. However, we did not detect any major change in the structure of poverty in relation to labour market participation over the period spanning the economic crisis and recovery, 1996–2002.
What are the implications of these fi ndings for policy? First, the results suggest
that an expansion of formal sector jobs outside agriculture is likely to be of central importance in reducing poverty, given that employed individuals in poor house-holds are more likely to be employed in either agriculture or the informal sector. We did not examine the direction of causality—whether formal sector work con-tributed to a lower probability of being poor, for example, or alternatively whether individuals in non-poor households were more likely to gain access to formal sector jobs. Nevertheless, the data suggest that slow growth in formal sector jobs in recent years in Indonesia may well have been a major obstacle to reducing the incidence of poverty. If this is indeed the case, then the policy options for recti-fying this situation relate mainly to boosting the demand for labour by remov-ing the constraints to increased private investment and output growth, through improvements to governance and the legal environment, improved infrastructure and so on (World Bank 2006).
Second, while our fi ndings are tentative, this study suggests that interventions
that seek to increase the utilisation of underemployed labour—again, presum-ably, mainly by augmenting labour demand—are more important for poverty alleviation than those focusing on increasing the fl ow of labour market
informa-tion, or other policies intended to enhance labour mobility so as to ensure that