STATISTIK PERKEBUNAN INDONESIA 2012-2014
TREE CROP ESTATE STATISTICS OF INDONESIA 2012-2014
Naskah/Manuscript
Direktorat Jenderal Perkebunan,
Directorate General of Estate Crops
Kementerian Pertanian
Ministry of Agriculture
Penasehat/Advisor:
Ir. MukƟ Sarjono, M.Sc.
PenyunƟ ng/Senior Editors:
Ir. Bambang Sad Juga, M.Sc.
Lucky Lukmana Sukriya R. SE, M.Sc.
Staf PenyunƟ ng/Editorial Staff s:
Yanuar Arianto, STP
Widya Khonik Zuraina, S.Si
Eko Pudjianto, S.Kom
Asep Udin, S.Kom
Neny KurniawaƟ , S.Si
Susilo Novianto DamarjaƟ , A.Md.
Diterbitkan oleh/Published by
Direktorat Jenderal Perkebunan
Directorate General of Estate Crops
Jl. Harsono RM No. 3 Gedung C
Pasar Minggu - Jakarta 12550
Kotak Pos 1060/Jkt,10010
Tlp. : 021 - 7815380 - 4
K
ontribusi subsektor perkebunan terhadap perekonomian nasional
pada tahun 2012 mencapai US$ 35,64 milyar atau setara dengan Rp.
427,68 triliun (asumsi 1 US$ = Rp. 12.000,-) yang melipuƟ ekspor
US$ 24,814 milyar, cukai rokok sebesar US$ 7,918 milyar dan bea keluar
(BK) kelapa sawit dan kakao sebesar US$ 2,908 milyar. Peran perkebunan
tersebut cenderung mengalami peningkatan dari tahun ke tahun dalam
memperkokoh pembangunan nasional. Agar informasi perkebunan dapat
tersebar secara luas, seƟ ap tahun diterbitkan Buku StaƟ sƟ k Perkebunan
Indonesia yang menyajikan data secara handal, sahih, objekif, mutakhir
dan konsisten.
S
taƟ sƟ k Perkebunan Indonesia Tahun 2012-2014 menyajikan data
luas areal, produksi, produkƟ vitas baik secara nasional maupun provinsi menurut
bentuk/status pengusahaannya yaitu Perkebunan Rakyat, Perkebunan Besar Negara dan
Perkebunan Besar Swasta. Penyajian data juga dilengkapi dengan data ekspor dan impor untuk
masing-masing komoditas yang mencakup negara tujuan/asal, volume dan nilai, harga di dalam
dan luar negeri serta untuk beberapa komoditas tertentu disajikan data keseimbangan dunia.
D
ata yang disajikan merupakan hasil sinkronisasi dan validasi data staƟ sƟ k perkebunan
2012-2014 yang dilaksanakan secara berjenjang dari Ɵ ngkat kabupaten sampai Ɵ ngkat
nasional dengan mengacu pada Pedoman Pelaksanaan Pengelolaan Data Komoditas
Perkebunan yang diterbitkan Direktorat Jenderal Perkebunan. Data tersebut melipuƟ angka
tetap (ATAP) Tahun 2012, angka sementara (ASEM) Tahun 2013 dan angka prakiraan (AESTI)
Tahun 2014. Data yang disajikan bersumber dari data primer yang dikumpulkan dari dinas yang
membidangi perkebunan di provinsi dan data sekunder yang dikuƟ p dari data yang diterbitkan
oleh Badan Pusat StaƟ sƟ k (BPS), Kementerian Perindustrian, Kementerian Perdagangan, Bank
Indonesia, dan publikasi yang diterbitkan oleh asosiasi-asosiasi perkebunan baik dalam maupun
luar negeri.
B
uku ini dapat diterbitkan, atas dukungan dan kerjasama yang baik dari berbagai pihak.
Untuk itu, pada kesempatan ini, kami mengucapkan terima kasih atas dukungan dan
kerjasama tersebut. Kami menyadari bahwa buku yang diterbitkan ini masih jauh dari
sempurna. Untuk itu, kriƟ k dan saran yang sifatnya membangun sangat diharapkan sebagai
bahan masukan dalam perbaikan penerbitan di masa datang.
S
emoga apa yang disajikan dalam buku ini dapat digunakan oleh berbagai kalangan dan
para pengguna data serta dapat dijadikan acuan dalam pengambilan kebijakan.
t
t
er
er
ha
ha
da
da
p
p
pe
pe
re
re
ko
ko
no
no
mi
mi
an
an
n
n
as
as
io
io
na
na
l
l
35,64 milyar atau setara dengan Rp.
K
Kata
ata PPengantar
engantar
Jakarta, Desember 2013
DIREKTUR JENDERAL PERKEBUNAN
T
he contribu on of Estate Crops Sub Sector to the na onal economy
in 2012 was US $ 35,64 billion or equivalent to Rp. 427,68 trillion
(assumed 1 US $ = Rp. 12.000) which consisted of export value of
US$ 24,814 billion, cigare e and tobacco customs of US $ 7,918 billion and
palm oil and cocoa export taxes of US $ 2,908 billion. That role of the estate
crops tends to increase signifi cantly from year to year in strengthening
na onal development. Furthermore, to spread estate crops informa on
widely, the Estate Crop Sta s cs of Indonesia is published every year that
presented reliable, valid, objec ve, up to date and consistent data.
T
he Estate Crop Sta s cs of Indonesia 2012-2014 presents area, produc on and produc vity
data by province and district level of Smallhoder, government and private estates. It is
completed by volume, value of both export and import data, price data for domes c and
world market and also world balance data for some commodi es.
D
ata presented are the result of synchroniza on and valida on of the estate crop sta s cal
data 2012-2014 which are held hierarchical from the district to the na onal level by
using guidelines of data management of estate crop commodi es. In this edi on, data
of the 2012 are presented as fi xed data, data of the 2013 are the preliminary data and data of
the 2014 are the es ma on. The primary data were collected from the Estate Crops Province
Level and the secondary data were collected from related ins tu on such as Board of Central
Sta s cs, Ministry of Industry, Ministry of Trade, Central Bank of Indonesia, the publica on of
Estate Commodity Associa ons and others.
I
t would have been impossible to compile this book without substan al support and
contribu on from many ins tu ons. At this opportunity, we would like to thank all for their
support and coopera on. We realize that the publica on s ll needs further improvement.
We would greatly appreciate comments and sugges ons for future improvement.
H
opefully this publica on will have high values for users and references for policy
makers.
o
o
no
no
my
my
trillion
P
Preface
reface
Jakarta, December 2013
DIRECTOR GENERAL OF ESTATE CROPS
Kata Pengantar
Preface
...
iii
DaŌ ar Isi
Contents
... v
DaŌ ar Gambar
List of Figures...
vi
DaŌ ar Tabel
List of Tables ...
vii
DDaftar
aftar
IIsi
si
CContents
ontents
D
Daftar
aftar
GGambar
ambar
LList of
ist of FFigures
igures
Gambar 1. Perbandingan Luas Areal dan Produksi Jambu Mete
Menurut Status Pengusahaan Tahun 2012
Figure
Area and Produc on Comparison Graph of Cashew Nut by
Farming Category, 2012 ...
1
Gambar 2. Perkembangan Luas Areal, Produksi, ProdukƟ vitas dan
Volume Ekspor-Impor Jambu Mete Tahun 2008 - 2012
Figure Area,
Produc on, Produc vity and Export-Import Volume
Tabel 1.
Luas Areal dan Produksi Jambu Mete Menurut Status Pengusahaan
Tahun
1975-2014
Table
Area and Cashew Nut Produc on by Farming Category, 1975 – 2014 .
3
Tabel 2.
Volume dan Nilai Ekspor – Impor Jambu Mete Tahun 1975 - 2012
Table
Export - Import Volume and Value of Cashew Nut, 1975 - 2012 ...
4
Tabel 3.
Luas Areal dan Produksi Jambu Mete Menurut Provinsi dan
Status Pengusahaan Tahun 2012
Table
Area and Cashew Nut Produc on by Province and Farming
Category,
2012
...
5
Tabel 4.
Luas Areal dan Produksi Jambu Mete Menurut Provinsi dan
Status Pengusahaan Tahun 2013 *)
Table
Area and Cashew Nut Produc on by Province and Farming
Category, 2013 *) ...
6
Tabel 5.
Luas Areal dan Produksi Jambu Mete Menurut Provinsi dan
Status Pengusahaan Tahun 2014 **)
Table
Area and Cashew Nut Produc on by Province and Farming
Category, 2014 **) ...
7
Tabel 6.
Luas Tanaman Menghasilkan dan Produksi Jambu Mete
Menurut Provinsi dan Status Pengusahaan Tahun 2012
Table
Mature Area and Cashew Nut Produc on by Province and
Farming Category, 2012 ...
8
Tabel 7.
Luas Tanaman Menghasilkan dan Produksi Jambu Mete
Menurut Provinsi dan Status Pengusahaan Tahun 2013 *)
Table
Mature Area and Cashew Nut Produc on by Province and
Farming Category, 2013 *) ...
9
Tabel 8.
Luas Tanaman Menghasilkan dan Produksi Jambu Mete
Menurut Provinsi dan Status Pengusahaan Tahun 2014 **)
Table
Mature Area and Cashew Nut Produc on by Province and
Farming Category, 2014 **) ...
10
Tabel 9.
Luas Areal dan Produksi Jambu Mete Perkebunan Rakyat,
Besar Negara dan Besar Swasta (PR + PBN + PBS)
Menurut Provinsi dan Keadaan Tanaman Tahun 2012
Table
Area and Cashew Nut Produc on of Smallholder, Government and
Private Estate by Province and Tree Crop Classifi ca on, 2012 ...
11
Tabel 10.
Luas Areal dan Produksi Jambu Mete Perkebunan Rakyat,
Besar Negara dan Besar Swasta (PR + PBN + PBS)
Menurut Provinsi dan Keadaan Tanaman Tahun 2013 *)
Table
Area and Cashew Nut Produc on of Smallholder, Government and
Private Estate by Province and Tree Crop Classifi ca on, 2013 *) ...
12
Mete M
enur
ut Statu
s
Pe
ngus
ahaan
h
D
Daftar
aftar
TTabel
abel
Tabel 11.
Luas Areal dan Produksi Jambu Mete Perkebunan Rakyat,
Besar Negara dan Besar Swasta (PR + PBN + PBS)
Menurut Provinsi dan Keadaan Tanaman Tahun 2014 **)
Table
Area and Cashew Nut Produc on of Smallholder, Government and
Private Estate by Province and Tree Crop Classifi ca on, 2014 **) ...
13
Tabel 12.
Luas Areal dan Produksi Jambu Mete Perkebunan Rakyat
Menurut Provinsi dan Keadaan Tanaman Tahun 2012
Table
Area and Cashew Nut Produc on of Smallholder by Province and
Tree Crop Classifi ca on, 2012 ...
14
Tabel 13.
Luas Areal dan Produksi Jambu Mete Perkebunan Rakyat
Menurut Kabupaten dan Keadaan Tanaman Tahun 2012
Table
Area and Cashew Nut Produc on of Smallholder by District and
Tree Crop Classifi ca on, 2012 ...
15
Tabel 14.
Luas Areal dan Produksi Jambu Mete Perkebunan Rakyat
Menurut Provinsi dan Keadaan Tanaman Tahun 2013 *)
Table
Area and Cashew Nut Produc on of Smallholder by Province and
Tree Crop Classifi ca on, 2013 *) ...
23
Tabel 15.
Luas Areal dan Produksi Jambu Mete Perkebunan Rakyat
Menurut Provinsi dan Keadaan Tanaman Tahun 2014 **)
Table
Area and Cashew Nut Produc on of Smallholder by Province and
Tree Crop Classifi ca on, 2014 **) ...
24
Tabel 16.
Luas Areal dan Produksi Jambu Mete Perkebunan Besar Swasta
Menurut Provinsi dan Keadaan Tanaman Tahun 2012
Table
Area and Cashew Nut Produc on of Private Estate by Province and
Tree Crop Classifi ca on, 2012 ...
25
Tabel 17.
Luas Areal dan Produksi Jambu Mete Perkebunan Besar Swasta
Menurut Kabupaten dan Keadaan Tanaman Tahun 2012
Table
Area and Cashew Nut Produc on of Private Estate by District and
Tree Crop Classifi ca on, 2012 ...
26
Tabel 18.
Luas Areal dan Produksi Jambu Mete Perkebunan Besar Swasta
Menurut Provinsi dan Keadaan Tanaman Tahun 2013*)
Table
Area and Cashew Nut Produc on of Private Estate by Province and
Tree Crop Classifi ca on, 2013*) ...
27
Tabel 19.
Luas Areal dan Produksi Jambu Mete Perkebunan Besar Swasta
Menurut Provinsi dan Keadaan Tanaman Tahun 2014 **)
Table
Area and Cashew Nut Produc on of Private Estate by Province and
Tree Crop Classifi ca on, 2014 **) ...
28
Tabel 20.
Volume dan Nilai Ekspor-Impor Jambu Mete
Menurut Negara Tujuan dan Asal Tahun 2012
Table
Export-Import Volume and Value of Cashew Nut by Des na on and
Origin Country, 2012 ...
29
Tabel 21.
Perkembangan Harga Rata-rata Tahunan Jambu Mete
Gambar 1.
Perbandingan Luas Areal dan Produksi Jambu Mete Menurut Status Pengusahaan
Tahun 2012
Gambar 2. Perkembangan Luas Areal, Produksi, ProdukƟ vitas dan Volume Ekspor-Impor
Jambu Mete Tahun 2008 - 2012
Figure Area,
ProducƟ on, ProducƟ vity and Export-Import Volume Trend Graph of
Cashew Nut, 2008 - 2012
Tabel 1.
Luas Areal dan Produksi Jambu Mete Menurut Status Pengusahaan Tahun 1975-2014
Table
Area and Cashew Nut ProducƟ on by Farming Category, 1975 – 2014
Tahun/
Year
Luas Areal/Area (Ha)
Jumlah/
Total
Produksi/ProducƟ on (Ton)
Jumlah/
Total
PR/
Smallholder
PBN/
Government
PBS/
Private
Smallholder
PR/
PBN/
Government
PBS/
Private
1975
1976
1977
1978
1979
1980
1981
1982
1983
1984
1985
1986
1987
1988
1989
1990
1991
1992
1993
1994
1995
1996
1997
1998
1999
2000
2001
2002
2003
2004
2005
2006
2007
2008
2009
2010
2011
2012
2013*)
2014**)
56.643
68.504
71.238
81.878
85.478
114.934
136.631
185.192
187.535
195.789
197.563
223.270
213.045
252.245
268.222
273.293
352.735
374.605
394.522
409.755
455.920
484.357
490.074
521.695
547.724
551.442
558.784
568.796
565.446
559.633
572.959
568.944
570.156
572.727
571.850
569.910
574.821
574.900
575.162
576.151
1.696
8.798
687
570
628
679
637
1.152
4.630
-
-
-
-
-
-
-
-
-
-
-
-
-
-
-
-
-
-
-
-
-
-
-
-
-
-
-
-
-
-
-
52
52
-
63
1.435
1.195
1.195
1.198
1.398
715
115
1.145
1.201
1.532
1.416
1.928
2.138
3.684
6.071
8.870
8.904
8.593
9.205
9.295
9.858
9.868
1.028
1.128
7.835
6.676
6.691
253
253
994
1.020
1.020
1.020
1.020
1.019
1.017
58.391
77.354
71.925
82.511
87.541
116.808
138.463
187.542
193.563
196.504
197.678
224.415
214.246
253.777
269.638
275.221
354.873
378.289
400.593
418.625
464.824
492.950
499.279
530.990
557.582
561.310
559.812
569.924
573.281
566.309
579.650
569.197
570.409
573.721
572.870
570.930
575.841
575.920
576.181
577.168
9.109
7.101
7.360
8.795
9.762
9.070
11.441
16.830
18.040
19.395
21.091
22.454
23.975
23.231
27.912
29.825
57.175
62.121
69.671
71.953
85.616
67.079
73.158
86.924
89.530
69.488
91.220
109.945
106.698
130.768
134.808
149.015
146.025
156.435
147.273
115.019
114.615
116.737
117.363
117.999
14
5
10
5
2
4
3
-
1
-
-
-
-
-
-
-
-
-
-
-
-
-
-
-
-
-
-
-
-
-
-
-
-
-
-
-
-
-
-
-
-
70
-
-
-
-
-
-
6
16
23
61
67
74
78
82
72
96
80
124
379
597
574
772
774
439
366
287
234
252
262
123
123
217
130
130
174
178
174
174
9.123
7.176
7.370
8.800
9.764
9.074
11.444
16.830
18.047
19.411
21.114
22.515
24.042
23.305
27.990
29.907
57.247
62.217
69.751
72.077
85.995
67.676
73.732
87.696
90.304
69.927
91.586
110.232
106.932
131.020
135.070
149.138
146.148
156.652
147.403
115.149
114.789
116.915
117.537
118.174
DIREKTORAT JENDERAL PERKEBUNAN
Directorate General of Estate Crops
Keterangan/Note :
1. Angka Sementara/Preliminary*)
2. Angka EsƟ masi/Es ma on**)
3. Wujud Produksi/Produc on : Gelondong Kering/Dried Cashew Nut
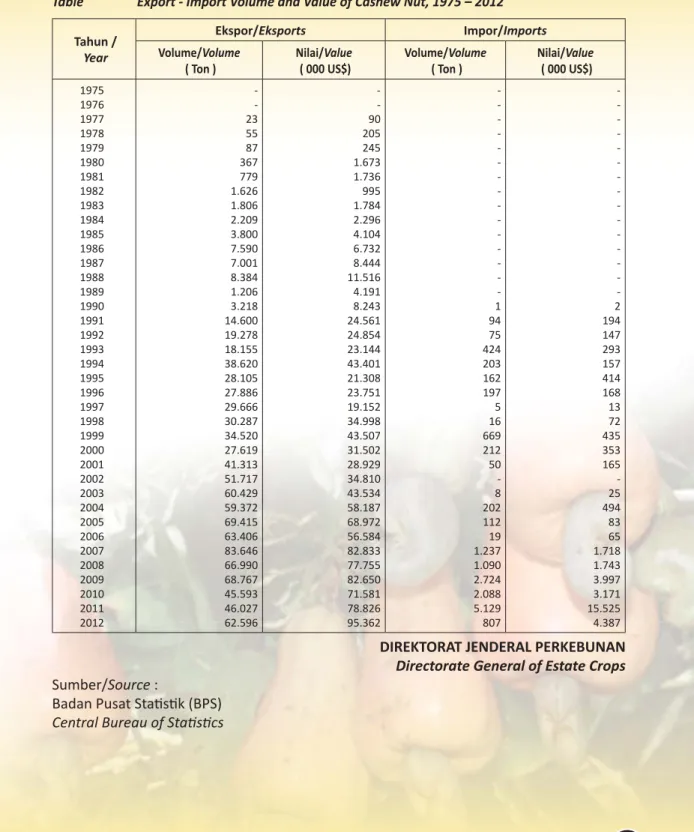
Tabel 2.
Volume dan Nilai Ekspor – Impor Jambu Mete Tahun 1975 - 2012
Table
Export - Import Volume and Value of Cashew Nut, 1975 – 2012
Tahun /
Year
Ekspor/Eksports
Impor/Imports
Volume/Volume
( Ton )
Nilai/Value
( 000 US$)
Volume/Volume
( Ton )
Nilai/Value
( 000 US$)
1975
1976
1977
1978
1979
1980
1981
1982
1983
1984
1985
1986
1987
1988
1989
1990
1991
1992
1993
1994
1995
1996
1997
1998
1999
2000
2001
2002
2003
2004
2005
2006
2007
2008
2009
2010
2011
2012
-
-
23
55
87
367
779
1.626
1.806
2.209
3.800
7.590
7.001
8.384
1.206
3.218
14.600
19.278
18.155
38.620
28.105
27.886
29.666
30.287
34.520
27.619
41.313
51.717
60.429
59.372
69.415
63.406
83.646
66.990
68.767
45.593
46.027
62.596
-
-
90
205
245
1.673
1.736
995
1.784
2.296
4.104
6.732
8.444
11.516
4.191
8.243
24.561
24.854
23.144
43.401
21.308
23.751
19.152
34.998
43.507
31.502
28.929
34.810
43.534
58.187
68.972
56.584
82.833
77.755
82.650
71.581
78.826
95.362
-
-
-
-
-
-
-
-
-
-
-
-
-
-
-
1
94
75
424
203
162
197
5
16
669
212
50
-
8
202
112
19
1.237
1.090
2.724
2.088
5.129
807
-
-
-
-
-
-
-
-
-
-
-
-
-
-
-
2
194
147
293
157
414
168
13
72
435
353
165
-
25
494
83
65
1.718
1.743
3.997
3.171
15.525
4.387
DIREKTORAT JENDERAL PERKEBUNAN
Directorate General of Estate Crops
Sumber/Source :
Badan Pusat StaƟ sƟ k (BPS)
Tabel 3.
Luas Areal dan Produksi Jambu Mete Menurut Provinsi dan Status Pengusahaan
Tahun 2012
Table
Area and Cashew Nut ProducƟ on by Province and Farming Category, 2012
No.
Provinsi/Province
Perkebunan Rakyat
Smallholder
Perkebunan Negara
Government
Perkebunan Swasta
Private
Jumlah/Total
Luas/
Area
(Ha)
Produksi
ProducƟ on
(Ton)
Luas/
Area
(Ha)
Produksi
ProducƟ on
(Ton)
Luas/
Area
(Ha)
Produksi
ProducƟ on
(Ton)
Luas/
Area
(Ha)
Produksi
ProducƟ on
(Ton)
1. 2. 3. 4. 5. 6. 7. 8. 9. 10. ACEH SUMATERA UTARA SUMATERA BARAT R I A U KEPULAUAN RIAU J A M B I SUMATERA SELATAN KEP. BANGKA BELITUNG BENGKULU LAMPUNG 106 17 - - 30 - - 62 - 73 1 2 - - 4 - - 4 - 13 - - - - - - - - - - - - - - - - - - - - - - - - - - - - - - - - - - - - - - - - 106 17 - - 30 - - 62 - 73 1 2 - - 4 - - 4 - 13 WILAYAH SUMATERA 288 23 - - - - 288 23 11. 12. 13. 14. 15. 16. DKI. JAKARTA JAWA BARAT BANTEN JAWA TENGAH D.I. YOGYAKARTA JAWA TIMUR - 239 12 25.404 15.556 52.903 - 56 3 8.537 369 12.599 - - - - - - - - - - - - - - - - - - - - - - - 239 12 25.404 15.556 52.903 - 56 3 8.537 369 12.599 WILAYAH JAWA 94.114 21.564 - - - - 94.114 21.564 17. 18. 19. B A L INUSA TENGGARA BARAT NUSA TENGGARA TIMUR
12.443 66.966 180.325 3.672 13.014 38.878 - - - - - - 171 - 75 102 - 35 12.614 66.966 180.400 3.774 13.014 38.913
WILAYAH NUSA TENGGARA & BALI 259.734 55.564 - - 246 137 259.980 55.701
20. 21. 22. 23. KALIMANTAN BARAT KALIMANTAN TENGAH KALIMANTAN SELATAN KALIMANTAN TIMUR - 1.210 92 54 - 62 43 14 - - - - - - - - - - - - - - - - - 1.210 92 54 - 62 43 14 WILAYAH KALIMANTAN 1.356 119 - - - - 1.356 119 24. 25. 26. 27. 28. 29. SULAWESI UTARA GORONTALO SULAWESI TENGAH SULAWESI SELATAN SULAWESI BARAT SULAWESI TENGGARA 348 2.954 17.075 59.829 1.076 117.993 55 540 3.115 17.161 205 14.372 - - - - - - - - - - - - 8 - - 767 - - 2 - - 39 - - 355 2.954 17.075 60.596 1.076 117.993 56 540 3.115 17.200 205 14.372 WILAYAH SULAWESI 199.275 35.448 - - 774 41 200.049 35.489 30. 31. 32. 33. M A L U K U MALUKU UTARA PAPUA PAPUA BARAT 8.916 5.969 4.845 404 1.915 1.476 582 46 - - - - - - - - - - - - - - - - 8.916 5.969 4.845 404 1.915 1.476 582 46
WILAYAH MALUKU & PAPUA 20.134 4.019 - - - - 20.134 4.019
I N D O N E S I A 574.900 116.737 - - 1.020 178 575.920 116.915
DIREKTORAT JENDERAL PERKEBUNAN
Directorate General of Estate Crops
Keterangan/Note :
1. Angka Tetap/Fixed
Tabel 4.
Luas Areal dan Produksi Jambu Mete Menurut Provinsi dan Status Pengusahaan
Tahun 2013 *)
Table
Area and Cashew Nut ProducƟ on by Province and Farming Category, 2013 *)
No.
Provinsi/Province
Perkebunan Rakyat
Smallholder
Perkebunan Negara
Government
Perkebunan Swasta
Private
Jumlah/Total
Luas/
Area
(Ha)
Produksi
ProducƟ on
(Ton)
Luas/
Area
(Ha)
Produksi
ProducƟ on
(Ton)
Luas/
Area
(Ha)
Produksi
ProducƟ on
(Ton)
Luas/
Area
(Ha)
Produksi
ProducƟ on
(Ton)
1. 2. 3. 4. 5. 6. 7. 8. 9. 10. ACEH SUMATERA UTARA SUMATERA BARAT R I A U KEPULAUAN RIAU J A M B I SUMATERA SELATAN KEP. BANGKA BELITUNG BENGKULU LAMPUNG 106 17 - - 30 - - 62 - 73 1 2 - - 4 - - 4 - 13 - - - - - - - - - - - - - - - - - - - - - - - - - - - - - - - - - - - - - - - - 106 17 - - 30 - - 62 - 73 1 2 - - 4 - - 4 - 13 WILAYAH SUMATERA 288 23 - - - - 288 23 11. 12. 13. 14. 15. 16. DKI. JAKARTA JAWA BARAT BANTEN JAWA TENGAH D.I. YOGYAKARTA JAWA TIMUR - 239 12 25.410 15.572 52.933 - 57 3 8.581 371 12.672 - - - - - - - - - - - - - - - - - - - - - - - 239 12 25.410 15.572 52.933 - 57 3 8.581 371 12.672 WILAYAH JAWA 94.167 21.684 - - - - 94.167 21.684 17. 18. 19. B A L INUSA TENGGARA BARAT NUSA TENGGARA TIMUR
12.449 66.995 180.447 3.691 13.084 39.096 - - - - - - 171 - 75 102 - 35 12.620 66.995 180.522 3.793 13.084 39.131
WILAYAH NUSA TENGGARA & BALI 259.891 55.871 - - 245 137 260.137 56.008
20. 21. 22. 23. KALIMANTAN BARAT KALIMANTAN TENGAH KALIMANTAN SELATAN KALIMANTAN TIMUR - 1.214 92 54 - 62 43 15 - - - - - - - - - - - - - - - - - 1.214 92 54 - 62 43 15 WILAYAH KALIMANTAN 1.360 120 - - - - 1.360 120 24. 25. 26. 27. 28. 29. SULAWESI UTARA GORONTALO SULAWESI TENGAH SULAWESI SELATAN SULAWESI BARAT SULAWESI TENGGARA 349 2.956 17.085 59.831 1.077 118.015 56 543 3.132 17.249 206 14.445 - - - - - - - - - - - - 8 - - 766 - - 1 - - 36 - - 356 2.956 17.085 60.597 1.077 118.015 57 543 3.132 17.285 206 14.445 WILAYAH SULAWESI 199.313 35.630 - - 774 37 200.086 35.667 30. 31. 32. 33. M A L U K U MALUKU UTARA PAPUA PAPUA BARAT 8.919 5.972 4.848 404 1.919 1.484 585 46 - - - - - - - - - - - - - - - - 8.919 5.972 4.848 404 1.919 1.484 585 46
WILAYAH MALUKU & PAPUA 20.143 4.034 - - - - 20.143 4.034
I N D O N E S I A 575.162 117.363 - - 1.019 174 576.181 117.537
DIREKTORAT JENDERAL PERKEBUNAN
Directorate General of Estate Crops
Tabel 5.
Luas Areal dan Produksi Jambu Mete Menurut Provinsi dan Status Pengusahaan
Tahun 2014 **)
Table
Area and Cashew Nut ProducƟ on by Province and Farming Category, 2014 **)
No.
Provinsi/Province
Perkebunan Rakyat
Smallholder
Perkebunan Negara
Government
Perkebunan Swasta
Private
Jumlah/Total
Luas/
Area
(Ha)
Produksi
ProducƟ on
(Ton)
Luas/
Area
(Ha)
Produksi
ProducƟ on
(Ton)
Luas/
Area
(Ha)
Produksi
ProducƟ on
(Ton)
Luas/
Area
(Ha)
Produksi
ProducƟ on
(Ton)
1. 2. 3. 4. 5. 6. 7. 8. 9. 10. ACEH SUMATERA UTARA SUMATERA BARAT R I A U KEPULAUAN RIAU J A M B I SUMATERA SELATAN KEP. BANGKA BELITUNG BENGKULU LAMPUNG 106 17 - - 30 - - 62 - 73 1 2 - - 4 - - 4 - 13 - - - - - - - - - - - - - - - - - - - - - - - - - - - - - - - - - - - - - - - - 106 17 - - 30 - - 62 - 73 1 2 - - 4 - - 4 - 13 WILAYAH SUMATERA 288 23 - - - - 288 23 11. 12. 13. 14. 15. 16. DKI. JAKARTA JAWA BARAT BANTEN JAWA TENGAH D.I. YOGYAKARTA JAWA TIMUR - 239 12 25.421 15.644 53.074 - 57 3 8.625 374 12.746 - - - - - - - - - - - - - - - - - - - - - - - 239 12 25.421 15.644 53.074 - 57 3 8.625 374 12.746 WILAYAH JAWA 94.390 21.805 - - - - 94.390 21.805 17. 18. 19. B A L INUSA TENGGARA BARAT NUSA TENGGARA TIMUR
12.484 67.143 180.913 3.711 13.154 39.315 - - - - - - 171 - 75 102 - 35 12.656 67.143 180.988 3.813 13.154 39.350
WILAYAH NUSA TENGGARA & BALI 260.540 56.180 - - 246 137 260.786 56.317
20. 21. 22. 23. KALIMANTAN BARAT KALIMANTAN TENGAH KALIMANTAN SELATAN KALIMANTAN TIMUR - 1.218 92 54 - 63 44 16 - - - - - - - - - - - - - - - - - 1.218 92 54 - 63 44 16 WILAYAH KALIMANTAN 1.364 122 - - - - 1.364 122 24. 25. 26. 27. 28. 29. SULAWESI UTARA GORONTALO SULAWESI TENGAH SULAWESI SELATAN SULAWESI BARAT SULAWESI TENGGARA 349 2.960 17.115 59.835 1.081 118.057 57 546 3.149 17.337 208 14.518 - - - - - - - - - - - - 8 - - 763 - - 1 - - 36 - - 357 2.960 17.115 60.598 1.081 118.057 58 546 3.149 17.373 208 14.518 WILAYAH SULAWESI 199.397 35.814 - - 771 37 200.169 35.851 30. 31. 32. 33. M A L U K U MALUKU UTARA PAPUA PAPUA BARAT 8.932 5.981 4.853 405 1.929 1.492 588 46 - - - - - - - - - - - - - - - - 8.932 5.981 4.853 405 1.929 1.492 588 46
WILAYAH MALUKU & PAPUA 20.171 4.056 - - - - 20.171 4.056
I N D O N E S I A 576.151 117.999 - - 1.017 174 577.168 118.174
DIREKTORAT JENDERAL PERKEBUNAN
Directorate General of Estate Crops
Keterangan/Note :
1. Angka EsƟ masi/Es ma on**)
Tabel 6.
Luas Tanaman Menghasilkan dan Produksi Jambu Mete Menurut Provinsi dan
Status Pengusahaan Tahun 2012
Table
Mature Area and Cashew Nut ProducƟ on by Province and Farming Category, 2012
No.
Provinsi/Province
Perkebunan Rakyat
Smallholder
Perkebunan Negara
Government
Perkebunan Swasta
Private
Jumlah/Total
Luas TM/
Mature
(Ha)
Produksi
ProducƟ on
(Ton)
Luas TM/
Mature
(Ha)
Produksi
ProducƟ on
(Ton)
Luas TM/
Mature
(Ha)
Produksi
ProducƟ on
(Ton)
Luas TM/
Mature
(Ha)
Produksi
ProducƟ on
(Ton)
1. 2. 3. 4. 5. 6. 7. 8. 9. 10. ACEH SUMATERA UTARA SUMATERA BARAT R I A U KEPULAUAN RIAU J A M B I SUMATERA SELATAN KEP. BANGKA BELITUNG BENGKULU LAMPUNG 7 2 - - 7 - - 21 - 47 1 2 - - 4 - - 4 - 13 - - - - - - - - - - - - - - - - - - - - - - - - - - - - - - - - - - - - - - - - 7 2 - - 7 - - 21 - 47 1 2 - - 4 - - 4 - 13 WILAYAH SUMATERA 84 23 - - - - 84 23 11. 12. 13. 14. 15. 16. DKI. JAKARTA JAWA BARAT BANTEN JAWA TENGAH D.I. YOGYAKARTA JAWA TIMUR - 130 8 16.526 4.570 17.963 - 56 3 8.537 369 12.599 - - - - - - - - - - - - - - - - - - - - - - - 130 8 16.526 4.570 17.963 - 56 3 8.537 369 12.599 WILAYAH JAWA 39.197 21.564 - - - - 39.197 21.564 17. 18. 19. B A L INUSA TENGGARA BARAT NUSA TENGGARA TIMUR
8.208 35.972 79.520 3.672 13.014 38.878 - - - - - - 161 - 74 102 - 35 8.369 35.972 79.594 3.774 13.014 38.913
WILAYAH NUSA TENGGARA & BALI 123.700 55.564 - - 235 137 123.935 55.701
20. 21. 22. 23. KALIMANTAN BARAT KALIMANTAN TENGAH KALIMANTAN SELATAN KALIMANTAN TIMUR - 147 76 39 - 62 43 14 - - - - - - - - - - - - - - - - - 147 76 39 - 62 43 14 WILAYAH KALIMANTAN 262 119 - - - - 262 119 24. 25. 26. 27. 28. 29. SULAWESI UTARA GORONTALO SULAWESI TENGAH SULAWESI SELATAN SULAWESI BARAT SULAWESI TENGGARA 235 1.783 8.827 45.027 638 87.276 55 540 3.115 17.161 205 14.372 - - - - - - - - - - - - 4 - - 254 - - 2 - - 39 - - 239 1.783 8.827 45.281 638 87.276 56 540 3.115 17.200 205 14.372 WILAYAH SULAWESI 143.786 35.448 - - 258 41 144.043 35.489 30. 31. 32. 33. M A L U K U MALUKU UTARA PAPUA PAPUA BARAT 6.565 4.381 2.810 237 1.915 1.476 582 46 - - - - - - - - - - - - - - - - 6.565 4.381 2.810 237 1.915 1.476 582 46
WILAYAH MALUKU & PAPUA 13.993 4.019 - - - - 13.993 4.019
I N D O N E S I A 321.022 116.737 - - 492 178 321.515 116.915
DIREKTORAT JENDERAL PERKEBUNAN
Directorate General of Estate Crops
Tabel 7.
Luas Tanaman Menghasilkan dan Produksi Jambu Mete Menurut Provinsi dan
Status Pengusahaan Tahun 2013 *)
Table
Mature Area and Cashew Nut ProducƟ on by Province and Farming Category, 2013 *)
No.
Provinsi/Province
Perkebunan Rakyat
Smallholder
Perkebunan Negara
Government
Perkebunan Swasta
Private
Jumlah/Total
Luas TM/
Mature
(Ha)
Produksi
ProducƟ on
(Ton)
Luas TM/
Mature
(Ha)
Produksi
ProducƟ on
(Ton)
Luas TM/
Mature
(Ha)
Produksi
ProducƟ on
(Ton)
Luas TM/
Mature
(Ha)
Produksi
ProducƟ on
(Ton)
1. 2. 3. 4. 5. 6. 7. 8. 9. 10. ACEH SUMATERA UTARA SUMATERA BARAT R I A U KEPULAUAN RIAU J A M B I SUMATERA SELATAN KEP. BANGKA BELITUNG BENGKULU LAMPUNG 7 2 - - 7 - - 21 - 47 1 2 - - 4 - - 4 - 13 - - - - - - - - - - - - - - - - - - - - - - - - - - - - - - - - - - - - - - - - 7 2 - - 7 - - 21 - 47 1 2 - - 4 - - 4 - 13 WILAYAH SUMATERA 84 23 - - - - 84 23 11. 12. 13. 14. 15. 16. DKI. JAKARTA JAWA BARAT BANTEN JAWA TENGAH D.I. YOGYAKARTA JAWA TIMUR - 130 8 16.530 4.579 17.988 - 57 3 8.581 371 12.672 - - - - - - - - - - - - - - - - - - - - - - - 130 8 16.530 4.579 17.988 - 57 3 8.581 371 12.672 WILAYAH JAWA 39.235 21.684 - - - - 39.235 21.684 17. 18. 19. B A L INUSA TENGGARA BARAT NUSA TENGGARA TIMUR
8.212 35.992 79.601 3.691 13.084 39.096 - - - - - - 161 - 74 102 - 35 8.372 35.992 79.675 3.793 13.084 39.131
WILAYAH NUSA TENGGARA & BALI 123.805 55.871 - - 235 137 124.039 56.008
20. 21. 22. 23. KALIMANTAN BARAT KALIMANTAN TENGAH KALIMANTAN SELATAN KALIMANTAN TIMUR - 148 76 39 - 62 43 15 - - - - - - - - - - - - - - - - - 148 76 39 - 62 43 15 WILAYAH KALIMANTAN 263 120 - - - - 263 120 24. 25. 26. 27. 28. 29. SULAWESI UTARA GORONTALO SULAWESI TENGAH SULAWESI SELATAN SULAWESI BARAT SULAWESI TENGGARA 236 1.784 8.832 45.035 639 87.286 56 543 3.132 17.249 206 14.445 - - - - - - - - - - - - 4 - - 253 - - 1 - - 36 - - 240 1.784 8.832 45.289 639 87.286 57 543 3.132 17.285 206 14.445 WILAYAH SULAWESI 143.812 35.630 - - 257 37 144.069 35.667 30. 31. 32. 33. M A L U K U MALUKU UTARA PAPUA PAPUA BARAT 6.567 4.383 2.811 237 1.919 1.484 585 46 - - - - - - - - - - - - - - - - 6.567 4.383 2.811 237 1.919 1.484 585 46
WILAYAH MALUKU & PAPUA 13.998 4.034 - - - - 13.998 4.034
I N D O N E S I A 321.196 117.363 - - 492 174 321.688 117.537
DIREKTORAT JENDERAL PERKEBUNAN
Directorate General of Estate Crops
Keterangan/Note :
1. Angka Sementara/Preliminary*)
Tabel 8.
Luas Tanaman Menghasilkan dan Produksi Jambu Mete Menurut Provinsi dan
Status Pengusahaan Tahun 2014 **)
Table
Mature Area and Cashew Nut ProducƟ on by Province and Farming Category, 2014 **)
No.
Provinsi/Province
Perkebunan Rakyat
Smallholder
Perkebunan Negara
Government
Perkebunan Swasta
Private
Jumlah/Total
Luas TM/
Mature
(Ha)
Produksi
ProducƟ on
(Ton)
Luas TM/
Mature
(Ha)
Produksi
ProducƟ on
(Ton)
Luas TM/
Mature
(Ha)
Produksi
ProducƟ on
(Ton)
Luas TM/
Mature
(Ha)
Produksi
ProducƟ on
(Ton)
1. 2. 3. 4. 5. 6. 7. 8. 9. 10. ACEH SUMATERA UTARA SUMATERA BARAT R I A U KEPULAUAN RIAU J A M B I SUMATERA SELATAN KEP. BANGKA BELITUNG BENGKULU LAMPUNG 7 2 - - 7 - - 21 - 47 1 2 - - 4 - - 4 - 13 - - - - - - - - - - - - - - - - - - - - - - - - - - - - - - - - - - - - - - - - 7 2 - - 7 - - 21 - 47 1 2 - - 4 - - 4 - 13 WILAYAH SUMATERA 84 23 - - - - 84 23 11. 12. 13. 14. 15. 16. DKI. JAKARTA JAWA BARAT BANTEN JAWA TENGAH D.I. YOGYAKARTA JAWA TIMUR - 130 8 16.534 4.597 18.013 - 57 3 8.625 374 12.746 - - - - - - - - - - - - - - - - - - - - - - - 130 8 16.534 4.597 18.013 - 57 3 8.625 374 12.746 WILAYAH JAWA 39.282 21.805 - - - - 39.282 21.805 17. 18. 19. B A L INUSA TENGGARA BARAT NUSA TENGGARA TIMUR
8.215 36.012 79.682 3.711 13.154 39.315 - - - - - - 163 - 74 102 - 35 8.378 36.012 79.756 3.813 13.154 39.350
WILAYAH NUSA TENGGARA & BALI 123.909 56.180 - - 237 137 124.146 56.317
20. 21. 22. 23. KALIMANTAN BARAT KALIMANTAN TENGAH KALIMANTAN SELATAN KALIMANTAN TIMUR - 148 76 39 - 63 44 16 - - - - - - - - - - - - - - - - - 148 76 39 - 63 44 16 WILAYAH KALIMANTAN 263 122 - - - - 263 122 24. 25. 26. 27. 28. 29. SULAWESI UTARA GORONTALO SULAWESI TENGAH SULAWESI SELATAN SULAWESI BARAT SULAWESI TENGGARA 236 1.785 8.836 45.045 641 87.297 57 546 3.149 17.337 208 14.518 - - - - - - - - - - - - 6 - - 253 - - 1 - - 36 - - 242 1.785 8.836 45.298 641 87.297 58 546 3.149 17.373 208 14.518 WILAYAH SULAWESI 143.840 35.814 - - 259 37 144.099 35.851 30. 31. 32. 33. M A L U K U MALUKU UTARA PAPUA PAPUA BARAT 6.571 4.384 2.813 237 1.929 1.492 588 46 - - - - - - - - - - - - - - - - 6.571 4.384 2.813 237 1.929 1.492 588 46
WILAYAH MALUKU & PAPUA 14.005 4.056 - - - - 14.005 4.056
I N D O N E S I A 321.384 117.999 - - 496 174 321.880 118.174
DIREKTORAT JENDERAL PERKEBUNAN
Directorate General of Estate Crops
Tabel 9.
Luas Areal dan Produksi Jambu Mete Perkebunan Rakyat, Besar Negara dan Besar
Swasta (PR + PBN + PBS) Menurut Provinsi dan Keadaan Tanaman Tahun 2012
Table
Area and Cashew Nut ProducƟ on of Smallholder, Government and Private
Estate by Province and Tree Crop Classifi caƟ on, 2012
No.
Provinsi/Province
Luas Areal/Area (Ha)
Produksi
ProducƟ on
(Ton)
ProdukƟ vitas/
ProducƟ vity
(Kg/Ha)
Jumlah
Petani/
Farmers
(KK)
Jumlah
Penyerapan
Tenaga Kerja
(TK)
TBM/
Immature
TM/
Mature
TTM/TR/
Damaged
Jumlah/
Total
1. 2. 3. 4. 5. 6. 7. 8. 9. 10. ACEH SUMATERA UTARA SUMATERA BARAT R I A U KEPULAUAN RIAU J A M B I SUMATERA SELATAN KEP. BANGKA BELITUNG BENGKULU LAMPUNG - 14 - - 8 - - 20 - 26 7 2 - - 7 - - 21 - 47 99 1 - - 15 - - 21 - - 106 17 - - 30 - - 62 - 73 1 2 - - 4 - - 4 - 13 143 714 - - 571 - - 176 - 277 302 143 - - 20 - - 172 - 104 - - - - - - - - - - WILAYAH SUMATERA 67 84 137 288 23 276 741 - 11. 12. 13. 14. 15. 16. DKI. JAKARTA JAWA BARAT BANTEN JAWA TENGAH D.I. YOGYAKARTA JAWA TIMUR - 58 2 3.969 9.143 25.022 - 130 8 16.526 4.570 17.963 - 51 2 4.909 1.843 9.918 - 239 12 25.404 15.556 52.903 - 56 3 8.537 369 12.599 - 434 366 517 81 701 - 2.477 76 64.458 58.702 92.268 - - - - - - WILAYAH JAWA 38.194 39.197 16.723 94.114 21.564 550 217.981 - 17. 18. 19. B A L INUSA TENGGARA BARAT NUSA TENGGARA TIMUR
3.555 19.852 80.920 8.369 35.972 79.594 690 11.141 19.886 12.614 66.966 180.400 3.774 13.014 38.913 451 362 489 23.039 72.523 273.562 68 - 30
WILAYAH NUSA TENGGARA & BALI 104.327 123.935 31.717 259.980 55.701 449 369.124 98
20. 21. 22. 23. KALIMANTAN BARAT KALIMANTAN TENGAH KALIMANTAN SELATAN KALIMANTAN TIMUR - 695 4 15 - 147 76 39 - 368 12 - - 1.210 92 54 - 62 43 14 - 419 569 359 - 1.424 424 70 - - - - WILAYAH KALIMANTAN 714 262 380 1.356 119 454 1.918 - 24. 25. 26. 27. 28. 29. SULAWESI UTARA GORONTALO SULAWESI TENGAH SULAWESI SELATAN SULAWESI BARAT SULAWESI TENGGARA 47 734 4.678 1.547 43 10.459 239 1.783 8.827 45.281 638 87.276 70 437 3.570 13.768 395 20.258 355 2.954 17.075 60.596 1.076 117.993 56 540 3.115 17.200 205 14.372 235 303 353 380 321 165 642 2.306 12.132 76.451 3.386 97.379 5 - - 243 - - WILAYAH SULAWESI 17.508 144.043 38.498 200.049 35.489 246 192.296 248 30. 31. 32. 33. M A L U K U MALUKU UTARA PAPUA PAPUA BARAT 1.866 1.556 986 60 6.565 4.381 2.810 237 485 32 1.048 107 8.916 5.969 4.845 404 1.915 1.476 582 46 292 337 207 192 14.946 3.695 3.421 225 - - - -
WILAYAH MALUKU & PAPUA 4.468 13.993 1.672 20.134 4.019 287 22.287 -
I N D O N E S I A 165.278 321.515 89.127 575.920 116.915 364 804.347 346
DIREKTORAT JENDERAL PERKEBUNAN
Directorate General of Estate Crops
Tabel 10.
Luas Areal dan Produksi Jambu Mete Perkebunan Rakyat, Besar Negara dan Besar
Swasta (PR + PBN + PBS) Menurut Provinsi dan Keadaan Tanaman Tahun 2013 *)
Table
Area and Cashew Nut ProducƟ on of Smallholder, Government and Private
Estate by Province and Tree Crop Classifi caƟ on, 2013 *)
No.
Provinsi/Province
Luas Areal/Area (Ha)
Produksi
ProducƟ on
(Ton)
ProdukƟ vitas/
ProducƟ vity
(Kg/Ha)
Jumlah
Petani/
Farmers
(KK)
Jumlah
Penyerapan
Tenaga Kerja
(TK)
TBM/
Immature
TM/
Mature
TTM/TR/
Damaged
Jumlah/
Total
1. 2. 3. 4. 5. 6. 7. 8. 9. 10. ACEH SUMATERA UTARA SUMATERA BARAT R I A U KEPULAUAN RIAU J A M B I SUMATERA SELATAN KEP. BANGKA BELITUNG BENGKULU LAMPUNG - 14 - - 8 - - 20 - 26 7 2 - - 7 - - 21 - 47 99 1 - - 15 - - 21 - - 106 17 - - 30 - - 62 - 73 1 2 - - 4 - - 4 - 13 144 716 - - 574 - - 177 - 278 302 144 - - 20 - - 172 - 104 - - - - - - - - - - WILAYAH SUMATERA 67 84 137 288 23 277 742 - 11. 12. 13. 14. 15. 16. DKI. JAKARTA JAWA BARAT BANTEN JAWA TENGAH D.I. YOGYAKARTA JAWA TIMUR - 58 2 3.981 9.152 25.047 - 130 8 16.530 4.579 17.988 - 51 2 4.899 1.841 9.898 - 239 12 25.410 15.572 52.933 - 57 3 8.581 371 12.672 - 436 368 519 81 704 - 2.478 76 64.473 58.764 92.321 - - - - - - WILAYAH JAWA 38.240 39.235 16.692 94.167 21.684 553 218.112 - 17. 18. 19. B A L INUSA TENGGARA BARAT NUSA TENGGARA TIMUR
3.559 19.872 81.001 8.372 35.992 79.675 688 11.130 19.846 12.620 66.995 180.522 3.793 13.084 39.131 453 364 491 23.051 72.554 273.748 68 - 30
WILAYAH NUSA TENGGARA & BALI 104.433 124.039 31.665 260.137 56.008 452 369.352 98
20. 21. 22. 23. KALIMANTAN BARAT KALIMANTAN TENGAH KALIMANTAN SELATAN KALIMANTAN TIMUR - 699 4 15 - 148 76 39 - 368 12 - - 1.214 92 54 - 62 43 15 - 420 572 377 - 1.428 424 70 - - - - WILAYAH KALIMANTAN 718 263 380 1.360 120 458 1.923 - 24. 25. 26. 27. 28. 29. SULAWESI UTARA GORONTALO SULAWESI TENGAH SULAWESI SELATAN SULAWESI BARAT SULAWESI TENGGARA 47 735 4.687 1.587 44 10.490 240 1.784 8.832 45.289 639 87.286 70 437 3.566 13.721 395 20.238 356 2.956 17.085 60.597 1.077 118.015 57 543 3.132 17.285 206 14.445 237 304 355 382 323 165 644 2.307 12.139 76.453 3.390 97.397 5 - - 243 - - WILAYAH SULAWESI 17.591 144.069 38.426 200.086 35.667 248 192.331 248 30. 31. 32. 33. M A L U K U MALUKU UTARA PAPUA PAPUA BARAT 1.868 1.558 989 60 6.567 4.383 2.811 237 485 32 1.047 107 8.919 5.972 4.848 404 1.919 1.484 585 46 292 339 208 193 14.951 3.697 3.423 225 - - - -
WILAYAH MALUKU & PAPUA 4.475 13.998 1.671 20.143 4.034 288 22.297 -
I N D O N E S I A 165.524 321.688 88.969 576.181 117.537 365 804.757 346
DIREKTORAT JENDERAL PERKEBUNAN
Directorate General of Estate Crops
Tabel 11.
Luas Areal dan Produksi Jambu Mete Perkebunan Rakyat, Besar Negara dan Besar
Swasta (PR + PBN + PBS) Menurut Provinsi dan Keadaan Tanaman Tahun 2014 **)
Table
Area and Cashew Nut ProducƟ on of Smallholder, Government and Private
Estate by Province and Tree Crop Classifi caƟ on, 2014 **)
No.
Provinsi/Province
Luas Areal/Area (Ha)
Produksi
ProducƟ on
(Ton)
ProdukƟ vitas/
ProducƟ vity
(Kg/Ha)
Jumlah
Petani/
Farmers
(KK)
Jumlah
Penyerapan
Tenaga Kerja
(TK)
TBM/
Immature
TM/
Mature
TTM/TR/
Damaged
Jumlah/
Total
1. 2. 3. 4. 5. 6. 7. 8. 9. 10. ACEH SUMATERA UTARA SUMATERA BARAT R I A U KEPULAUAN RIAU J A M B I SUMATERA SELATAN KEP. BANGKA BELITUNG BENGKULU LAMPUNG - 14 - - 8 - - 20 - 26 7 2 - - 7 - - 21 - 47 99 1 - - 15 - - 21 - - 106 17 - - 30 - - 62 - 73 1 2 - - 4 - - 4 - 13 144 718 - - 577 - - 178 - 279 301 144 - - 20 - - 173 - 104 - - - - - - - - - - WILAYAH SUMATERA 68 84 137 288 23 279 743 - 11. 12. 13. 14. 15. 16. DKI. JAKARTA JAWA BARAT BANTEN JAWA TENGAH D.I. YOGYAKARTA JAWA TIMUR - 58 2 3.993 9.207 25.172 - 130 8 16.534 4.597 18.013 - 51 2 4.894 1.839 9.888 - 239 12 25.421 15.644 53.074 - 57 3 8.625 374 12.746 - 438 370 522 81 708 - 2.481 76 64.501 59.033 92.566 - - - - - - WILAYAH JAWA 38.432 39.282 16.675 94.390 21.805 555 218.657 - 17. 18. 19. B A L INUSA TENGGARA BARAT NUSA TENGGARA TIMUR
3.591 20.011 81.406 8.378 36.012 79.756 687 11.119 19.826 12.656 67.143 180.988 3.813 13.154 39.350 455 365 493 23.116 72.714 274.455 69 - 30
WILAYAH NUSA TENGGARA & BALI 105.008 124.146 31.632 260.786 56.317 454 370.284 98
20. 21. 22. 23. KALIMANTAN BARAT KALIMANTAN TENGAH KALIMANTAN SELATAN KALIMANTAN TIMUR - 702 4 15 - 148 76 39 - 367 12 - - 1.218 92 54 - 63 44 16 - 422 574 398 - 1.433 424 70 - - - - WILAYAH KALIMANTAN 721 263 379 1.364 122 462 1.927 - 24. 25. 26. 27. 28. 29. SULAWESI UTARA GORONTALO SULAWESI TENGAH SULAWESI SELATAN SULAWESI BARAT SULAWESI TENGGARA 46 739 4.715 1.625 46 10.543 242 1.785 8.836 45.298 641 87.297 70 436 3.563 13.675 394 20.218 357 2.960 17.115 60.598 1.081 118.057 58 546 3.149 17.373 208 14.518 239 306 356 384 324 166 645 2.311 12.160 76.459 3.401 97.432 5 - - 242 - - WILAYAH SULAWESI 17.714 144.099 38.355 200.169 35.851 249 192.408 247 30. 31. 32. 33. M A L U K U MALUKU UTARA PAPUA PAPUA BARAT 1.877 1.565 994 61 6.571 4.384 2.813 237 484 32 1.046 107 8.932 5.981 4.853 405 1.929 1.492 588 46 294 340 209 194 14.973 3.703 3.427 225 - - - -
WILAYAH MALUKU & PAPUA 4.497 14.005 1.669 20.171 4.056 290 22.328 -
I N D O N E S I A 166.441 321.880 88.847 577.168 118.174 367 806.348 345
DIREKTORAT JENDERAL PERKEBUNAN
Directorate General of Estate Crops
Tabel 12.
Luas Areal dan Produksi Jambu Mete Perkebunan Rakyat Menurut Provinsi dan
Keadaan Tanaman Tahun 2012
Table
Area and Cashew Nut ProducƟ on of Smallholder by Province and Tree Crop
Classifi caƟ on, 2012
No.
Provinsi/Province
Luas Areal/Area (Ha)
Produksi
ProducƟ on
(Ton)
ProdukƟ vitas/
ProducƟ vity
(Kg/Ha)
Jumlah
Petani/
Farmers
(KK)
TBM/
Immature
TM/
Mature
TTM/TR/
Damaged
Jumlah/
Total
1. 2. 3. 4. 5. 6. 7. 8. 9. 10. ACEH SUMATERA UTARA SUMATERA BARAT R I A U KEPULAUAN RIAU J A M B I SUMATERA SELATAN KEP. BANGKA BELITUNG BENGKULU LAMPUNG - 14 - - 8 - - 20 - 26 7 2 - - 7 - - 21 - 47 99 1 - - 15 - - 21 - - 106 17 - - 30 - - 62 - 73 1 2 - - 4 - - 4 - 13 143 714 - - 571 - - 176 - 277 302 143 - - 20 - - 172 - 104 WILAYAH SUMATERA 67 84 137 288 23 276 741 11. 12. 13. 14. 15. 16. DKI. JAKARTA JAWA BARAT BANTEN JAWA TENGAH D.I. YOGYAKARTA JAWA TIMUR - 58 2 3.969 9.143 25.022 - 130 8 16.526 4.570 17.963 - 51 2 4.909 1.843 9.918 - 239 12 25.404 15.556 52.903 - 56 3 8.537 369 12.599 - 434 366 517 81 701 - 2.477 76 64.458 58.702 92.268 WILAYAH JAWA 38.194 39.197 16.723 94.114 21.564 550 217.981 17. 18. 19. B A L INUSA TENGGARA BARAT NUSA TENGGARA TIMUR
3.554 19.852 80.920 8.208 35.972 79.520 681 11.141 19.885 12.443 66.966 180.325 3.672 13.014 38.878 447 362 489 23.039 72.523 273.562
WILAYAH NUSA TENGGARA & BALI 104.326 123.700 31.707 259.734 55.564 449 369.124
20. 21. 22. 23. KALIMANTAN BARAT KALIMANTAN TENGAH KALIMANTAN SELATAN KALIMANTAN TIMUR - 695 4 15 - 147 76 39 - 368 12 - - 1.210 92 54 - 62 43 14 - 419 569 359 - 1.424 424 70 WILAYAH KALIMANTAN 714 262 380 1.356 119 454 1.918 24. 25. 26. 27. 28. 29. SULAWESI UTARA GORONTALO SULAWESI TENGAH SULAWESI SELATAN SULAWESI BARAT SULAWESI TENGGARA 44 734 4.678 1.368 43 10.459 235 1.783 8.827 45.027 638 87.276 69 437 3.570 13.434 395 20.258 348 2.954 17.075 59.829 1.076 117.993 55 540 3.115 17.161 205 14.372 233 303 353 381 321 165 642 2.306 12.132 76.451 3.386 97.379 WILAYAH SULAWESI 17.326 143.786 38.163 199.275 35.448 247 192.296 30. 31. 32. 33. M A L U K U MALUKU UTARA PAPUA PAPUA BARAT 1.866 1.556 986 60 6.565 4.381 2.810 237 485 32 1.048 107 8.916 5.969 4.845 404 1.915 1.476 582 46 292 337 207 192 14.946 3.695 3.421 225
WILAYAH MALUKU & PAPUA 4.468 13.993 1.672 20.134 4.019 287 22.287
I N D O N E S I A 165.096 321.022 88.782 574.900 116.737 364 804.347