5 1 7
Probabilistic longevity estimate for the LUSI mud volcano, East Java
R I C H A R D J. DAV I E S1* , S I M O N A . M AT H I A S1, R I C H A R D E . S WA R B R I C K1,2 & M A R K J. T I N G AY3 1Department of Earth Sciences, Durham University, Durham DH1 3LE, UK
2GeoPressure Technology, Mountjoy Research Centre, Durham DH1 3UZ, UK 3Department of Applied Geology, Curtin University, Perth, WA 6845, Australia
*Corresponding author (e-mail: [email protected])
Abstract:A new method for estimating the duration of a mud volcano eruption is applied to the LUSI mud volcano in East Java. The estimate is based upon carbonates at depths in the range 2500–3500 m being the water source, with an estimated area of 100–600 km2, thickness of 0.2–1.0 km, porosity of 0.15–0.25, an
initial pressure between 13.9 and 17.6 MPa, and a separate, shallower source of mud (c. 1200–1800 m depth). The resulting 50 percentile for the time it takes for flow to decline to,0.1 Ml day1is 26 years. By analogy
with natural mud volcanoes it can be expected to continue to flow at lower rates for thousands of years. Assuming subsidence rates of between 1 and 5 cm day1, land surface subsidence of between c. 95 and c. 475 m can be expected to develop within the 26 year time period.
The eruptive behaviour of mud volcanoes is highly variable. Kilometre-scale mud volcanoes in Azerbaijan and Trinidad show evidence for cyclic behaviour: violent, potentially destructive, eruptions generally lasting a matter of hours to days, interspersed with longer dormancy periods (Deville & Guerlais 2009; Deville et al. 2010). Metre-scale mud volcanoes near Wootton Bassett (UK) have very low eruption rates, and there are no historical records of violent eruption (Bristowet al.2000). Estimating the longevity of mud volcanoes has not been attempted before because they either erupt in regions of low population density (e.g. Azerbaijan) or are small enough to be benign (e.g. Wootton Bassett, UK). However, the LUSI mud volcano in East Java is unique on Earth as it covers 7 km2 and erupted in a populated
region of Sidoarjo in East Java, causing 13 000 families to lose their homes.
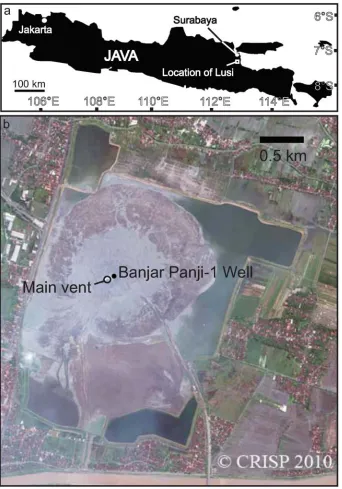
LUSI (Fig. 1) has the highest eruption rate for a mud volcano on Earth, of up to 180 000 m3 day1, but rather than being
cyclic it has been in a vigourous eruptive state since its initiation on 29 May 2006 (Davieset al.2007, 2008; Sawoloet al. 2009). The volcano is subsiding at rates of up to 5.5 cm day1 (Abidin et al. 2008; Istadi et al. 2009). Initially there
were five eruption sites, roughly aligned in a NE–SW direction (Mazzini et al. 2007), but subsequently one of these sites became the main central vent, which is nowc. 50 m wide (Fig. 1). Because of the subsidence and high water content in the erupted water–mud–gas mix, the mud volcano has a low relief (Fig. 1). Unusually, the subsurface geology is well defined by two commercial hydrocarbon exploration wells, one of which was drilled 150 m away from what became this main vent, and 2D seismic reflection across the area. The current continuous nature of the mud flow, coupled with the lack of knowledge of the mud flow’s likely duration and evolution, makes manage-ment of the disaster extremely difficult and completely different from other geological catastrophes, such as earthquakes and tsunamis.
The aim of this paper is to use the two exploration wells and knowledge of the subsurface from 2D seismic reflection data to propose a probabilistic method for the estimation of the long-evity of the LUSI mud volcano, and by doing so estimate the final impact of this humanitarian and ecological disaster.
Subsurface geology
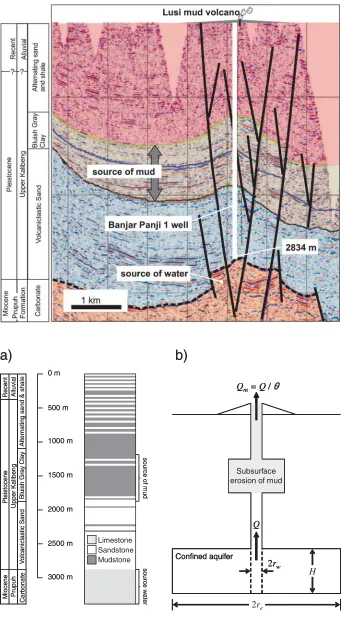
The Banjar Panji-1 gas exploration well, which was drilled 150 m from the mud volcano was targeting the carbonates of the Prupuh Formation. The well had drilled through (1) alluvial sediments, (2) Pleistocene alternating sandstone and shale of the Pucangan Formation (to 900 m depth), (3) Pleistocene bluish grey clay of the Upper Kalibeng Formation (to 1871 m depth), and (4) volcanic rocks and volcaniclastic sandstones at least 962 m thick (Figs 2 and 3). The last cuttings sample contained 5% carbonate and the well had drilled 281 m past the predicted depth of the top of the Prupuh Formation when drilling stopped because of significant drilling mud losses at 2813 m. Mud losses are a common phenomenon in Miocene carbonates in Indonesia. Kusumastuti et al. (2002) used seismic reflection data to show that the carbonate build-ups are of elongate form, striking NE– SW, and part of the Prupuh Formation. The Porong-1 well, located 6 km away from LUSI and drilled in 1993, penetrated 55 m of the Early Miocene Prupuh Formation with porosity ranging from 5 to 30% and a water column; other wells drilled on trend penetrated greater thicknesses with porosities from 11 to 32% (Kusumastutiet al.2002). Our interpretation is therefore that the well drilled either to just above or most probably into the Prupuh Formation.
Micropalaeontological recovery from the LUSI mud volcano shows that the source of the mud is from depths of 1300– 1800 m within the Upper Kalibeng Formation (Mazzini et al. 2007), dominated by overpressured mudstone. The Banjar Panji-1 well provides an uncased hole with diameter 0.3 m immedi-ately above, or potentially into the top of the Prupuh Formation through the low-permeability volcanic and volcaniclastic sand-stone and the Upper Kalibeng Formation.
The water in the mud is considered to originate from one of three sources: (1) the mudstones of the Upper Kalibeng Forma-tion, proposed by Mazzini et al. (2007) using geochemical criteria; however, phyllosilicate mudstones (.40% clay fraction) have permeabilities of between 1018and 1021m2 (Yang &
sandstone between 1871 and 2830 m depth, but with a bulk porosity of only 0.02–0.06 this will have an extremely low permeability; (3) the carbonate reef build-ups (Prupuh Forma-tion), based on the need for a high-volume and high-temperature fluid source (Davies et al. 2007, 2008); these carbonates were originally ascribed to the Kujung Formation by Davies et al. (2007), but are more likely to be part of the Prupuh Formation (see Kusumastutiet al.2002). The eruption rate was initially 120 000–180 000 m3day1(Mazziniet al.2007) of which 60% was
water (Istadiet al.2009) at an estimated temperature of 1008C. Down-hole measurements indicate a geothermal gradient of c. 428C km1(Mazziniet al.2007). Therefore a high-permeability
aquifer at greater than 2.4 km depth is required. The Early Miocene Prupuh Formation has been proven by drilling (Porong-1 well) and is the only formation that meets both these requirements (e.g. Tanikawaet al.2010).
There has been much debate as to whether LUSI was triggered by drilling or natural earthquake (see Davieset al.2008; Sawolo et al.2009; Davieset al.2010; Sawoloet al.2010). Rather than attempting to address this debate further, this paper seeks to investigate the implications of the Banjar Panji-1 wellbore drilling into and depressurizing the Prupah Formation from a hydrogeological perspective. Once a breach to surface is estab-lished, it is hypothesized that water initially rises through Banjar Panji-1 wellbore, mixes and entrains shallower mudstones of the Upper Kalibeng Formation (Figs 2 and 3) and then migrates up the Watukosek fault, producing an initial NE–SW-trending alignment of mud volcanoes (Fig. 2). This concept of a deeper source of fluid mixing with overpressured mudstone is consistent with many other mud volcano systems, where the source of the water is deeper and isolated from the source of mud (Bristowet al.2000; Kopfet al.2003; Deville et al.2010). Water migrates
upwards through faults and fractures, and then intersects argillac-eous strata that are thixotropic, overpressured, undercompacted and susceptible to subsurface erosion. The erosion processes are not understood but may involve erosion from the sidewalls of
new and existing fractures or plausibly also by a process similar to ‘piping’, where water erodes a conduit, as is observed in some clay-filled embankment dams (Fell et al.2003). For eruption to occur, the pressure of the water source, P [ML1T2], has to
Fig. 2.North–south-oriented seismic line that intersects the Banjar Panji 1 well (after Sawoloet al.2009).
exceed the pressure of a column of mud, water and gas, Pw
[ML1T2]. With time the pressure difference, PP w, will
equilibrate and the eruption rate will reduce.
Deterministic estimation method
Only a few attempts to simulate mud volcano dynamics using mathematical models are reported in the literature. Revil (2002) presented a pressure-wave model to simulate mud volcano genesis. Murton & Biggs (2003) described a viscous gravity current model to simulate surface flows of mud from submarine mud volcanoes. More recently, Zoporowski & Miller (2009) proposed a fluid-flow model for a cylindrical vent to simulate oscillatory eruption rates from mud volcanoes. The source of oscillatory behaviour, in their model, is similar to that more commonly associated with water hammer observed in pipes (e.g. Wylie & Streeter 1978). Zoporowski & Miller (2009) treated the influx of fluid into a finite mud store as either a constant flow per unit area or a constant total flow. In reality, the influx of fluid will decline as pressure within the associated fluid reservoir equilibrates with that of the volcano vent. Rather than concen-trating on the short-term dynamics, we focus on simulating the long-term influx decline based on a conventional 1D radial-flow reservoir engineering approach.
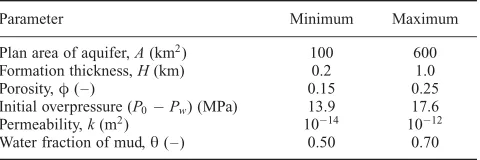
Calculation of eruption rate is approximated as follows. Let us consider the equation for axially symmetric, single-phase, Dar-cian flow in a homogeneous, isotropic and confined aquifer (e.g. Van Everdingen & Hurst 1949; Papadopulos & Cooper 1967)
S@P
subject to the boundary conditions
P¼P0, rw<r<re, t¼0 is viscosity, r[L] is radial distance from the origin of the vent, P0[ML1T2] is the initial pore pressure,rw[L] is the radius of
the vent,re[L] is the radius of the aquifer andPw[ML1T2] is
the pressure at the bottom of the vent. The storage coefficient is defined byS¼(cfþcr) whereis porosity [–],cf [M1LT2]
is the fluid compressibility and cr [M1 LT2] is the rock
compressibility (see, e.g. Chenet al.2006, p. 15). The flow of fluid from the aquifer is found from
Q¼2rwH
and the volume of fluid that has left the aquifer is found from
V¼ ðt
0
Q()d: (4)
The analytical solution forVin the Laplace domain is (see Van Everdingen & Hurst 1949, equation (VII-4)]
^
It should be noted that the Laplace transform for fluid flow can be obtained from
^ Q
Q¼sVV^(s): (7)
Equations (5) and (7) can be easily inverted back to the time domain using a numerical Laplace transform inversion algorithm. In this paper we use a MATLAB implementation of the Stehfest (1970) algorithm (as described by Valko & Abate 2004).
Estimates of erupted mud volume,Vm[L3] and mud flow rate,
Qm[L3T1] are found from
whereŁ[–] is the water fraction of the mud.
Probabilistic assessment
We populate the above model with parameters that reasonably describe the situation of concern. Four of these parameters are well constrained. At 1008C, the viscosity and compressibility of brine are around¼53104Pa s andc
f¼0.3 GPa1,
respec-tively (Batzle & Wang 1992). The compressibility of the rock (situated beneath 3000 m of overburden), cr, can be assumed
negligible and the vent radius, within the reservoir formation,rw,
is assumed to be 0.15 m, which was the original radius of the Banjar Panji-1 wellbore. It should be noted that it is likely that the wellbore has been completely destroyed in the overburden above from which the mud is sourced. However, within the immediately overlying confining layer, it is reasonable to assume that the well radius remained relatively unchanged.
The remaining parameters are estimated and can only be specified as ranges (see Table 1). Because of lack of information, uniform probability distributions between these ranges are assumed. It should be noted that the aquifer radius,re, is related
to the plan area,A[L2] viar
e¼(A/)1=2.
With these parameters, it is possible to run the model within a Monte Carlo simulation. The process is described as follows.N number of parameter sets were obtained by randomly sampling
Table 1.Ranges for unknown parameters
Parameter Minimum Maximum
Plan area of aquifer,A(km2) 100 600
Formation thickness,H(km) 0.2 1.0
Porosity,(–) 0.15 0.25
Initial overpressure (P0Pw) (MPa) 13.9 17.6
Permeability,k(m2) 1014 1012
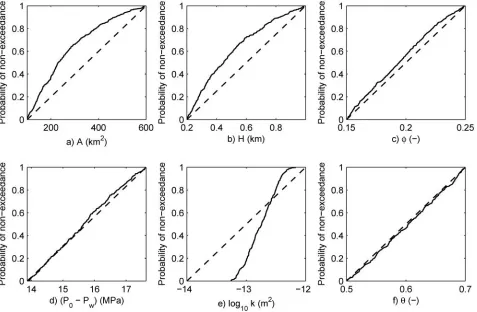
from uniform distributions defined by the ranges in Table 1. A total of 10 000 realizations were generated. These were then conditioned by comparison with estimates of the volume of erupted mud presented in the literature, specifically, 37.33106m3 of mud after 1 year (Istadi et al. 2009) and
733106m3 of mud after 3 years (Tingay 2010). Realizations
that failed to reproduce these two data points within20% were rejected. In this way, the original set of 10 000 realizations was reduced to only 381. The resulting posterior parameter distribu-tions are presented in Figure 4.
A statistical summary of theVmtime-series (Fig. 5) shows that
all realizations pass through20% of 37.33106m3 and 733
106m3 after 1 and 3 years, respectively. Furthermore, the 50 percentile result implies that the cumulative volume of fluid released will continue to increase at significant rates until around 10 years. A statistical summary of the Qm time-series (Fig. 6)
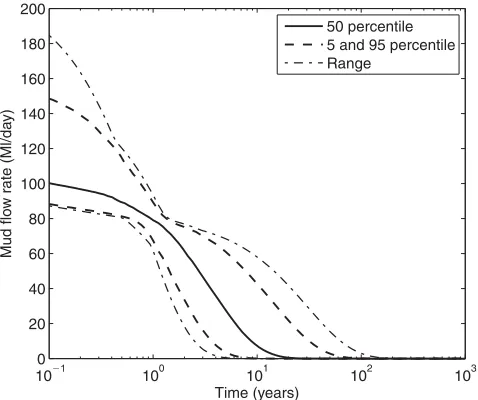
shows that the 50 percentile flow rate remains within a narrow range until around 2 years, beyond which it starts to decline. The decline in flow rate occurs as a result of the pressure wave caused by the volcano initiation having reached the boundary of the aquifer. The statistical properties of the time at whichQmhas
reduced to ,0.1 Ml day1 (considered to be a manageable
quantity, a tenth of the rate one would expect from a good water supply well) (Fig. 7) shows a mode at 10 years but the distribution shows log-normal type behaviour. The 5, 50 and 95 percentiles are 10, 26 and 100 years, respectively. Finally, cumulative probability distribution for the permeability of the aquifer (Fig. 4e) predicts that the model permeability ranges
from 531014to 731013m2 (50–700 mD), which is typical
of Miocene carbonate reservoirs in the region, further supporting the hypothesis that this is the source of the fluid.
Discussion and implications
Trigger
The trigger for the mud volcano is considered to be due to either drilling (Davieset al.2007, 2008) or the Yogyakarta earthquake (Mazzini et al.2007; Sawolo et al. 2009), or a combination of the two. As discussed above, the model presented here is not predicated on either of these interpretations being right. Rather, it is based upon the existence of a vertical wellbore that is drilled to immediately above or into the Prupuh Formation, therefore connecting overpressured source water to the mudstones of the Upper Kalibeng Formation, which is the source of the mud in the LUSI edifice.
Key assumptions
Excluding uncertainty associated with the triggering mechanism, the greatest source of uncertainty in the longevity estimate relates to the subsurface geology, especially the aquifer volume, which is addressed through Monte Carlo simulation of the input data range in Table 1. Seismic images of the subsurface given by Kusumastuti et al.(2002) show a relatively unfaulted, stratified carbonate, which can be assumed to have well-connected
porosity. Another important assumption is that the source water unit behaves as a closed system and is not exposed to recharge from deeper pore fluid sources. Additionally, the impact of gas buoyancy or expansion and its ability to assist the drive of fluids to the surface is not considered. In natural mud volcanoes, gas ascent and expansion provide lift without the need for a pressure drive from the aquifer. Based upon natural mud volcanoes, this could potentially keep the main vent active at low levels for thousands of years.
Source of water
Taking into account the above, our calculations suggest that the formation supplying the water would require a permeability of between 50 and 700 mD, which is four to eight orders of
magnitude higher than that which would be expected for a phyllosilicate mudstone, effectively ruling out the mudstones of the Upper Kalibeng Formation as a principal fluid source. As originally proposed by Davies et al. (2007), the higher per-meability Prupuh carbonate formation probably penetrated by the Banjar Panji l well adjacent to LUSI, and mapped on seismic data by Kusumastuti et al. (2002), is a much more likely candidate (Tanikawaet al.2010).
Other longevity estimations
Istadi et al. (2009) used the volume of what they termed the Upper Kalibeng 1 Formation at a daily constant eruption rate of 100 000 m3to estimate the number of years it would take for the
source of mud to be depleted. Their estimation was 23–35 years, but their method is probably flawed because (1) the eruption will continue after the mud source is depleted, as the source of fluid and the overpressure is very probably separate from the mud source, and (2) their method assumes a constant eruption rate rather than one that reduces with time, as one would expect during pressure reduction from an overpressured fluid source.
Impact
The 50 percentile estimate for the longevity of LUSI is that it will take 26 years for the flow to reach a rate less than 0.1 Ml day1. After 26 years the 50 percentile total volume of the mud
erupted is 0.14 km3. In addition, at a subsidence rate of 1–
5 cm day1 (Abidin et al. 2008; Istadi et al. 2009), total
subsidence will be 95–475 m. An ancient analogue exists 6 km east at Porong, where a 4 km diameter crater (now filled with sediment) is observed on seismic data as having c. 400 m of subsidence.
Conclusions
A detailed approach for estimating the longevity of mud volcano eruption where the source of water is separate from the source of mud has been presented. In this paper, a probabilistic estimate of longevity for the LUSI mud volcano is developed based upon the existence of a vertical wellbore that is drilled to immediately Fig. 5.Statistical presentation for the 381 accepted realizations of
volumes of mud as calculated by equation (8). The observed data are the estimates of erupted volumes presented by Istadiet al.(2009) and Tingay (2010) after 1 and 3 years, respectively.
Fig. 6.Statistical presentation for the 381 accepted realizations of mud flow rate as calculated by equation (8).
Fig. 7.Histogram and cumulative distribution of the time at which the volcano eruption rate has reduced to 0.1 Ml day1, obtained from the 381
above or into the Prupuh Formation, therefore connecting over-pressured source water to the mudstones of the Upper Kalibeng Formation. Applying the analysis to LUSI suggests that the time required for the flow to diminish to less than 0.1 Ml day1 is
likely to be in excess of 26 years. During this time the land surface is expected to have subsided by 95–475 m and the total volume of mud is likely to exceed 0.14 km3.
References
Abidin,H.Z.,Davies, R.J., Kusuma, M.A., Andreas, H. & Deguchi,T. 2008. Subsidence and uplift of Sidoarjo (East Java) due to the eruption of the LUSI mud volcano (2006–present). Environonmental Geology, 57, 833–844. doi:10.1007/s00254-008-1363-4.
Batzle, M. & Wang,Z. 1992. Seismic properties of pore fluids.Geophysics,57, 1396–1408.
Bristow, C.R., Gale, I.N., Fellman, E., Cox, B.M., Wilkinson, I.P. & Riding, J.B. 2000. The lithostratigraphy, biostratigraphy and hydrogeological signifi-cance of the mud springs at Templars Firs, Wootton Bassett, Wiltshire.
Proceedings of the Geologist’s Association, 111, 231–245, doi:10.1016/ S0016-7878(00)80016-4.
Chen, Z., Huan, G. & Ma,Y. 2006.Computational Methods for Multiphase Flows in Porous Media. Society for Industrial and Applied Mathematics, Philadel-phia, PA.
Davies, R.J., Swarbrick, R.E., Evans, R.J. & Huuse,M. 2007. Birth of a mud volcano: East Java, 29 May 2006.GSA Today,17, 4–9.
Davies, R.J., Brumm, M., Manga, M., Rubiandini, R., Swarbrick, R. & Tingay, M. 2008. The East Java mud volcano (2006 to present): An earthquake or drilling trigger? Earth and Planetary Science Letters,272, 627–638, doi:10.1016/j.epsl.2008.05.029.
Davies, R.J., Manga, M., Tingay, M., Lusianga, S. & Swarbrick,R. 2010. The LUSI mud volcano controversy: Was it caused by drilling? Discussion.
Marine and Petroleum Geology,27, 1651–1657.
Deville, E. & Guerlais,S.H. 2009. Cyclic activity of mud volcanoes: Evidences from Trinidad (SE Caribbean).Marine and Petroleum Geology,26, 1681– 1691.
Deville, E., Guerlais, S.-H., Lallemant, S. & Schneider, F. 2010. Fluid dynamics and subsurface sediment mobilization processes: an overview from Southeast Caribbean.Basin Research,22, 361–379.
Fell, R., Wan, C.F., Cyganiewicz, J. & Foster,M. 2003. Time for development of internal erosion and piping in embankment dams.Journal of Geotechnical and Geoenvironmental Engineering,129, 307–314.
Istadi, B.P., Pramono, G.H., Sumintadireja, P. & Alam,S. 2009. Modeling study of growth and potential geohazard for LUSI mud volcano: East Java, Indonesia. Marine and Petroleum Geology, 26, 1724–1739, doi:10.1016/ j.marpetgeo.2009.03.006.
Kopf, A., Dehyle,A.,et al.2003. Isotopic evidence (He, B, C) for deep fluid and mud mobilization from mud volcanoes in the Caucasus continental collision zone.International Journal of Earth Sciences,92, 407–425. Kusumastuti, A., Van Rensbergen, P. & Warren,J.K. 2002. Seismic sequence
analysis and reservoir potential of drowned Miocene carbonate platforms in the Madura Strait, East Java, Indonesia. AAPG Bulletin, 86, 213–232, doi:10.1306/61EEDA94-173E-11D7-8645000102C1865D.
Mazzini, A., Svensen, H., Akhmanov, G.G., Aloisi, G., Planke, S., Malthe-Sørenssen, A. & Istadi, B. 2007. Triggering and dynamic evolution of LUSI mud volcano, Indonesia.Earth and Planetary Science Letters,261, 375–388, doi:10.1016/j.epsl.2007.07.001.
Murton, B.J. & Biggs,J. 2003. Numerical modelling of mud volcanoes and their flows using constraints from the Gulf of Cadiz.Marine Geology,195, 223– 236, doi:10.1016/S0025-3227(02)00690-4.
Papadopulos, I.S. & Cooper, H.H. Jr 1967. Drawdown in a well of large diameter. Water Resources Research, 3, 241–244, doi:10.1029/ WR003i001p00241.
Revil,A. 2002. Genesis of mud volcanoes in sedimentary basins: A solitary wave-based mechanism. Geophysical Research Letters, 29, 1574, doi:10.1029/ 2001GL014465.
Sawolo, N., Sutriono, E., Istadi, B.P. & Darmoyo,A.B. 2009. The LUSI mud volcano triggering controversy: Was it caused by drilling? Marine and Petroleum Geology,26, 1724–1739, doi:10.1016/j.marpetgeo.2009.04.002. Sawolo, N., Sutriono, E., Istadi, B.P. & Darmoyo,A.B. 2010. The LUSI mud
volcano triggering controversy: Was it caused by drilling? Reply.Marine and Petroleum Geology,27, 1658–1675.
Stehfest, H. 1970. Algorithm 368: Numerical inversion of Laplace transforms (D5).Communications of Association for Computing Machinery,13, 47–49, doi:10.1145/361953.361969.
Tanikawa, W., Sakaguchi, M., Wibowo, H.T., Shimamoto, T. & Tadai, O. 2010. Fluid transport properties and estimation of overpressure at the Lusi mud volcano, East Java Basin.Engineering Geology,116, 73–85.
Tingay, M. 2010. Anatomy of the ‘Lusi’ mud eruption, East Java.Australian Society of Exploration Geophysicists, Extended Abstracts, 1, 1–6, doi:10.1071/ASEG2010ab241.
Valko, P.P. & Abate,J. 2004. Comparison of sequence accelerators for the Gaver method of numerical Laplace transform inversion.Computers and Mathe-matics with Applications,48, 629–636, doi:10.1016/j.camwa.2002.10.017. Van Everdingen, A.F. & Hurst, W. 1949. The application of the Laplace
transformation to flow problems in reservoirs.Transactions of the American Institute of Mining Engineers,186, 305–324.
Wylie, E.B. & Streeter,V.L. 1978.Fluid Transients. McGraw–Hill, New York. Yang, Y. & Aplin, A.C. 2010. A permeability–porosity relationship for
mudstones. Marine and Petroleum Geology,27, 1692–1697, doi:10.1016/ j.marpetgeo.2009.07.001.
Zoporowski, A. & Miller,S.A. 2009. Modelling eruption cycles and decay of mud volcanoes.Marine and Petroleum Geology,26, 1879–1887, doi:10.1016/ j.marpetgeo.2009.03.003.