Didem Kurt & John Hulland
Aggressive Marketing Strategy
Following Equity Offerings and Firm
Value: The Role of Relative Strategic
Flexibility
Firms raise a significant amount of funds and gain competitive advantage over their rivals through equity financing, namely through initial public offerings and seasoned equity offerings. The authors find that both initial public offering firms and seasoned equity offering firms adopt a more aggressive marketing strategy during the two years following their offering. However, not all equity issuers benefit equally from increased marketing spending, which can help signal companies’ growth prospects to investors. A key moderator of the link between marketing investment and firm value is the strategic flexibility of rivals with respect to issuers. In particular, the stock market reacts favorably to an aggressive marketing strategy initiated by issuers competing against rivals with relatively less flexibility, whereas increased marketing expenditures do not translate into higher firm value when rivals have greater flexibility. Furthermore, the authors show that marketing expenditures create value within context: the role of marketing in enhancing shareholder value and the moderating effect of rivals’ strategic flexibility are more pronounced in the two-year window immediately following an equity offering than at any other time. The authors conclude with a discussion of implications for theory and practice.
Keywords: marketing–finance interface, marketing resources, financial market performance, equity offerings, strategic flexibility, signaling
Didem Kurt is Assistant Professor of Marketing, School of Management, Boston University (e-mail: [email protected]). John Hulland is Emily H. and Charles M. Tanner Jr. Chair in Sales Management, Terry College of Busi-ness, University of Georgia (e-mail: [email protected]). The authors thank Mei Feng, Ahmet Kurt, Natalie Mizik, and the JMreview team for their comments on earlier versions of this article. Leigh McAlister served as area editor for this article.
General Motors Co., which raised more than $20 billion in an initial public offering yesterday, will be more aggressive marketing its brands.
—bloomberg.com, November 18, 2010
The successful completion of our $550 million common stock offering this week provides us with the strategic flexibility to continue the momentum we created and compete aggressively.
—Radian Group Inc., Business Wire, May 12, 2010
A
lthough the extant literature on the marketing– finance interface links investments in marketing to subse-quent financial outcomes (for a review, see Srinivasan and Hanssens 2009), researchers have paid surprisingly little attention to the effect of corporate financial policy on market-ing strategy and subsequent firm value. As Garmaise (2009, p. 325) notes, “Marketing assets are typically financed with equity.” Thus, a better understanding of the connection between marketing strategy and firms’ acquisition of equity capital through initial public offerings (IPOs) and seasonedequity offerings (SEOs) is critical to longer-term success; yet very little is known about how strategic marketing investments are related to these financing decisions. Such an understanding is needed to help marketers achieve a more equal footing with other members in the boardroom (Nath and Mahajan 2008; Verhoef and Leeflang 2009).
Initial public offerings take place when firms seek equity investment from the public for the first time. In con-trast, SEOs involve the issuance of additional equity by public companies to raise capital. Both IPOs and SEOs play a critical role in enhancing firms’ competitive positions in product markets because issuers can raise significant amounts of cash to finance new projects (Akhigbe, Borde, and White 2003; Hsu, Reed, and Rocholl 2010). However, the following key questions of interest for marketers have not been addressed to date: (1) To what extent do firms change their marketing efforts as a result of raising signifi-cant amounts of capital through the issue of equity? (2) How does this change in marketing investment affect subse-quent firm value? and (3) Are returns to firms’ marketing efforts during the immediate postoffering period different than during other time periods? The current study addresses all three questions.
Researchers have begun to examine how changes in the marketing strategies of equity-issuing firms made before
increasing demand for their stocks. Mizik and Jacobson (2007) examine firms’ marketing expenditures before SEO issuance and find that the long-term stock performance of firms that decrease their marketing spending in the preoffer-ing period is inferior to that of other issupreoffer-ing firms that do not reduce their pre-SEO spending. However, these studies focus exclusively on the preoffering marketing strategies of issuing firms and do not examine how issuing firms’ mar-keting efforts change in the postoffering period or how investors respond to these changes.
Using data sets of IPOs and SEOs issued in the United States between 1970 and 2004, we find that both IPO and SEO firms adopt a more aggressive marketing strategy dur-ing the two-year period followdur-ing their offerdur-ing.1We argue
that increased marketing expenditures enable issuers to sig-nal their growth prospects to the stock market and commu-nicate a willingness to make major investments in market-based assets. In that sense, these postoffering marketing investments can help managers mitigate investor concerns that the equity issuance is nothing more than an attempt to “cash in” on market overvaluation (Myers and Majluf 1984) but instead a legitimate initiative to take advantage of growth opportunities. However, we then contend that not all firms benefit equally from an increase in postoffering mar-keting spending and identify a boundary condition for the link between marketing expenditures and firm value: strate-gic flexibility of rivals with respect to issuers.
Drawing on previous research (e.g., Aaker and Mas-carenhas 1984; Ansoff 1965), we use financial leverage (i.e., debt-to-asset ratio) as a proxy for strategic flexibility. This measure fits well with the context of our study and is rooted in both theoretical and empirical literature examin-ing the link between firms’ financial strength and product market behavior (e.g., Bolton and Scharfstein 1990; Cheva-lier 1995; Gielens et al. 2008; Telser 1966). The main find-ing emergfind-ing from this stream of literature is that firms with low financial leverage (i.e., higher strategic flexibility) are better able to respond to an aggressive product market strat-egy initiated by a competitor, whereas highly leveraged firms often lack the resources needed to counteract an aggressive strategy. Moreover, highly leveraged firms, which have a higher probability of experiencing financial distress and bankruptcy, may be reluctant to invest in mar-keting resources due to their intangible and nontransferable nature (Grullon, Kanastas, and Kumar 2006; Srivastava, Shervani, and Fahey 1998).
Our results suggest that the stock market reacts favor-ably to an aggressive marketing strategy initiated by equity issuers competing against rivals with relatively less strate-gic flexibility, whereas increased marketing expenditures do not translate into higher firm value when the rivals have more strategic flexibility than the issuers (i.e., they have a lower percentage of debt vs. equity financing in their capital structures). Furthermore, we address whether the significant interactive effect of marketing resources and relative
strate-gic flexibility on firm value is only observed in the periods immediately following equity issuance or whether this effect also manifests itself during other periods. The postoffering period is unique for several reasons, making it a worthwhile period in which to examine the marketing– finance interface. First, equity offerings may convey the unfavorable mes-sage that the firm’s shares are overvalued (Myers and Majluf 1984). In addition, equity issuance (especially IPOs) can signal a change in the outlook of an industry as a whole, leading to increased investor attention not only for issuers but also for their rivals (Akhigbe, Borde, and White 2003). Therefore, during the postoffering period, there is greater need for marketing spending, which can help firms commu-nicate their growth prospects to investors. Second, an equity offering recapitalizes the firm in a way that signifi-cantly decreases its debt-to-equity ratio, leading to a major and rapid shift in its strategic flexibility against rivals. Third, because equity-issuing firms raise significant amounts of cash that can be used to finance new projects, these firms gain a temporary competitive advantage over rivals (Hsu, Reed, and Rocholl 2010). Thus, we contend that marketing investments in this postoffering period can have a particularly profound impact on shareholder wealth. Consistent with our prediction, we find that although strate-gic flexibility of rivals moderates the relationship between marketing expenditures and firm value in all periods, this effect is more significant in the years immediately follow-ing equity issuance than in other periods.
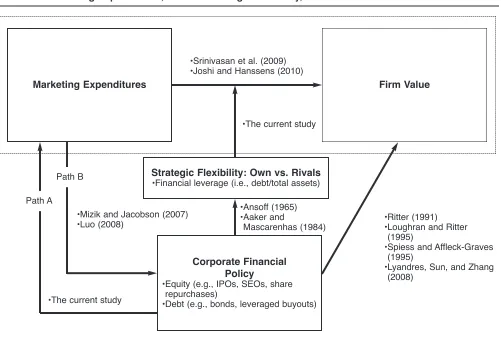
Our research makes at least two important contributions to the literature. First, to the best of our knowledge, our study is the first to introduce, operationalize, and empirically test the concept of strategic flexibility in the marketing– finance literature. Johnson et al. (2010, p. 85) point out that “[strategic flexibility] has not been considered from strate-gically crucial marketing perspectives.” Specifically, we examine how enhanced flexibility is associated with aggres-sive marketing strategy and in turn how stock return perfor-mance reflects this relationship. It is important to study strategic flexibility because it is a key factor determining firms’ willingness and ability to adapt to changing competi-tive environments. Theories of market-based assets (Srivas-tava et al. 1998) and customer equity (Rust et al. 2004) sug-gest that increased marketing efforts can help firms enhance their market values. Our study demonstrates that this impact is likely to be heterogeneous not only across firms but also across market situations. In particular, investors’ assess-ments of the strategic flexibility of industry rivals moderate how they respond to changes in firms’ marketing invest-ments (shown as a moderating effect in Figure 1), and this effect is more salient during the postoffering period.
Second, we contribute to the nascent literature on the marketing–finance interface around equity offerings. Whereas Luo (2008) and Mizik and Jacobson (2007) show that issu-ing firms either use or sacrifice preofferissu-ing marketissu-ing resources to raise more capital, we examine whether issuers use raised funds to finance further marketing investments and how investors react to changes in their marketing spending. Our contribution beyond these studies is critical because managers, who command significantly greater resources during the postoffering versus preoffering period,
1An aggressive marketing strategy can involve either the tone or
need to better understand the impact of postoffering invest-ments in marketing on firm value to make appropriate and timely spending decisions. Moreover, our study is funda-mentally different from Luo’s (2008) and Mizik and Jacob-son’s (2007) in that we examine the impact of corporate financial policy on marketing spending (which in turn affects shareholder wealth), whereas they focus solely on the effect of marketing spending on financial metrics. We illustrate this distinction in Figure 1 as Path A versus Path B. Relatedly, our study offers practical implications that are relevant for the postoffering period, when firms have greater flexibility to undertake major investments, whereas Luo (2008) and Mizik and Jacobson (2007) offer implications that are applicable in the period leading up to the offering.
The remainder of the article is organized as follows. First, we present our conceptual framework and derive testable hypotheses. Next, we describe the marketing and financial data sources we use in our empirical study, explain our methodology, and present our results. Finally, we dis-cuss the implications of our findings.
Conceptual Background
Most firms must routinely consider various forms of financ-ing to be able to make appropriate marketfinanc-ing decisions. Although firms’ capital structures exhibit considerable cross-sectional variation, many firms find it necessary at
some point to access public equity. Through IPOs, private firms raise a significant amount of funds with which to finance new projects. Indeed, IPOs play an important role in the growth of the U.S. economy, representing $285 billion raised through more than 1,000 offerings during the first decade of the twenty-first century.2Successful IPOs provide
issuing firms with additional benefits, including increased public recognition and heightened financial analyst interest. In addition, IPOs not only satisfy the immediate capital requirements of the firm but also enable firms to make sub-sequent equity offerings to raise additional capital, typically referred to as SEOs. These offerings are an important source of external funding for public companies in that the number of SEOs issued during the first decade of the twenty-first century is more than double the number of IPOs.
Although equity offerings provide firms with various benefits, they do not guarantee superior subsequent firm performance. Indeed, most extant work shows the opposite. For example, previous research (e.g., Jain and Kini 1994; Loughran and Ritter 1997) has shown that both IPO and SEO firms significantly increase their investment in physi-cal assets such as new machines, equipment, plants, and stores in the postoffering period. However, excessive capi-tal expenditures by issuing firms can result in the deteriora-tion of operadeteriora-tional performance. Indeed, although IPO
2We retrieved these data from Jay Ritter’s website (Ritter 2011).
FIGURE 1
Marketing Expenditures, Relative Strategic Flexibility, and Firm Value: A Framework
Marketing Expenditures Firm Value
Strategic Flexibility: Own vs. Rivals
•Financial leverage (i.e., debt/total assets)
Corporate Financial Policy
•Equity (e.g., IPOs, SEOs, share repurchases)
•Debt (e.g., bonds, leveraged buyouts)
•Ritter (1991) •Loughran and Ritter
(1995)
•Spiess and Affleck-Graves (1995)
•Lyandres, Sun, and Zhang (2008)
•Ansoff (1965) •Aaker and
Mascarenhas (1984) •The current study
•Mizik and Jacobson (2007) •Luo (2008)
•The current study
•Srinivasan et al. (2009) •Joshi and Hanssens (2010)
firms often significantly increase their postoffering capital expenditures, their profitability and productivity typically decline substantially (Chemmanur, He, and Nandy 2010). In parallel, SEO firms have higher ratios of capital expendi-ture and research and development (R&D) to assets than nonissuers in the years following equity issuance, and yet their operating performance—as measured by operating income relative to sales, profit margin, and return on assets—decreases significantly following the offering (Fu 2010; Loughran and Ritter 1997). Relatedly, both IPO and SEO firms, on average, experience poor postoffering stock return performance (for a review, see Ritter 2003).
Recent IPOs with disappointing postoffering stock per-formance, such as Facebook, Groupon, and Zynga, have fueled the long-lasting debate on whether firms sell shares to the public to take advantage of growth opportunities or to convert overvalued equity into cash. In their seminal article, Myers and Majluf (1984) develop an adverse selection model, proposing that managers—who are better informed than investors about the value of the firm’s assets in place and growth opportunities—prefer to issue equity when their private valuation is lower than that of investors. Thus, equity offerings may be interpreted as a signal that the issuer’s stock is overvalued (Asquith and Mullins 1986; Masulis and Korwar 1986). It is therefore critical for managers of equity-issuing firms to communicate their firms’ prospects to investors clearly and take actions highlighting their com-mitment to undertake profitable investment opportunities.
Luo (2008) and Chemmanur and Yan (2009) examine whether issuers change their marketing spending before issuance to reduce information asymmetries and how such spending changes affect investors’ reactions to offering announcements. On the one hand, Luo (2008) argues that managers can better convey their firm’s intrinsic value and future prospects to potential investors by using product-market advertising, enabling them to enhance trading vol-umes, reduce IPO underpricing, and thereby raise more cap-ital. Consistent with this view, Chemmanur and Yan (2009) find that, on average, IPO firms spend more on advertising in the IPO year than the pre-IPO years. On the other hand, Mizik and Jacobson (2007) find that some SEO firms engage in “myopic management,” cutting their marketing spending before issuance so they can report higher earnings and sell shares at a higher price. All three studies focus solely on changes in the preoffering marketing expenditures of issuing firms (i.e., Path B in Figure 1). However, analysis of postoffering changes in the marketing spending of IPO and SEO firms and the valuation impact of these changes is also needed; this analysis is the focus of our study. In the postoffering period, issuers have more resources and greater flexibility to alter their marketing efforts and better commu-nicate their growth prospects to investors.
We contend that increased marketing efforts during the postoffering period can enable managers to reveal their favor-able private information about their firms’ future profitability and productivity, helping investors better assess the issuers’ growth opportunities as well as the return on their current investments in physical assets. Previous research provides the basis for this argument. Erickson and Jacobson (1992), for example, conduct one of the earliest studies pointing out
the signaling role of marketing spending. They maintain that increased advertising expenditures are associated with greater stock returns because investors interpret them as signals of higher future profitability. Other studies have highlighted that marketing data can help investors form more accurate expectations about the size, timing, and risk of a company’s future cash flows (e.g., Joshi and Hanssens 2010; Srivastava et al. 1999). This stream of literature pro-poses that greater investment in marketing resources enhances cash flow, accelerates the receipt of cash flow, and reduces the firm’s vulnerability to cash flow variability.
In particular, theories of market-based assets (Srivas-tava et al. 1998) and customer equity (Rust et al. 2004) sug-gest that increased marketing spending helps firms generate valuable assets such as strong brands and loyal customers, thus creating entry and switching barriers. Consequently, high levels of marketing spending can be an indication of greater future profitability. For example, a firm that builds new facilities and buys new machinery to increase its pro-duction capacity can signal a greater return on these invest-ments through higher marketing expenditures, which will help the firm boost its sales and utilize its higher capacity. Indeed, Rao and Bharadwaj (2008) demonstrate that mar-keting activities boost productivity by reducing a firm’s total working capital requirement. In parallel, a company that raises equity can open stores in a new region but will benefit more fully by using some of its capital on higher advertising spending to attract new customers and increase sales to existing customers. Furthermore, McAlister, Srini-vasan, and Kim (2007) show that more advertising lowers a company’s systematic risk (and thus cost of capital) by insulating it from the negative impact of market downturns. Overall, recent literature has suggested that marketing investments can increase firm value by leading investors to revise their future cash flow expectations upward as well as to discount those cash flows at a lower rate. However, we argue that not all firms can be expected to benefit from pur-suing an aggressive marketing strategy following equity issuance. We propose the strategic flexibility of rivals as a significant moderator of how investors respond to firms’ increased marketing efforts.
Strategic Flexibility
Liquid assets, in addition to providing the capacity to raise additional financial resources when necessary, allow firms to both absorb and react to unfavorable developments in their competitive environments. In particular, maintain-ing an adequate level of flexibility in other functional areas such as operations and marketing depends critically on whether firms have sufficient financial flexibility. Previous studies (e.g., Aaker and Macarenhas 1984; Ansoff 1965) have suggested that financial leverage (i.e., debt-to-asset ratio) is a critical determinant of flexibility. The key advan-tage of financial leverage is that it is an objective measure that is publicly available for a large number of firms. In line with previous research, as we discuss in detail subsequently, we maintain that highly leveraged firms have less strategic flexibility and are less likely to respond to the aggressive marketing tactics of their equity-issuing competitors.
Other possible financial measures of strategic flexibility include such variables as cash and current ratio (i.e., current assets divided by current liabilities). We contend that lever-age is a more appropriate measure of flexibility in our con-text for two reasons. First, contrary to popular belief, previ-ous research has indicated that financially constrained (vs. unconstrained) firms tend to hold more cash due to precau-tionary motives (e.g., Whited and Wu 2006). Thus, larger cash reserves alone do not necessarily indicate a higher level of strategic flexibility. Second, in contrast to financial lever-age, cash and current ratio neither measure the difficulty of obtaining additional capital nor capture the degree of man-agers’ reluctance to make investments in intangible assets. In addition, note that financial leverage is a more forward-looking measure in that firms using more debt must pay out a larger part of their current and future cash flows as inter-est payments, reducing their future cash holdings. To shed some light on how financial leverage limits firms’ strategic flexibility, we next review the finance literature focusing on the link between leverage and product-market behavior.
Financial Leverage and Flexibility
The finance literature has extensively studied the connec-tion between financial markets and product markets (e.g., Bolton and Scharfstein 1990; Campello 2006; Chevalier 1995; Kovenock and Phillips 1997; Phillips 1995). Telser’s (1966) so-called long-purse theory of predation describes how cash-rich firms drive their financially weak rivals out of the market by adopting aggressive product market strate-gies that reduce rivals’ cash flows. Relatedly, Bolton and Scharstein (1990) argue that financial constraints imposed on rival firms (by their external financiers) encourage deep-pocketed firms to engage in predatory behavior and force these financially weak rivals out of business.
Several studies provide empirical support for the long-purse argument. For example, Opler and Titman (1994) find that highly leveraged firms in distressed industries lose market share to their less leveraged rivals. In parallel, Chevalier (1995) documents that highly leveraged super-markets compete less aggressively and are subject to aggressive competitive behavior (e.g., market expansion) by less leveraged firms. Similarly, European retailers with higher leverage have been shown to experience poorer
per-formance than their less leveraged counterparts following Wal-Mart’s 1999 entry into the United Kingdom (Gielens et al. 2008). Kovenock and Phillips (1997) find that a firm is more likely to close plants and less likely to make major new investments following leveraged recapitalization (i.e., changing capital structure by significantly increasing debt). In a related study, Zingales (1998) finds that highly lever-aged trucking firms were less likely to survive following the Carter deregulation because high levels of debt limited carriers’ ability to invest and affected the price they could charge during the price wars after the deregulation.
This limited flexibility and weakened competitive response ability of highly leveraged firms is partly because they must use cash generated from operations to service their debt loads. As a result, highly leveraged firms can find themselves in a situation in which they must limit their investment, cut discretionary expenses, and reduce the qual-ity of their products and services. For example, Matsa (2011) finds that high leverage and limited corporate liquid-ity are associated with more frequent stockouts and lower product quality in the supermarket industry. Even when expenses do not need to be cut, high-leverage firms are often constrained in their ability to raise additional debt capital because they have used most of the credit lines available to them. In addition, their cost of equity is high due to the increased riskiness associated with large debt on their balance sheet. Finally, research has shown highly leveraged firms to be reluctant to make major marketing investments such as advertising due to the intangible and nontransferable nature of marketing assets (Grullon, Kanatas, and Kumar 2006). That is, because leverage increases the probability of financial distress and because marketing assets cannot be liquidated in the case of finan-cial distress (or bankruptcy), highly leveraged firms tend to limit their marketing expenditures.
In light of the previous discussion, we propose that an IPO or SEO firm competing against rivals with less strategic flexi-bility is more likely to benefit from increasing its marketing efforts after an equity offering than a firm operating in an industry composed of rivals with relatively higher strategic flexibility. This is because the value of growth opportunities communicated through increased marketing spending depends critically on the extent to which industry rivals would react to take advantage of similar opportunities. Indeed, investors may negatively view an aggressive marketing strategy initiated by an issuer with relatively flexible rivals due to the timely and effective responses that those rivals can make, which results in lower stock returns. Formally:
H1: The relative strategic flexibility of industry rivals with
respect to IPO- and SEO-issuing firms moderates the rela-tionship between issuers’ postoffering marketing expendi-tures and firm value. Specifically, increased marketing expenditures are associated with higher firm value for issuers facing rivals with relatively less flexibility but not for issuers facing rivals with relatively more flexibility.
Postoffering Period Versus Nonoffering Period
less flexibility are more likely to benefit from increased marketing efforts during this period. We build our argument on the basis of two streams of literature: investor reaction around offerings (e.g., Asquith and Mullins 1986; Bayless and Chaplinsky 1996; Masulis and Korwar 1986) and competitive effects of offerings (e.g., Akhigbe, Borde, and White 2003; Hsu, Reed, and Rocholl 2010).
An extensive stream of literature in finance has empha-sized that managers sell their companies’ shares to the pub-lic to exploit equity mispricing rather than to raise capital for profitable investment opportunities. Although investors are already generally concerned with holding or buying overvalued stocks, these concerns are heightened when companies announce equity offerings. This is because the pecking order theory of Myers and Majluf (1984) suggests that managers prefer to finance investments with debt and retained earnings and will only issue equity when their pri-vate valuation of their company’s stock is lower than that of the market. An equity issuance therefore may convey the message that the company’s stock is overvalued, and issu-ing firms that fail to communicate their prospects to investors can expect poor stock returns. Accordingly, the role of marketing spending in mitigating investors’ con-cerns that a particular stock is overvalued is expected to be more pronounced during the period that immediately fol-lows an offering as compared with nonoffering periods.
Another important reason the postoffering period is unique is that a firm’s equity issuance leads to a change in the industry’s competitive environment. Equity-issuing firms raise a significant amount of funds and thus gain a temporary edge over their rivals. Firms can use proceeds from the offering to initiate new competitive tactics, which alter the industry dynamics. Furthermore, equity issuance recapitalizes the issuing firm in a way that results in a sig-nificant and immediate decline in its debt-to-capital ratio, enhancing its relative strategic flexibility versus rivals. Such a leverage-decreasing shift in a firm’s capital struc-ture, a rapid improvement in flexibility, is unlikely to occur during periods other than those immediately following an equity offering. In addition, equity issuance—particularly an IPO—may signal a change in industry outlook and increase investor attention toward not only issuers but also their rivals. Relatedly, Hsu, Reed, and Rocholl (2010, p. 495) recommend that “firms that compete with IPO candi-dates need to understand how new issuance affects their competitive environment and how they can strategically respond to it.” However, it would be unrealistic to assume that the competitive advantages of issuers, including height-ened investor attention, will last forever. As the offering proceeds are used up, marketing strategies are imple-mented, and growth opportunities become fewer, the tem-porary relative advantage of issuers will dissipate.
The previous discussion suggests that the role of mar-keting in enhancing firm value and the moderating role of relative strategic flexibility are expected to be stronger in the immediate postoffering period versus other periods for three main reasons: (1) increased investor attention for both issuers and rivals, (2) a significant shift in the strategic flexibility of issuers relative to their rivals, and (3) intensi-fied competition among industry members. Formally:
H2: The interactive effect of firms’ marketing expenditures and their rivals’ relative strategic flexibility on firm value is more pronounced in the years immediately following an equity offering (i.e., year +1 and year +2) than in other periods.
Data and Measures
Sample
We obtained our sample of IPO and SEO firms from the Securities Data Corporation’s New Issues database for the period 1970–2004. Consistent with previous work, we exclude closed-end funds, American Depository Receipts, real estate investment trusts, unit offerings, spin-offs, reverse leveraged buyouts, regulated utilities, and financial firms. In addition, we include only those offerings that involve at least some newly issued (i.e., primary) shares (to avoid including offerings that solely involve the insiders’ resale of existing shares). Finally, for our IPO sample, we eliminate any IPO followed by an SEO issuance within the next two years to ensure that our results are not confounded by the SEO effect. Similarly, for our SEO sample, we dis-card any SEOs issued within the two years following an IPO to avoid confounding IPO effect. We gathered monthly stock returns data from the University of Chicago’s Center for Research in Security Prices and accounting information from the Compustat Fundamentals Annual File.
To ensure that our results are not driven by small firms, we exclude those issuers with total assets less than $10 mil-lion at the end of the offering year. This filtration criterion is commonly used in studies that examine capital structure changes and equity issuance (e.g., Baker and Wurgler 2002; Leary and Roberts 2005). Furthermore, after eliminating offerings with insufficient stock return and accounting/ marketing data to enter into our regression analyses, the final IPO sample represents 1,581 offerings, and the final SEO sample represents 1,729 offerings by 1,200 unique firms.3
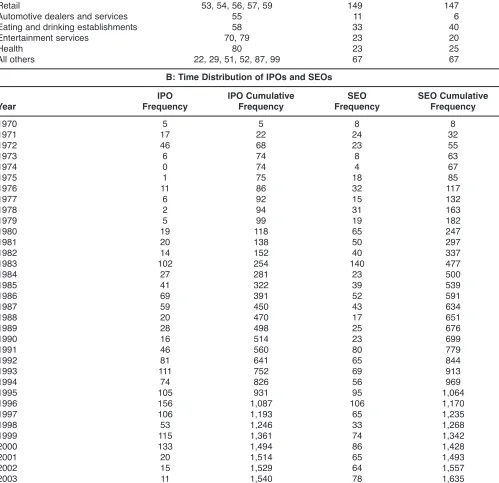
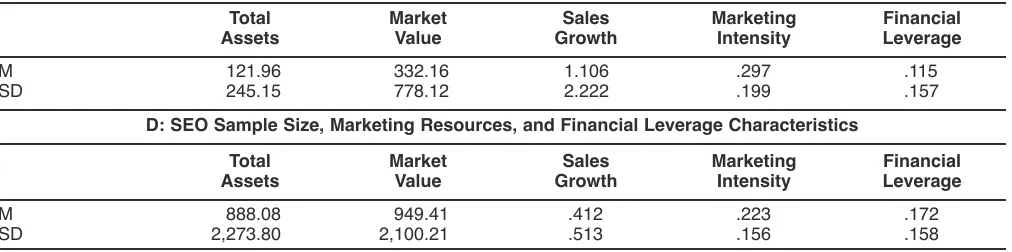
Table 1 summarizes the sample statistics for the final sets of IPO and SEO firms. Panel A reports the distribution of offerings by industry, and Panel B reports the distribution by year.4Panels C and D summarize the mean and standard
deviation for five characteristics of the IPO and SEO firms as reported in the year of the offering (i.e., year 0): total assets, market value, annual sales growth, marketing inten-sity (the firm’s marketing spending in the issue year scaled by its total assets), and financial leverage (total debt divided by total assets).
3We cannot directly compare the size of our SEO sample with
that reported in Mizik and Jacobson (2007) due to differences in data filtration (e.g., we exclude SEOs issued within two years fol-lowing the IPO) and sample period between the two studies. How-ever, we obtain a number (i.e., 2,281) close to what they report (i.e., 2,238) if we restrict our sample to the period 1970–2001 and do not exclude SEOs issued within two years following an IPO.
4In our sample, there is only one IPO issued in 1975 and no
TABLE 1
Characteristics of IPOs and SEOs Included in the Sample over 1970–2004
A: SIC Distribution of IPOs and SEOs
Industry SIC Code(s) IPO SEO
Oil and gas 13 6 35
Food products 20 15 17
Apparel and other textile products 23 2 1
Paper and paper products 24, 25, 26, 27 18 34
Chemical products 28 67 171
Manufacturing 30, 32, 33, 34 61 74
Computer equipment and services 35, 73 592 367
Electronic equipment 36 215 319
Transportation 37, 39 41 95
Scientific instruments 38 200 239
Communications 48 9 15
Durable goods 50 49 57
Retail 53, 54, 56, 57, 59 149 147
Automotive dealers and services 55 11 6
Eating and drinking establishments 58 33 40
Entertainment services 70, 79 23 20
Health 80 23 25
All others 22, 29, 51, 52, 87, 99 67 67
B: Time Distribution of IPOs and SEOs
IPO IPO Cumulative SEO SEO Cumulative
Year Frequency Frequency Frequency Frequency
1970 5 5 8 8
1971 17 22 24 32
1972 46 68 23 55
1973 6 74 8 63
1974 0 74 4 67
1975 1 75 18 85
1976 11 86 32 117
1977 6 92 15 132
1978 2 94 31 163
1979 5 99 19 182
1980 19 118 65 247
1981 20 138 50 297
1982 14 152 40 337
1983 102 254 140 477
1984 27 281 23 500
1985 41 322 39 539
1986 69 391 52 591
1987 59 450 43 634
1988 20 470 17 651
1989 28 498 25 676
1990 16 514 23 699
1991 46 560 80 779
1992 81 641 65 844
1993 111 752 69 913
1994 74 826 56 969
1995 105 931 95 1,064
1996 156 1,087 106 1,170
1997 106 1,193 65 1,235
1998 53 1,246 33 1,268
1999 115 1,361 74 1,342
2000 133 1,494 86 1,428
2001 20 1,514 65 1,493
2002 15 1,529 64 1,557
2003 11 1,540 78 1,635
These statistics reveal that IPO firms tend to be smaller than SEO firms, as measured by total assets and market value. Specifically, the average SEO firm is almost eight times larger than the average IPO firm in terms of asset size. In addition, IPO firms experience larger sales growth in the year of the offering and have lower financial leverage and higher marketing intensity than SEO firms. Notably, whereas SEO firms, on average, experience a 41% growth in sales during the offering year, IPO firms report an aver-age sales growth of 111%. Given that the IPO and SEO samples consist of firms with significantly different charac-teristics, we test our first hypothesis separately for each group. However, we use a combined sample of two groups when testing H2because it compares the postoffering and nonoffering periods.
Measures
Stock returns. We measure changes in firm value using stock returns. Drawing from previous research (e.g., Cur-rim, Lim, and Kim 2012; Srinivasan, Lilien, and Sridhar 2011; Teoh, Welch, and Wong 1998a, b), we calculate the annual stock return for a given fiscal year following the offering by compounding the monthly stock returns for 12 months (starting with the first month of the fiscal year fol-lowing the IPO or SEO year). To control for the size and value risk (Fama and French 1993), we include lagged mar-ket value and book-to-marmar-ket ratio of issuers in our regres-sion analyses. Mizik and Jacobson (2003, 2008) and Mizik (2010) use a similar approach.5
Marketing expenditures. Following Mizik and Jacobson (2007) and Luo (2008), we use selling and general adminis-trative expenditures (SG&A; Compustat item XSGA) minus R&D expenditures (Compustat item XRD) scaled by lagged total assets (Compustat item AT) as a measure of the firm’s marketing expenditure intensity (MKT). We do not use advertising expenditure (also available on Compustat) as a measure of marketing intensity for two main reasons. First, under generally accepted accounting principles, com-panies are not required to disclose their advertising spend-ing in the income statement as a separate line item or in the notes to it, whereas this is not the case for SG&A and R&D. Thus, limiting our analysis to those firms with available advertising data would restrict our sample and potentially introduce selection bias. Second, the advertising expenditure item excludes several major marketing expenditures, such as salaries of the sales and marketing staff, sales commis-sions, and operating expenses of company-owned stores, which are a significant part of total marketing spending.6
Because the investors react only to unexpected informa-tion (Fama 1970, 1991), explanatory variables should reflect unanticipated changes. We calculate unexpected changes in marketing spending as deviations from industry forecasts using the cross-sectional model as implemented by Roychowdhury (2006), Cohen, Dey, and Lys (2008), and
5We do not use Fama–French (1993) three-factor or Carhart
(1997) four-factor models to calculate stock returns, because we have only 12 observations in each year with which to estimate these models for each firm. As Teoh, Welch, and Wong (1998a) state, 12 observations are too few to reliably estimate regression betas and alpha, with the latter representing the average monthly abnormal stock return for the firm. However, we test the robust-ness of our results by using the calendar-time portfolio approach with a four-factor model (Carhart 1997). The results are available upon request. We do not present these results in the article, because the calendar-time portfolio approach is intended to test market mispricing, which is not the goal of the present study.
6We acknowledge that our proxy for marketing expenditures
includes nonmarketing expenses such as administrative personnel salaries. However, we use the unexpected component of the mar-keting expenditure intensity (rather than its level) in our analysis. Thus, we believe that our measure captures mainly the unexpected increase in marketing spending because an abnormal increase in administrative personnel salaries or other similar items following the offering would not be expected (in particular not after control-ling for firm size).
TABLE 1 Continued
C: IPO Sample Size, Marketing Resources, and Financial Leverage Characteristics
Total Market Sales Marketing Financial
Assets Value Growth Intensity Leverage
M 121.96 332.16 1.106 .297 .115
SD 245.15 778.12 2.222 .199 .157
D: SEO Sample Size, Marketing Resources, and Financial Leverage Characteristics
Total Market Sales Marketing Financial
Assets Value Growth Intensity Leverage
M 888.08 949.41 .412 .223 .172
SD 2,273.80 2,100.21 .513 .156 .158
Cohen and Zarowin (2010) in the accounting literature.7
Following this estimation approach, the “normal” level of marketing expenditures can be expressed as a linear function of lagged sales (Compustat item SALE) and an asset-scaled constant (as shown in Equation 1). The intuition behind this approach is that within an industry, greater sales are associ-ated with greater marketing spending. Thus, variation in sales can account for a significant amount of variation in firms’ marketing intensity. This is consistent with recent studies that have used the change in a company’s sales as the sole factor in predicting the change in its marketing expenditures (e.g., Kim and McAlister 2011). A key advan-tage of our approach is that it holds economy- and industry-wide factors constant by estimating industry-level regres-sions separately for each year in the sample period. Furthermore, the model includes an asset-scaled constant to avoid a spurious correlation between scaled marketing expenditures and scaled sales due to variation in the scaling variable (i.e., total assets).
For each year, we estimate Equation 1 for every indus-try, classified according to its two-digit Standard Industrial Classification (SIC) code, by using all the firms (with avail-able data) in that industry. These estimations generate industry-specific betas that vary across time. We require at least ten observations for each industry-year grouping to obtain reliable estimates of the coefficients. Table 2 pre-sents the regression results averaged across all industry-year estimations. The average R-square is 33%, which sug-gests that this cross-sectional model has reasonable predictive power.
After we obtained the estimated coefficients for each industry-year group (bˆ0, bˆ1, bˆ2), we calculate the “normal” level of marketing expenditure (NMKT) for each firm as follows:
where our measure of unanticipated change in marketing expenditures is the difference between actual marketing expenditure in year t and the fitted normal marketing determining their companies’ marketing spending. How-ever, we try to forecast rather than explain issuers’ market-ing intensity. Thus, omitted variables do not pose a signifi-cant threat to the predictive ability of the model as long as they are correlated with the independent variables included in the model (for a detailed discussion about forecasting vs. explaining, see Mizik 2012; Mizik and Jacobson 2009). Given that our model has a respectable R-square (comparable with the 38% reported in Roychowdhury 2006), we believe we can measure the unexpected portion of issuers’ marketing expenditure intensity with a certain degree of confidence.
Strategic flexibility of rivals. Our proxy for flexibility is financial leverage. In line with previous studies (e.g., Gie-lens et al. 2008; Rego, Billett, and Morgan 2009), we define financial leverage as total debt [long-term debt (Compustat item DLTT) + debt in current liabilities (Compustat item DLC)], divided by total assets. To calculate relative strate-gic flexibility of rivals with respect to issuers, we follow the standardization approach Campello (2006) suggests. That is, we first calculate the mean leverage of the remaining companies in the same two-digit industry as issuers. Then, we calculate the difference between the leverage of the issuer and the mean leverage of rivals. However, Campello (2006) points out that it is the relative size of the difference rather than the absolute size that matters. Therefore, we divide the difference between the leverage of the issuer and the mean leverage of rivals by the standard deviation of leverage of all firms in an industry. As a result, we obtain our measure of rivals’ relative flexibility (RIVALFLEX). The standardization enables us to use the same metric across different industries. Positive values of RIVALFLEX indicate that rivals have greater strategic flexibility than issuers, whereas negative values indicate the opposite.
7Another way to obtain unanticipated changes in marketing
expenditure is to estimate a first-order autoregressive model where the dependent variable is MKTitand the independent variable is MKTi,t – 1. However, as Mizik (2010) suggests, estimating a first-order autoregressive model using panel data raises econometric issues. That is, in the presence of fixed effects, the estimated coefficient on MKTi,t – 1will be biased. She suggests that applying the Anderson and Hsiao (1982) procedure, which involves first-differencing demeaned variables and then using instruments for the first-differenced MKTt – 1measure, results in consistent estimates. However, this procedure requires using MKTt – 2and MKTt – 3to create an instrument for the first-differenced MKTt – 1. In the case of IPOs, we will not be able to apply this procedure in year +1 because accounting/marketing data for most of the IPO firms are not avail-able in Compustat for the years preceding the pre-IPO year. Thus, we prefer the cross-sectional estimation method, which is robust to the aforementioned problem and has reasonable predictive power.
TABLE 2
Parameters of the Cross-Sectional Regression Model Used to Estimate “Normal” Level of Marketing Expenditures as a Function of Lagged
Sales and Lagged Scaled Total Assets
DV = MKTt
Intercept Coefficient (t) .099* (26.08)
1/Assetst – 1 Coefficient (t) 2.765* (18.89)
Salest – 1/Assetst – 1 Coefficient (t) .129* (49.74)
R-square 32.99%
Number of industry-year groups 1,225
*p< .01.
Analysis and Results
IPOs/SEOs and Postoffering Marketing Expenditures
We first examine whether IPO and SEO firms significantly increase their marketing spending after an equity offering.8 In addition, we analyze whether they adopt a
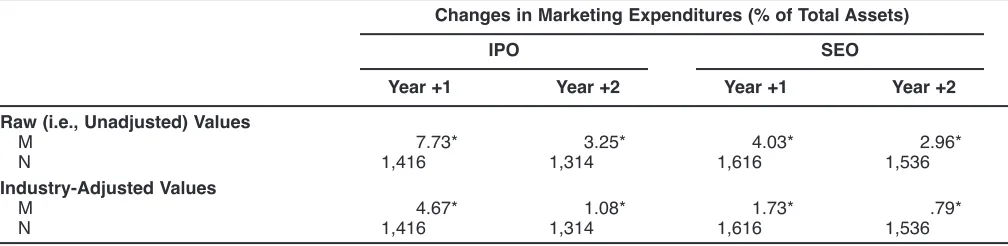
more aggressive marketing strategy than their rivals subse-quent to the offering. Thus, in Table 3 we report both raw (unadjusted) changes and industry-adjusted changes in the marketing expenditures of issuing firms. We determine raw changes by calculating the yearly difference in marketing expenditures and scaling it by total assets. To obtain indus-try-adjusted values, we first calculate the mean of the raw changes in marketing expenditures of rival firms and sub-tract it from the raw change in marketing expenditures of the issuer.9
The results show that both the IPO and SEO samples, on average, exhibit a significantly positive change in mar-keting expenditures in the two years following an offering. The raw changes for both groups are significant at the 1% level. However, the increase in marketing expenditures for the IPO firms is much higher than that for the SEO firms in year +1 (IPO: 7.73% vs. SEO: 4.02%, t = 11.79, p< .01). Both groups also significantly increase their marketing expenditures in year +2 (vs. the baseline year), but there is no difference between the two groups (IPO: 3.256% vs. SEO: 2.96%, t = .80, n.s.). Furthermore, industry-adjusted values for both samples are significantly positive at the 1% level in the two years following issue, indicating that issuers adopt a more aggressive marketing strategy than their rivals during those years. Again, the IPO firms exhibit
a larger industry-adjusted change than the SEO firms in year +1 (IPO: 4.678% vs. SEO: 1.73%, t = 9.70, p< .01) but not in year +2 (IPO: 1.08% vs. SEO: .79%, t = .85, n.s.). Overall, it seems that IPO and SEO firms typically allocate additional funds to marketing and follow a more aggressive strategy than their rivals in the two years following equity issue.10
Unanticipated Change in Marketing, Strategic Flexibility, and Firm Value
Although the preceding analysis shows that some of the capital raised from equity offerings is, on average, allocated to marketing, it does not confirm that such efforts have a positive impact on firm value, nor does it examine the mod-erating effect of strategic flexibility. To test H1, we estimate the following stock-return response model separately for our IPO and SEO samples by using ordinary least squares (OLS) with heteroskedasticity-robust standard errors clus-tered at the firm level:
(3) STRit= b0+ b1¥UMKTit+ b2¥RIVALFLEXit
+ b3¥UMKTit¥RIVALFLEXit+ b4¥UROAit + b5¥USalesit+ b6¥HHIit+ b7¥MRETit
+ b8¥BMit – 1+ b9¥MVit – 1+ Year Dummiesit + Industry Dummiesit(two-digit SIC) + it.
The dependent variable in this model is the annual stock return. We estimated the model separately for year +1 and year +2 following an offering because the number of firms entering the model differs for each year on the basis of the availability of stock return and marketing data. Specifically, in year +1 regressions, we regress the stock return calcu-lated for the fiscal year following the offering year on the
10We find that the industry-adjusted changes for both samples
are close to zero and nonsignificant in years +3 and +4 (IPO year +3: .13%, t = .44, n.s.; IPO year +4: .23%, t = .93, n.s.; SEO year +3: –.12%, t = –.84, n.s.; SEO year +4: .03%, t = .24, n.s.). These findings suggest that enhanced marketing expenditures by issuers are observed only for the two years immediately following an equity offering.
8Although IPOs and SEOs both involve issuance of equity, they
are two separate corporate financing events. Unlike SEO firms, IPO firms are private firms with no publicly traded stock before the offering. Therefore, key articles examining equity offerings analyze the two events separately (e.g., Chemmanur and Yan 2009; Loughran and Ritter 1995; Lyandres, Sun, and Zhang 2008). We follow this tradition.
9We Winsorized both raw and industry-adjusted changes at the
1st and 99th percentile levels to reduce the impact of outliers.
TABLE 3
Changes in Marketing Expenditures
Changes in Marketing Expenditures (% of Total Assets)
IPO SEO
Year +1 Year +2 Year +1 Year +2
Raw (i.e., Unadjusted) Values
M 7.73* 3.25* 4.03* 2.96*
N 1,416 1,314 1,616 1,536
Industry-Adjusted Values
M 4.67* 1.08* 1.73* .79*
N 1,416 1,314 1,616 1,536
*p< .01.
independent variables measured for the fiscal year following the offering year (except for book-to-market ratio [BM] and market value [MV], for which we use the lagged values as is done in prior studies). Similarly, in year +2 regressions, we regress the stock return calculated for the fiscal year fol-lowing the first postoffering fiscal year on the independent variables measured contemporaneously as well as lagged book-to-market ratio and market value. In addition, note that both UMKT and RIVALFLEX are mean-centered to facilitate the interpretation of the main effects (Aiken and West 1991). All variance inflation factor values are less than 3, suggesting that multicollinearity is not a problem (for the correlation matrix, see Table 4).
We use several control variables. Because previous research has shown that unanticipated changes in account-ing performance measures such as return on assets (ROA) and sales can predict stock returns (e.g., Kothari 2001), we include measures of both as control variables in our model. We calculate ROA by dividing income before extraordinary items (Compustat item IB) by total assets (e.g., Rego, Bil-let, and Morgan 2009). We then estimate the following first-order autoregressive model with firm fixed effects11:
(4) ROAit= b0+ b1ROAi, t – 1+ Firm Fixed Effects + Year Dummiesit+ it.
The model includes firm fixed effects because we esti-mate a pooled regression model using all firm-year obser-vations available for issuers included in each sample. By doing so, we try to avoid using biased coefficient estimates stemming from omitted firm-specific factors. We use the residuals from this model as the estimates of unanticipated change in ROA (UROA) of the issuing firm. Following Mizik and Jacobson (2008), we calculate unanticipated change in sales as USalesit= log(Salesit) – log(Salesit – 1). We also control for industry concentration. Drawing from prior studies (e.g., Luo, Homburg, and Wieseke 2010), we measure industry concentration using the Herfindahl– Hirschman Index (HHI), calculated using all Compustat firms with the available data. The index is defined as HHIj=
Sr
i = 1s2ij, where sijis the market share of firm i in industry j
(defined by two-digit SIC code). Thus, HHI ranges between 0 and 1. Lower HHI suggests that the industry is shared by many competitors, whereas higher HHI implies that it is concentrated in the hands of a small number of large firms. Furthermore, to control for the general market conditions, we include the compounded annual return for the market (MRET) using the Center for Research in Security Prices value-weighted index. Finally, we include lagged market value and book-to-market ratio to capture firm-specific size and value risk factors, respectively (Fama and French 1993). Market value is the natural log of end-of-year stock price (Compustat item PRCC_F) multiplied by number of
11We do not apply the Anderson and Hsiao (1982) approach as
Mizik (2010) suggests while estimating the first-order autoregres-sive regression because the three-year lagged ROA data required to apply the procedure in year +1 are not available for most of the IPO firms in Compustat. In addition, because we are not aware of a commonly used cross-sectional estimation method for ROA in the literature, the only option is to augment the first-order autoregres-sive model with firm fixed effects (Flannery and Rangan 2006).
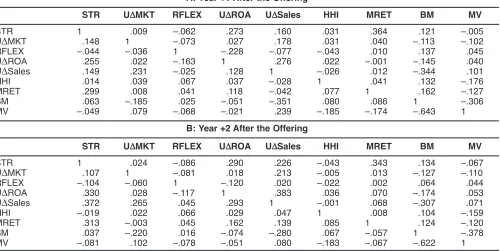
TABLE 4 Correlation Matrix
A: Year +1 After the Offering
STR UMKT RFLEX UROA USales HHI MRET BM MV
STR 1 .009 –.062 .273 .160 .031 .364 .121 –.005
UMKT .148 1 –.073 .027 .178 .031 .040 –.113 –.102
RFLEX –.044 –.036 1 –.228 –.077 –.043 .010 .137 .045
UROA .255 .022 –.163 1 .276 .022 –.001 –.145 .040
USales .149 .231 –.025 .128 1 –.026 .012 –.344 .101
HHI .014 .039 .067 .037 –.028 1 .041 .132 –.176
MRET .299 .008 .041 .118 –.042 .077 1 .162 –.127
BM .063 –.185 .025 –.051 –.351 .080 .086 1 –.306
MV –.049 .079 –.068 –.021 .239 –.185 –.174 –.643 1
B: Year +2 After the Offering
STR UMKT RFLEX UROA USales HHI MRET BM MV
STR 1 .024 –.086 .290 .226 –.043 .343 .134 –.067
UMKT .107 1 –.081 .018 .213 –.005 .013 –.127 –.110
RFLEX –.104 –.060 1 –.120 .020 –.022 .002 .064 .044
UROA .330 .028 –.117 1 .383 .036 .070 –.174 .053
USales .372 .265 .045 .293 1 –.001 .068 –.307 .071
HHI –.019 .022 .066 .029 .047 1 .008 .104 –.159
MRET .313 –.003 .045 .162 .139 .085 1 .124 –.120
BM .037 –.220 .016 –.074 –.280 .067 –.057 1 –.378
MV –.081 .102 –.078 –.051 .080 –.183 –.067 –.622 1
Notes: Correlation coefficients for the IPO (SEO) sample are reported below (above) the diagonal. In Panel A, for the IPO sample, greater than
shares outstanding (Compustat item CHSO). Book-to-market ratio is the natural log of book value of common stock (Compustat item CEQ) divided by market value. Note that to mitigate the impact of outliers, we Winsorized all the continuous variables entered into the model at the 1st and 99th percentile levels. Table 5 reports the results.12
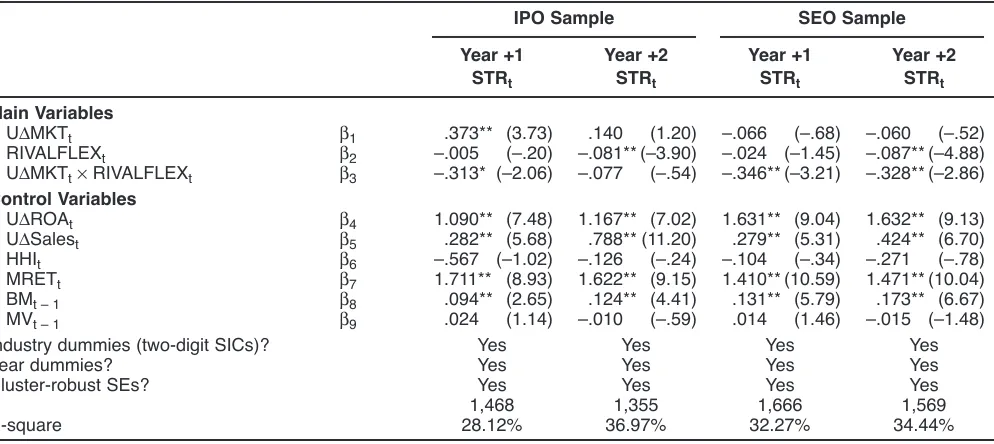
For IPO firms, there is a positive and significant effect of unanticipated marketing expenditure on stock returns for the year +1 (b1 = .373, p < .01). Furthermore, there is a negative and significant interaction between UMKT and RIVALFLEX (b3= –.313, p< .05), in support of H1. That is, the greater the rivals’ strategic flexibility, the lesser the positive impact of marketing on issuers’ firm value. Remember that we estimate these coefficients using mean-centered values (i.e., mean RIVALFLEX = 0) and that RIVALFLEX is a standardized measure. As a result, post hoc analysis reveals that when rivals’ strategic flexibility as compared with issuers is one unit lower, the impact of unanticipated change in marketing expenditures on firm value is almost doubled (bUMKT, Low RIVALFLEX= .687, t = 4.77, p< .01). In contrast, in the situations of rivals’ high flexibility by one unit of relative strategic flexibility, the
positive impact of increased marketing is canceled out (bUMKT, High RIVALFLEX = .060, t = .43, n.s.). In other words, an unanticipated increase in marketing expenditures in the year following an IPO results in higher firm value only for issuers facing rivals with limited strategic flexibil-ity. Although the results are qualitatively similar in year +2, neither the main effect of marketing (b1= .140, n.s.) nor the interaction effect is significant (b3= –.077, n.s.). This find-ing may largely be the result of the fact that IPO firms undertake large increases in marketing spending in year +1, as noted previously.
In contrast to IPO firms, the main effect of unantici-pated marketing for SEO firms is not significant in year +1 (b1 = –.066, n.s.). We also observed this result for year +2 (b1= –.060, n.s.). However, consistent with H1, there is a significant negative interaction between UMKT and RIVALFLEX in both year +1 (b3= –.346, p< .01) and year +2 (b3= –.328, p< .01). These results again suggest that the relative strategic flexibility of rivals with respect to issuers play an important role in determining the impact of market-ing on firm value durmarket-ing the period immediately followmarket-ing an SEO. Specifically, post hoc analyses reveal that when RIVALFLEX is one unit below (above) the mean, there is a positive (negative) link between unanticipated marketing expenditures and stock returns (Year +1: bUMKT,
LowRIVALFLEX = .280, t = 1.90, p < .10; bUMKT, HighRI-VALFLEX = –.411, t = –2.82, p < .01; Year +2: bUMKT, LowRIVALFLEX = .268, t = 1.65, p < .10; bUMKT, HighRI-VALFLEX= –.389, t = –2.31, p< .05). From these results, we
can conclude that the stock market reacts favorably when
TABLE 5
OLS Regressions of Stock Returns for Years +1 and +2 Following the Offering on Unanticipated Change in Marketing Expenditures, Strategic Flexibility, and Controls
IPO Sample SEO Sample
Year +1 Year +2 Year +1 Year +2
STRt STRt STRt STRt
Main Variables
UMKTt b1 .373** (3.73) .140 (1.20) –.066 (–.68) –.060 (–.52)
RIVALFLEXt b2 –.005 (–.20) –.081** (–3.90) –.024 (–1.45) –.087** (–4.88)
UMKTt¥RIVALFLEXt b3 –.313* (–2.06) –.077 (–.54) –.346** (–3.21) –.328** (–2.86)
Control Variables
UROAt b4 1.090** (7.48) 1.167** (7.02) 1.631** (9.04) 1.632** (9.13)
USalest b5 .282** (5.68) .788** (11.20) .279** (5.31) .424** (6.70)
HHIt b6 –.567 (–1.02) –.126 (–.24) –.104 (–.34) –.271 (–.78)
MRETt b7 1.711** (8.93) 1.622** (9.15) 1.410** (10.59) 1.471** (10.04)
BMt – 1 b8 .094** (2.65) .124** (4.41) .131** (5.79) .173** (6.67) MVt – 1 b9 .024 (1.14) –.010 (–.59) .014 (1.46) –.015 (–1.48)
Industry dummies (two-digit SICs)? Yes Yes Yes Yes
Year dummies? Yes Yes Yes Yes
Cluster-robust SEs? Yes Yes Yes Yes
N 1,468 1,355 1,666 1,569
R-square 28.12% 36.97% 32.27% 34.44%
*p< .05. **p< .01.
Notes: The dependent variable in each column is the annual stock returns. The independent variables are measured contemporaneously with stock returns, except BM and MV, for which we use lagged values. IPOSEO dummy equals 1 if a fiscal year corresponds to the first or second year following an equity offering and 0 otherwise. The first column presents the results estimated using OLS and robust stan-dard errors clustered at the firm level. The second column reports the results obtained using the Fama–MacBeth method and Newey– West correction for standard errors. To mitigate outlier effects, we Winsorized all the variables at the 1st and 99th percentile levels.
12We estimate the model separately for each of the two years
issuers facing relatively less flexible rivals increase their marketing efforts beyond anticipated levels following an SEO, whereas we observe the opposite effect (i.e., negative abnormal stock return) for issuers with relatively more flex-ible rivals.
It is worth noting that the main effect for the relative strategic flexibility of rivals is negative and significant in the second-year regressions for both IPOs and SEOs.13This
is consistent with the extensive body of literature that docu-ments that firms with higher financial leverage fail to respond to aggressive strategies initiated by their less lever-aged rivals and thereby experience poor operating and stock return performance. At first glance, this evidence may seem inconsistent with Modigliani and Miller’s (1958) proposi-tion that capital structure has no impact on firm value. However, this irrelevance proposition relies on a set of strong assumptions (e.g., that there are no taxes and infor-mation asymmetries). More relevant to our study, they assume that finance leverage does not affect the probability distribution of earnings (i.e., there are no risks associated with using debt). On the contrary, a significant number of studies have shown that this assumption does not hold, because assuming larger debt makes a company more vulnerable to competition.
Postoffering Period Versus Nonoffering Period
To test H2, we augment our main regression model (Equa-tion 4) with a new dummy variable (IPOSEO) that we allow to interact with UMKT and RIVALFLEX and use all the Compustat firm-year observations during 1970–2008 with available stock return, accounting, and marketing data.14By
combining our previous IPO and SEO data sets with the Compustat data, we are able to identify postoffering and nonoffering periods. IPOSEO is a dummy variable that is set equal to 1 for the two years immediately following any IPO or SEO issue and equal to 0 for all other periods.15
Although years +3, +4, and so on are technically part of the postoffering period, we define our postoffering event win-dow as year +1 and year +2. In addition, as we noted previ-ously, we find that the significant increase in industry-adjusted marketing expenditures of IPO and SEO firms shown for years +1 and +2 are not observed in years +3 and +4. Indeed, previous research (e.g., DeAngelo, DeAngelo,
and Stulz 2010) has shown that most SEO firms use a large amount of the cash raised through the offering in the year immediately following an offering. Thus, it seems reason-able to limit our attention to the two years after the offering and label this period the (immediate) postoffering period. The modified model includes the following variables:
(5) STRit= b0+ b1¥UMKTit+ b2¥RIVALFLEXit + b3¥IPOSEOit+ b4¥UMKTit¥RIVALFLEXit
+ b5¥UMKTit¥IPOSEOit + b6¥RIVALFLEXit¥IPOSEOit
+ b7¥UMKTit¥RIVALFLEXit¥IPOSEOit + b8¥UROAit+ b9¥USalesit+ b10¥HHIit
+ b11¥MRETit+ b12¥BMit – 1+ b13¥MVit – 1 + Year Dummiesit+ Industry Dummiesit(two-digit SIC)
+ it.
All the variables are as defined previously. We calculate annual stock returns (for each fiscal year) for all the firms on Compustat with available accounting and marketing data and regress them on contemporaneously measured indepen-dent variables, except BM and MV, for which we use the lagged values. That is, unlike Equation 3, the dependent variable is not just issuers’ postoffering stock returns; rather, we employ panel data with all the annual observa-tions available for an issuer. However, to distinguish the postoffering and nonoffering periods, we use the IPOSEO dummy, which turns on if a fiscal year corresponds to the first or second year following an equity offering. In addi-tion, the coefficient of interest to test our second hypothesis is b7. Finding a negative and significant coefficient on this three-way interaction term will provide support for our argument that the interactive influence of unanticipated marketing expenditures and relative strategic flexibility of rivals is more pronounced in the period immediately fol-lowing an IPO or SEO.
The final sample we use to estimate our model includes 58,236 firm-year observations. Because we have more than one yearly observation per firm in our pooled data set, we need to control for both cross-sectional correlation and ser-ial correlation across observations while estimating our OLS model. Otherwise, standard errors of the estimated coefficients will be biased. Clustering standard errors at the firm level has been shown to produce unbiased standard errors unless the number of observations in each cluster is too small (Petersen 2009). This should not be a concern for our sample because it covers a sufficiently long period of time (average number of observations per firm = 8.4). Fur-thermore, Petersen (2009) shows that the Fama– MacBeth (1973) method also generates unbiased standard errors in the absence of serial correlation. The Fama– MacBeth method involves estimating the OLS regression separately in each year and then calculating estimated coefficients/ standard errors on the basis of the time-series averages of parameters obtained from each yearly regression. Drawing on previous literature, we estimate our model by using both methods: cluster-robust standard errors (i.e., firm level) and
13Due to its significant main effect on stock returns as well,
relative strategic flexibility is more correctly referred to as a “quasi-moderator” than as a pure moderator (see Sharma, Durand, and Gur-Arie 1981).
14In the sample we used to test H
1, the last firm-year
observa-tion belongs to 2006 (i.e., year +2 for IPOs/SEOs issued in 2004). To test H2, we expanded our sample to include firm-year observa-tions through 2008. As a result, we have two additional years of observations (i.e., nonoffering period) for IPOs issued in 2004.
15In contrast to the previous section, we do not exclude those