UJI VALIDITAS DAN RELIABILIAS VARIABEL INSENTIF
Case Processing Summary
N %
Cases
Valid 30 100,0
Excludeda 0 ,0
Total 30 100,0
a. Listwise deletion based on all variables in the
procedure.
Reliability Statistics
Cronbach's
Alpha
N of Items
,887 4
Item Statistics
Mean Std. Deviation N
X1_1 3,57 ,971 30
X1_2 3,67 ,922 30
X1_3 3,60 1,037 30
Item-Total Statistics
Scale Mean if
Item Deleted
Scale Variance
if Item Deleted
Corrected
Item-Total
Correlation
Cronbach's
Alpha if Item
Deleted
X1_1 10,97 6,792 ,825 ,829
X1_2 10,87 7,223 ,774 ,849
X1_3 10,93 7,168 ,661 ,891
UJI VALIDITAS DAN RELIABILITAS VARIABEL MOTIVASI
Case Processing Summary
N %
Cases
Valid 30 100,0
Excludeda 0 ,0
Total 30 100,0
a. Listwise deletion based on all variables in the
procedure.
Reliability Statistics
Cronbach's
Alpha
N of Items
,946 8
Item Statistics
Mean Std. Deviation N
X2_1 3,70 ,837 30
X2_2 3,73 ,907 30
X2_3 3,73 ,907 30
X2_4 3,70 1,236 30
X2_5 3,73 ,740 30
X2_6 3,67 ,884 30
X2_7 3,93 ,828 30
Item-Total Statistics
Scale Mean if
Item Deleted
Scale Variance
if Item Deleted
Corrected
Item-Total
Correlation
Cronbach's
Alpha if Item
Deleted
X2_1 26,30 30,769 ,860 ,935
X2_2 26,27 30,754 ,782 ,939
X2_3 26,27 31,306 ,721 ,943
X2_4 26,30 26,493 ,898 ,934
X2_5 26,27 32,547 ,753 ,942
X2_6 26,33 30,920 ,788 ,939
X2_7 26,07 30,685 ,881 ,934
UJI VALIDITAS DAN RELIABILITA S VARIABEL DISIPLIN KERJA
Case Processing Summary
N %
Cases
Valid 30 100,0
Excludeda 0 ,0
Total 30 100,0
a. Listwise deletion based on all variables in the
procedure.
Reliability Statistics
Cronbach's
Alpha
N of Items
,930 8
Item Statistics
Mean Std. Deviation N
X3_1 3,83 ,834 30
X3_2 3,93 ,828 30
X3_3 4,00 1,114 30
X3_4 3,93 1,143 30
X3_5 4,00 1,145 30
X3_6 3,77 ,935 30
X3_7 3,90 ,885 30
Item-Total Statistics
Scale Mean if
Item Deleted
Scale Variance
if Item Deleted
Corrected
Item-Total
Correlation
Cronbach's
Alpha if Item
Deleted
X3_1 27,53 34,671 ,658 ,928
X3_2 27,43 33,840 ,758 ,922
X3_3 27,37 29,826 ,884 ,910
X3_4 27,43 29,909 ,849 ,914
X3_5 27,37 30,102 ,829 ,915
X3_6 27,60 34,041 ,633 ,930
X3_7 27,47 33,223 ,767 ,921
UJI VALIDITAS DAN RELIABILITAS VARIABEL PENGEMBANGAN
KARIER
Case Processing Summary
N %
Cases
Valid 30 100,0
Excludeda 0 ,0
Total 30 100,0
a. Listwise deletion based on all variables in the
procedure.
Reliability Statistics
Cronbach's
Alpha
N of Items
,937 8
Item Statistics
Mean Std. Deviation N
X4_1 3,83 ,699 30
X4_2 3,80 ,805 30
X4_3 3,83 ,699 30
X4_4 3,80 ,997 30
X4_5 3,87 ,776 30
X4_6 3,73 1,112 30
X4_7 3,73 ,740 30
Item-Total Statistics
Scale Mean if
Item Deleted
Scale Variance
if Item Deleted
Corrected
Item-Total
Correlation
Cronbach's
Alpha if Item
Deleted
X4_1 26,43 26,599 ,700 ,934
X4_2 26,47 25,292 ,765 ,930
X4_3 26,43 26,254 ,753 ,931
X4_4 26,47 22,947 ,858 ,923
X4_5 26,40 24,800 ,871 ,923
X4_6 26,53 21,430 ,919 ,919
X4_7 26,53 25,361 ,836 ,926
UJI VALIDITAS DAN RELIABILITAS VARIABEL KINERJA PEGAWAI
Case Processing Summary
N %
Cases
Valid 30 100,0
Excludeda 0 ,0
Total 30 100,0
a. Listwise deletion based on all variables in the procedure.
Reliability Statistics
Cronbach's Alpha
N of Items
,909 10
Item Statistics
Mean Std. Deviation N
Y_1 3,87 ,507 30
Item-Total Statistics
Scale Mean if Item Deleted
Scale Variance if Item Deleted
Corrected Item-Total Correlation
Cronbach's
Alpha if Item
Deleted
Y_1 34,83 29,247 ,607 ,905
Y_2 34,87 29,085 ,533 ,908
Y_3 34,80 25,752 ,743 ,896
Y_4 34,77 25,289 ,737 ,896
Y_5 34,93 25,651 ,702 ,899
Y_6 34,80 27,752 ,525 ,909
Y_7 34,77 26,599 ,746 ,896
Y_8 34,90 26,645 ,667 ,901
Y_9 34,77 26,254 ,796 ,893
LAMPIRAN 4
Descriptive Statistics
Mean Std. Deviation N
Kinerja Karyawan 38,41 6,238 94
Insentif 14,06 2,651 94
Motivasi 29,53 6,131 94
Disiplin Kerja 30,51 6,387 94
Pengembangan Karir 29,68 6,165 94
Variables Entered/Removeda
Model Variables Entered Variables Removed
Method
1
Pengembangan Karir, Insentif, Disiplin Kerja, Motivasib
. Enter
a. Dependent Variable: Kinerja Karyawan
b. All requested variables entered.
Model Summary
Model R R Square Adjusted R Square
Std. Error of the Estimate
1 ,895a ,801 ,792 2,846
ANOVAa
Model Sum of Squares df Mean Square F Sig.
1
Regression 2897,853 4 724,463 89,432 ,000b
Residual 720,966 89 8,101
Total 3618,819 93
a. Dependent Variable: Kinerja Karyawan
b. Predictors: (Constant), Pengembangan Karir, Insentif, Disiplin Kerja, Motivasi
Coefficientsa
Model Unstandardized Coefficients Standardized Coefficients
t Sig.
B Std. Error Beta
1
(Constant) 8,004 1,677 4,772 ,000
Insentif ,500 ,187 ,213 2,682 ,009
Motivasi ,223 ,098 ,219 2,269 ,026
Disiplin Kerja ,334 ,080 ,342 4,184 ,000
Pengembangan Karir ,222 ,083 ,219 2,676 ,009
Cuplikan Tabel Distribusi t
0
No
10%
5%
2,5%
71
1.294
1.667
1.994
72
1.293
1.666
1.993
73
1.293
1.666
1.993
74
1.293
1.666
1.993
75
1.293
1.665
1.992
76
1.293
1.665
1.992
77
1.293
1.665
1.991
78
1.292
1.665
1.991
79
1.292
1.664
1.990
80
1.292
1.664
1.990
81
1.292
1.664
1.990
82
1.292
1.664
1.989
83
1.292
1.663
1.989
84
1.292
1.663
1.989
85
1.292
1.663
1.988
86
1.291
1.663
1.988
87
1.291
1.663
1.988
88
1.291
1.662
1.987
89
1.291
1.662
1.987
90
1.291
1.662
1.987
91
1.291
1.662
1.986
92
1.291
1.662
1.986
93
1.291
1.661
1.986
94
1.291
1.661
1.986
95
1.291
1.661
1.985
96
1.290
1.661
1.985
97
1.290
1.661
1.985
98
1.290
1.661
1.984
99
1.290
1.660
1.984
Cuplikan Tabel Distribusi f
0
df
1
2
3
4
5
6
7
8
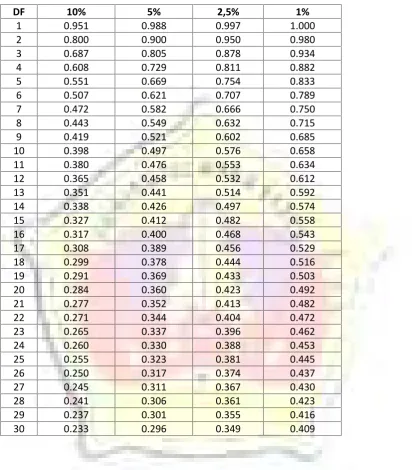
TABEL R
DF
10%
5%
2,5%
1%
1
0.951
0.988
0.997
1.000
2
0.800
0.900
0.950
0.980
3
0.687
0.805
0.878
0.934
4
0.608
0.729
0.811
0.882
5
0.551
0.669
0.754
0.833
6
0.507
0.621
0.707
0.789
7
0.472
0.582
0.666
0.750
8
0.443
0.549
0.632
0.715
9
0.419
0.521
0.602
0.685
10
0.398
0.497
0.576
0.658
11
0.380
0.476
0.553
0.634
12
0.365
0.458
0.532
0.612
13
0.351
0.441
0.514
0.592
14
0.338
0.426
0.497
0.574
15
0.327
0.412
0.482
0.558
16
0.317
0.400
0.468
0.543
17
0.308
0.389
0.456
0.529
18
0.299
0.378
0.444
0.516
19
0.291
0.369
0.433
0.503
20
0.284
0.360
0.423
0.492
21
0.277
0.352
0.413
0.482
22
0.271
0.344
0.404
0.472
23
0.265
0.337
0.396
0.462
24
0.260
0.330
0.388
0.453
25
0.255
0.323
0.381
0.445
26
0.250
0.317
0.374
0.437
27
0.245
0.311
0.367
0.430
28
0.241
0.306
0.361
0.423
29
0.237
0.301
0.355
0.416
Frekuensi Identitas Responden
Statistics
Jenis_Kelamin Umur Pendidikan_Tera
khir
N
Valid 94 94 94
Missing 0 0 0
Frequency Table
Jenis_Kelamin
Frequency Percent Valid Percent Cumulative Percent
Valid
Pria 60 63,8 63,8 63,8
Wanita 34 36,2 36,2 100,0
Total 94 100,0 100,0
Umur
Frequency Percent Valid Percent Cumulative Percent
28,00 15 16,0 16,0 26,6
29,00 8 8,5 8,5 35,1
30,00 10 10,6 10,6 45,7
31,00 4 4,3 4,3 50,0
32,00 11 11,7 11,7 61,7
33,00 1 1,1 1,1 62,8
Pendidikan_Terakhir
Frequency Percent Valid Percent Cumulative Percent
Valid
SLTA 32 34,0 34,0 34,0
D3 24 25,5 25,5 59,6
S1 37 39,4 39,4 98,9
S2 1 1,1 1,1 100,0
Frekuensi Insentif
Statistics
X1_1 X1_2 X1_3 X1_4 Insentif
N Valid 94 94 94 94 94
Missing 0 0 0 0 0
Mean 3,63 3,64 3,10 3,70 14,06
Median 4,00 4,00 3,00 4,00 15,00
Mode 4 4 3 4 15
Sum 341 342 291 348 1322
Frequency Table
X1_1
Frequency Percent Valid Percent Cumulative Percent
Total 94 100,0 100,0
X1_2
Frequency Percent Valid Percent Cumulative Percent
X1_3
Frequency Percent Valid Percent Cumulative Percent
Total 94 100,0 100,0
X1_4
Frequency Percent Valid Percent Cumulative Percent
Total 94 100,0 100,0
Insentif
Frequency Percent Valid Percent Cumulative Percent
Frekuensi Variabel Motivasi
Statistics
N Mean Median Mode Sum
Valid Missing
X2_1 94 0 3,67 4,00 4 345
Motivasi 94 0 29,53 31,00 32 2776
Frequency Table
X2_1
Frequency Percent Valid Percent Cumulative Percent
Total 94 100,0 100,0
X2_2
Frequency Percent Valid Percent Cumulative Percent
X2_3
Frequency Percent Valid Percent Cumulative Percent
Total 94 100,0 100,0
X2_4
Frequency Percent Valid Percent Cumulative Percent
Total 94 100,0 100,0
X2_5
Frequency Percent Valid Percent Cumulative Percent
Total 94 100,0 100,0
X2_6
Frequency Percent Valid Percent Cumulative Percent
X2_7
Frequency Percent Valid Percent Cumulative Percent
Total 94 100,0 100,0
X2_8
Frequency Percent Valid Percent Cumulative Percent
Total 94 100,0 100,0
Motivasi
32 10 10,6 10,6 66,0
33 2 2,1 2,1 68,1
34 2 2,1 2,1 70,2
35 9 9,6 9,6 79,8
36 9 9,6 9,6 89,4
37 6 6,4 6,4 95,7
38 2 2,1 2,1 97,9
39 2 2,1 2,1 100,0
Frekuensi Variabel Disiplin Kerja
Statistics
N Mean Median Mode Sum
Valid Missing
X3_1 94 0 3,66 4,00 4 344
Disiplin Kerja 94 0 30,51 32,00 36 2868
Frequency Table
X3_1
Frequency Percent Valid Percent Cumulative Percent
Total 94 100,0 100,0
X3_2
Frequency Percent Valid Percent Cumulative Percent
X3_3
Frequency Percent Valid Percent Cumulative Percent
Total 94 100,0 100,0
X3_4
Frequency Percent Valid Percent Cumulative Percent
Total 94 100,0 100,0
X3_5
Frequency Percent Valid Percent Cumulative Percent
X3_6
Frequency Percent Valid Percent Cumulative Percent
Total 94 100,0 100,0
X3_7
Frequency Percent Valid Percent Cumulative Percent
Total 94 100,0 100,0
X3_8
Frequency Percent Valid Percent Cumulative Percent
Total 94 100,0 100,0
Disiplin Kerja
23 4 4,3 4,3 17,0
24 5 5,3 5,3 22,3
25 1 1,1 1,1 23,4
26 6 6,4 6,4 29,8
27 1 1,1 1,1 30,9
28 3 3,2 3,2 34,0
29 3 3,2 3,2 37,2
30 3 3,2 3,2 40,4
31 7 7,4 7,4 47,9
32 5 5,3 5,3 53,2
33 3 3,2 3,2 56,4
34 8 8,5 8,5 64,9
35 4 4,3 4,3 69,1
36 14 14,9 14,9 84,0
37 6 6,4 6,4 90,4
38 4 4,3 4,3 94,7
39 5 5,3 5,3 100,0
Frekuensi Variabel Pengembangan Karier
Statistics
N Mean Median Mode Sum
Valid Missing
X4_1 94 0 3,74 4,00 4 352
Pengembangan Karir 94 0 29,68 31,00 32 2790
Frequency Table
X4_1
Frequency Percent Valid Percent Cumulative Percent
Total 94 100,0 100,0
X4_2
Frequency Percent Valid Percent Cumulative Percent
X4_3
Frequency Percent Valid Percent Cumulative Percent
Total 94 100,0 100,0
X4_4
Frequency Percent Valid Percent Cumulative Percent
Total 94 100,0 100,0
X4_5
Frequency Percent Valid Percent Cumulative Percent
Total 94 100,0 100,0
X4_6
Frequency Percent Valid Percent Cumulative Percent
X4_7
Frequency Percent Valid Percent Cumulative Percent
Total 94 100,0 100,0
X4_8
Frequency Percent Valid Percent Cumulative Percent
Total 94 100,0 100,0
Pengembangan Karir
33 3 3,2 3,2 71,3
34 4 4,3 4,3 75,5
35 4 4,3 4,3 79,8
36 5 5,3 5,3 85,1
37 9 9,6 9,6 94,7
38 4 4,3 4,3 98,9
39 1 1,1 1,1 100,0
Frekuensi Variabel Pengembangan Kinerja
Statistics
N Mean Median Mode Sum
Valid Missing
Y_1 94 0 3,74 4,00 4 352
Kinerja Karyawan 94 0 38,41 40,00 40a 3611
a. Multiple modes exist. The smallest value is shown
Frequency Table
Y_1
Frequency Percent Valid Percent Cumulative Percent
Total 94 100,0 100,0
Y_2
Frequency Percent Valid Percent Cumulative Percent
Y_3
Frequency Percent Valid Percent Cumulative Percent
Total 94 100,0 100,0
Y_4
Frequency Percent Valid Percent Cumulative Percent
Total 94 100,0 100,0
Y_5
Frequency Percent Valid Percent Cumulative Percent
Y_6
Frequency Percent Valid Percent Cumulative Percent
Total 94 100,0 100,0
Y_7
Frequency Percent Valid Percent Cumulative Percent
Total 94 100,0 100,0
Y_8
Frequency Percent Valid Percent Cumulative Percent
Total 94 100,0 100,0
Y_9
Frequency Percent Valid Percent Cumulative Percent
Y_10
Frequency Percent Valid Percent Cumulative Percent
Total 94 100,0 100,0
Kinerja Karyawan
Frequency Percent Valid Percent Cumulative Percent