P-ISSN: 2087-1228 E-ISSN: 2476-9053 Binus Business Review, 7(3), November 2016, 241-245
DOI: 10.21512/bbr.v7i3.1783
IMPACT IN CHANGING PRICE FRACTION TO THE STOCK
TRADING INDICATORS IN INDONESIA STOCK EXCHANGE
Natalia
1; Mulyono
2; Dian Kurnianingrum
31,2,3 Management Department, School of Business Management, Bina Nusantara University Jln. K.H. Syahdan No 9, Jakarta Barat, DKI Jakarta, 11480, Indonesia
1natalia@binus.edu; 2mulyono@binus.ac.id; 3dian_k@binus.ac.id
Received: 27th May 2016/ Revised: 2nd September 2016/ Accepted: 5th September 2016
How to Cite: Natalia, Mulyono, & Kurnianingrum, D. (2016). Impact in Changing Price Fraction to the Stock Trading Indicators in Indonesia Stock Exchange. Binus Business Review, 7(3), 241-245.
http://dx.doi.org/10.21512/bbr.v7i3.1783
ABSTRACT
The purpose of this study was to determine how the impact of changes the price fraction to the stock trading indicator that is volume, value, and frequency of trading transactions. Data were analyzed using the Mann-Whitney
U test. The results show that the volume of stock trading is not affected significantly by the implementation of the tick size, whereas for the value of trade and frequency of trade significantly affected.
Keywords: Indonesia Stock Exchange, fraction of stock price, trading volume, value of stock trading, stock trading frequencies
INTRODUCTION
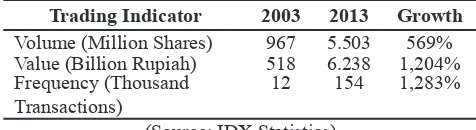
As one of the emerging stock exchanges, trading at the Indonesia Stock Exchange (IDX) is increasing very rapidly. This can be seen from the indicators growth such as stock trading volume, value, and frequency of trading in 2003 through 2013, as seen in Table 1.
Table 1 Growth Value Average Stock Day Trading
Trading Indicator 2003 2013 Growth
Volume (Million Shares) 967 5.503 569% Value (Billion Rupiah) 518 6.238 1,204% Frequency (Thousand
Transactions)
12 154 1,283%
(Source: IDX Statistics)
Stock trading rules are needed to ensure
the market to be fair and efficient. One of the
implementation rules was the price fraction or tick
size. On January 6th, 2014, Indonesia Stock Exchange
implemented new regulations related to the fraction of
the price, which fraction of the price applied by the price category.
When transacting shares in the capital market, it takes a minimum size in determining stock prices, for example, to make an offer to buy or sell shares at a price of Rp100,00. By using a minimum size Rp1,00, an investor may only bargain a stock price in amount of multiplication, such as Rp99,00, Rp100,00, Rp101,00, and so on. The minimum size in stock transaction known as price fraction or tick size.
The Indonesia Stock Exchange rules Number II-A of the Securities Trading Equity provides a
definition of the price fraction that is the unit price
There are several studies on the price fraction impact on the stock exchange, such as Chang (2014) who conducted a study on the impact of minimum tick size on liquidity on the New Zealand stock exchange, the empirical study results show that the trade volume correlates very positive between spreads proportion with the minimum size of price fractions.
Reduction changes of price fraction gives effect to the stock trading, it is described in several studies, e.g., Porter and Weaver (1997) analyzed the impact of size reducing of the minimum price fraction on the
market quality, internalization, and member benefits
using transactional database shares listed on the Stock Exchange Toronto (TSE). This study found that the cost of execution declined to stocks with low price and high volume, and the results also recorded a decrease in the market depth. The study also found that reducing the size of price fraction having a minimum impact
on the internalization and member benefits, except generating higher profits and commissions.
Furthermore, Goldstein and Kavajecz (2000) investigated the impact of size reducing of the minimum price fraction on trading liquidity on the New York Stock Exchange (NYSE), the faction size reduction takes effect in spread and depth of the market decreased after price fraction change from one-eighths dollars to one-sixteenths dollars, the market depth decrease so does the entire limit order book.
Chien, Liao, and Lee (2014) examined the impact of size reduction price fraction on the content of order book information using data from the Taiwan Stock Exchange (TWSE). The empirical results indicate that the limit order book is informative. Furthermore, the results indicate that size reduction of price fraction will reduce the information content of an order book and positively associated with depletion order on the order book.
Wu, Krehbiel, and Brorsen (2011) conducted a study that examines the impact of price fraction size changes of the transaction costs of different trade size. Using samples taken from stocks with high and low prices with high and low volume on price fractional change in 1997 and 2001 at the New York Stock Exchange. For the stock with high price but low volume of 1997 fraction changes from the price of one-eighth dollars into the price of one-sixteenth dollar, increase effective transactions spread even to the smallest size transaction, but the effect of price fraction reduction in 2001 was largely positive for the stock at a high price with low volume but were not
statistically significant.
Hameed and Terry (1998) examined the impact of size price fraction on the group of price and trading volume when minimum price changes vary with the price level. The study found that the smaller trade prices fraction tend to sharpen the price grouping. Also, the reduction in the price fraction size is more likely to increase trade volume if the shares are often traded.
Furthermore, Anderson and Peng (2013) examined the price fraction change to liquidity on the
New Zealand Stock Exchange. The effects of price fraction size changes is not consistent across company,
a small company does not benefit from the same
liquidity as large enterprises, with small companies
has decreased significantly the volume and value of
trading.
Satiari (2009) conducted research on differences of the stock price fraction system on the variable bid-ask spread, depth, and trade volume in the companies listed on the Indonesia Stock Exchange. The results
of this study revealed a significant difference to the
bid- ask spread, depth and trading volume since the announcement of the new system is the stock price fraction.
Based those explanations above, there is a question of how the impact of price fraction changes which a set on January 6th, 2014, as the indicators of
stock trading, the volume, value, and frequency of trading. Thus researchers compiled a study entitled “Impact of changing price fraction to the stock trading indicators in Indonesia Stock Exchange.” This study uses a volume variable, value and stock trading transactions frequency that are affected by implementation of the price fraction.
Based on the explanation given in the introduction, the problems found in this study is whether this change in the price fraction resulted from
a significant change in volume, value, and frequency
of trading stock on the Indonesia
Stock Exchange.
The objectives to be achieved in this study, are as follows: (1) To determine how the impact of price fraction changes to trading volume transaction on the Indonesia Stock Exchange. (2) To determine how the impact of price fraction changes to trading value transaction on the Indonesia Stock Exchange. (3) To determine how the impact of price fraction changes to trading frequency transaction on the Indonesia Stock Exchange.This research is expected to be useful for academics and capital markets practition, for academics to be a reference for research related to the price fraction application, while for the practitioner to be a reference in investing capital market with regard to the implementation of new price fraction.
This research is a events study to see the market reaction as measured by volume of stock trading, transaction value and frequency of stock trading for their announcement of the stock price fraction changes. The events study describes of empirical research
technique that allows financial analysts assess the
effect of certain events on stock prices of companies (Bodie, Kane, & Marcus, 2009). In this article, the stock price movement is represented by indicators of stock trading.
Efficient capital markets are defined as those in which the price of all securities quickly and fully reflect
all relevant information available (Jones, 2010). The
reflect all available information at the time when the last record price. (2) Semi-strong form efficiency is a situation where the prices not only reflect the past
prices, but all of the information published. (3) Strong
form efficiency is a situation where the prices reflect
not only all published information but also information that can be gained from fundamental analysis of the company and the economy.
Furthermore, Sunariyah (2011) stated that the
characteristics of an efficient capital market in general are: (1) The share price will reflect quickly and
accurately to all forms of new information. (2) Stock prices are random, so the price did not follow some of
the trends and past information. (3) Profitable stocks
are not easy to predict.
Information which is available in the capital markets may also be asymmetric information owned by investors and management. The thinking is a potential investor security have less information than the management, and the management tends to issue securities at the time of knowledge about the market value of the company is higher than that possessed by management. Information is a factor that gives meaning to the recipient, especially in terms of decision-making. Information is needed to determine the condition of a company that has been selling securities and the behavior of the company’s securities on the market. There are three main types of information needs to be known by the brokerage, securities traders and investors (Usman et al., 1994).
The first type is fundamental information. In
connection with the company, the general conditions of the same industry, and other factors that can affect the condition and prospects of the company in the future, such as changes in government regulations and so on. Second, information related to technical factors. This
information reflects the condition of securities trading, exchange rate fluctuations, the volume of transactions
and so on. Such information is crucial for investors to determine when a stock should be bought, sold or exchanged for other securities to obtain the maximum
benefit. The third type is information related to
environmental factors. Covers the economic, political and security. This information needs to be known by investors and securities trading brokers because such information could affect company’s prospects and the development of trade effects, both fundamentally and technically.
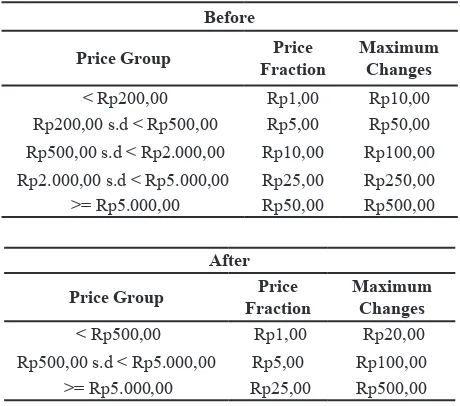
Based on the Indonesia Stock Exchange Rule Number II-A of the Securities Trading Equity, the price fraction is the unit price changes used in performing
selling or buying demand. On January 6, 2014,
Indonesia Stock Exchange announced the adoption fraction of the new price, which fraction of the price applied to the price category as shown in Table 2.
Table 2 Stock Price Fraction Changes
Before
Price Group Price
Fraction
Maximum Changes
< Rp200,00 Rp1,00 Rp10,00 Rp200,00 s.d < Rp500,00 Rp5,00 Rp50,00
Rp500,00 s.d < Rp2.000,00 Rp10,00 Rp100,00
Rp2.000,00 s.d < Rp5.000,00 Rp25,00 Rp250,00 >= Rp5.000,00 Rp50,00 Rp500,00
After
Price Group Price
Fraction
Maximum Changes
< Rp500,00 Rp1,00 Rp20,00 Rp500,00 s.d < Rp5.000,00 Rp5,00 Rp100,00 >= Rp5.000,00 Rp25,00 Rp500,00
(Source: Indonesia Stock Exchange)
Maximum change is the maximum multiple of the price change, instead of the maximum daily
price movement limits. The benefits obtained by the
market of the fractional change are as follows: (1) More alternative pricing options that can be traded. (2) Reduce queues orders and increase the potential transaction. (3) Make it easy for investors to manage risk. (4) The movement of stock prices becomes more
refined. (5) Increase market depth and minimize
market impact.
According to Sekaran and Bougie (2013), hypothesis is logically expected the relationship between two or more variables are expressed in the form of a statement that can be tested. The relationship is expected based on the network of associations set out in the theoretical framework formulated for research studies. Thus the hypothesis proposed in this research are as follows:
H1: There is a significant effect of price fraction changes to the stock trading volume in the Indonesia Stock Exchange.
H2: There is a significant effect of price fraction changes to the stock trading value on the Indonesia Stock Exchange.
H3: There is a significant effect of price fraction changes to stock trading frequency in the Indonesian Stock Exchange.
Figure 1 Two-tailed Test Curve for Hypothesis
Testing the hypothesis using SPSS version 20
is done by using the numbers of significance. The decision obtained using the criteria of significance if
the number of research results < 0,05 then the H1, H2, and H3 received.
METHODS
The population in this study is data volume, value, and frequency of trading on the Indonesia Stock Exchange, during the 30 days before and 30 days after the implementation of the trading exchanges fraction of the new price stock exchange trading, which as of November 2013 to February 2014. Date of start enactment fraction of the new price is January 6th
2014. The data used is secondary data obtained from the Indonesia Stock Exchange and Indonesian Capital Market Electronic Library (ICaMEL).
Before performing the hypothesis test, normality test should be performed. Kolmogorov - Smirnov method is used to determine whether the distribution
of data is normal or not. If the significance value (Sig.)
or a probability value is < 0,05, then the distribution
is not normal. On the other hand, if the significance
value (Sig.) or a probability value is > 0,05, then the distribution is normal.
To find out whether there are differences
between the two groups of data are unrelated
(independent), then the classification of group is tested
with the Mann-Whitney U test. Group 1 is the data volume, value and frequency of trading prior to the implementation of the fraction of the new price. Group 2 is a data volume, value and frequency of trading after the implementation of the fraction of the new price.
Basis for a decision to use the significant value:
If the probability > 0,05, H0 is accepted that the two
groups did not differ significantly. If the probability
< 0,05, H0 is rejected that the two groups differed
significantly.
RESULTS AND DISCUSSIONS
To analyze the data in the data processing performed using SPSS software version 20, the process output subject of the analysis to formulate the results and recommendations of the study. Prior to test
hypotheses, the first step is to do the normality test to
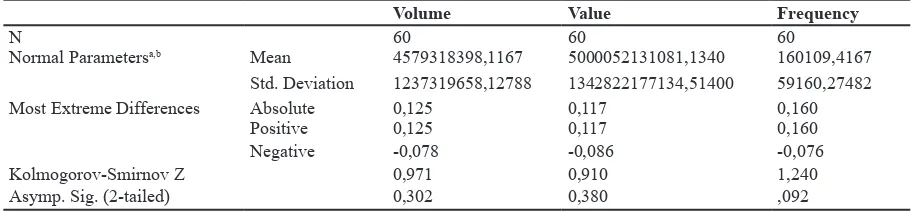
ensure the data of volume, value and trades frequency, period of before and after the implementation of new price fraction with normally distributed. Normality test results using the Kolmogorov-Smirnov method are as shown in Table 3.
Table 3 shows the data volume of trade has a
normal distribution, with significant value 0,302 >
0,05. Transaction value also has a normal distribution
with significant value 0,380 > 0,05. The same thing
happens to the data frequency trading also normal
distribution with a significance value of 0,092 > 0,05.
Having in mind that all data have normal distribution, then the next hypothesis test to determine whether there are differences between the three indicators before and after implementation of the new stock price fraction. Based on the results of data processing with SPSS version 20, the results are as shown in Table 4.
The results if the data use Mann - Whitney U
demonstrate the significant value or Asymp. Sig. (2
- tailed) for share trading volume was 0,337 > 0,05.
Thus indicators reflected by the stock trading volume stock trading does not have a significant difference
before and after the implementation of the new stock price fraction.
Asymp significance or value. Sig. (2 - tailed) for
share trading value was 0,029 < 0,05. Thus indicators
of stock trading, as reflected by the value of stock trading has a significant difference before and after the
implementation of the new stock price fraction.
Asymp significance or value. Sig. (2 - tailed)
for share trading frequency is 0,000 < 0,05. Thus
indicators stock trading reflected by frequency trading has a significant difference before and after the
implementation of the new stock price fraction.
α = 2,5% Reception Area α = 2,5% 95%
Reception Area
Table 3 Normality Test Result One-Sample Kolmogorov-Smirnov Test
Volume Value Frequency
N 60 60 60
Normal Parametersa,b Mean 4579318398,1167 5000052131081,1340 160109,4167 Std. Deviation 1237319658,12788 1342822177134,51400 59160,27482 Most Extreme Differences Absolute 0,125 0,117 0,160
Positive 0,125 0,117 0,160
Negative -0,078 -0,086 -0,076
Kolmogorov-Smirnov Z 0,971 0,910 1,240
Asymp. Sig. (2-tailed) 0,302 0,380 ,092
CONCLUSIONS
It could be concluded that the application of the
fraction of the price does not significantly affect the
volume of stock trading; it provides an overview of the application of the new price fraction is not an impact on the number of shares traded. Implementation of
the stock price fraction significantly affect the stocks trading value and shares trading frequency; it reflects
the change in the amount of funds transacted and the number transactions performed by capital markets investor concerning a change in the stock price fraction. Further research may use a variable volume, value and frequency of trades are calculated based on the activity of foreign investors, but it can also examined other variables such as the Composite Stock Price Index.
REFERENCES
Anderson, H. D., & Peng, Y. (2013). From cents to half-cents and its Impact on liquidity. Research Paper School of Economics and Finance. doi:10.2139/ ssrn.2229025.
Bodie, Z., Kane, A., & Marcus, A. J. (2009). Investments (8th ed.). International edition, McGraw-Hill Education (Asia).
Bursa Efek Indonesia. IDX Statistic. Various Edition. Bursa Efek Indonesia. Peraturan Nomor II-A tentang
perdagangan efek bersifat ekuitas. Keputusan Direksi BEI Nomor Kep-00071/BEI/11-2013.
Chang, M. (2014). The impact of minimum tick size on the liquidity of the New Zealand stock market: A dissertation submitted to Auckland University of Technology in partial fulfilment of the requirements for the degree of Master of Business (MBus), 2014.
Chien, C., Liao, T., & Lee, H. (2014). The information
content of the thinner order book following tick size reduction. Managerial Finance, 40(3), 218-233. doi:10.1108/mf-11-2012-0238
Goldstein, M. A., & A. Kavajecz, K. (2000). Eighths, sixteenths, and market depth: Changes in tick size and liquidity provision on the NYSE. Journal of Financial Economics, 56(1), 125-149. doi:10.1016/ s0304-405x(99)00061-6.
Hameed, A., & Terry, E. (1998). The effect of tick size on price clustering and trading volume. J Bus Fin & Acc, 25(7&8), 849-867. doi:10.1111/1468-5957.00216.
Husnan, S. (2001). Dasar – dasar teori portofolio dan analisis sekuritas (3rd ed.). Yogyakarta: UPP AMP YKPN.
Jones, C. P. (2010). Investments: principles and concepts. Asia: John Wiley & Sons.
Porter, D. C., & Weaver, D. G. (1997). Tick size and market quality. Financial Management, 26(4), 5. doi:10.2307/3666124.
Satiari, F. (2009). Analisis perbedaan sistem fraksi harga saham terhadap variabel bid-ask Spread, depth, dan volume perdagangan (Studi pada fraksi harga Rp.10, Rp.25, Rp.50 di Bursa Efek Indonesia). Thesis. Universitas Diponegoro. Semarang.
Sarwono, J. (2012). Mengenal SPSS Statistic 20. Jakarta: Elex Media Komputindo. Jakarta.
Sekaran, U., & Bougie, R. J. (2013). Research methods for business: A skill building approach (6th ed.). John Wiley & Sons.
Sunariyah (2011). Pengantar pengetahuan pasar modal. STIM YKPN. Yogyakarta.
Usman, M., Djoko K., Arys I., Hasan Z. M., I Gede P. A. S., I Nyoman. T., & Srihandoko. (1994). ABC pasar modal Indonesia. Jakarta: Institut Bankir Indonesia. Wu, Y., Krehbiel, T., & Brorsen, B. W. (2011). Impacts of
tick size reduction on transaction costs. International Journal of Economics and Finance, 3(6), 57. doi:10.5539/ijef.v3n6p57.
Table 4 Result of Mann – Whitney U Test Ranks
Price Fraction Rules N Mean Rank Sum of Ranks
Volume Before 30 32,67 980,00
After 30 28,33 850,00
Total 60
Value Before 30 25,57 767,00
After 30 35,43 1063,00
Total 60
Frequency Before 30 15,60 468,00
After 30 45,40 1362,00
Total 60
Test Statisticsa
Volume Value Frequency
Mann-Whitney U 385,000 302,000 3,000
Wilcoxon W 850,000 767,000 468,000
Z -0,961 -2,188 -6,609