PUBLIC HEALTH DEVELOPMENT INDEx
Puti Sari Hidayangsih,1 Dwi Hapsari,1dan NA. Ma’ruf2
AbstrAct
The objective of formulation the Indonesian Public Health Development Index (IPHDI) was to describe the successful development of public health based on composite several community-based health indicators. Cross sectional study design. The data analyzed was a combination of a nationwide survey covering Baseline Health Research (Riskesdas) 2007, National Social Economic Survey (Susenas) 2007 and the Village Potential (Podes) in 2008. Selection of appropriate indicators included in IPHDI associated with LE at birth, selected on the basis of consensus expert team. When the indicator has the RSE (relative standard error) value of less than 30% and the value was held for more than 75% of districts, then the indicator is a candidate in the calculation IPHDI. The team doing the analysis on 22 models of the combination of indicators. The number of indicators that involved between 18 to 24. These models have been made and tested for correlation weighting of life expectancy each district. Results of correlation ranged from 0.314 to 0.512 and all models have a significance value p < 0.001. The model was chosen considering the variables that are considered priorities and values of correlation. IPHDI highest value is 0.708959 (Magelang City, Central Java) and the lowest is 0.247059 (Pegunungan Bintang district, Papua).
conclusion. IPHDI utilization is to know district who has severe health problems, resulting in enhancement programs that have intervened, resulting in focusing the target location, and became one of the parameters for the calculation of aid allocations fairly from center to the region.
Key words: health indicators, Indonesian public health development index, life expectancy
AbstrAK
Untuk membandingkan keberhasilan pembangunan sumber daya manusia antar negara adalah digunakan Indeks Pembangunan Manusia (IPM). Tujuan dirumuskannya Indeks Pembangunan Kesehatan Masyarakat (IPKM) adalah untuk menggambarkan keberhasilan pembangunan kesehatan masyarakat berdasarkan komposit beberapa indikator kesehatan berbasis komunitas. Desain penelitian cross sectional. Data yang dianalisis merupakan gabungan survei berskala nasional meliputi Riset Kesehatan Dasar (Riskesdas) 2007, Survei Sosial Ekonomi Nasional (Susenas) 2007 dan Potensi Desa (Podes) tahun 2008. Pemilihan indikator yang layak masuk dalam IPKM yang berkaitan dengan UHH waktu lahir, dipilih berdasarkan kesepakatan tim ahli. Bila indikator mempunyai nilai RSE (relative standard error) kurang dari 30% dan nilai tersebut dimiliki lebih dari 75% kabupaten/kota, maka indikator tersebut menjadi kandidat dalam penghitungan IPKM. Tim melakukan analisis pada 22 model kombinasi indikator. Jumlah indikator yang terlibat antara 18 sampai dengan 24. Model-model tersebut telah dilakukan pembobotan dan diuji korelasi terhadap UHH setiap kabupaten/kota. Hasil korelasi berkisar antara 0,314 sampai dengan 0,512 dan semua model mempunyai nilai kemaknaan p < 0,001. Model yang terpilih mempertimbangkan variabel yang dianggap prioritas dan nilai korelasi. Nilai tertinggi IPKM adalah 0,708959 (Kota Magelang, Jateng) dan yang terendah adalah 0,247059 (Kab. Pegunungan Bintang, Papua). Kesimpulan:Pemanfaatan IPKM bisa beragam, yaitu mengetahui kab/kota yang mempunyai masalah kesehatan berat, menghasilkan penajaman program yang harus diintervensi, menghasilkan penajaman lokasi sasaran, dan menjadi salah satu parameter perhitungan alokasi bantuan pusat ke daerah secara berkeadilan.
Kata kunci:Indeks pembangunan kesehatan masyarakat, indikator kesehatan, umur harapan hidup
1 Center of Public Health Intervention Technology, Board of National Institute of health Research & Development, address: Percetakan Negara 29 Jakarta.
INTRODUCTION
Health development should be viewed as an investment to improve the quality of human resources. In the Law No. 17/2007 on RPJPN Year 2005–2025 1 it
is stated that in order to achieve the human resources qualified and competitive, then health, education and increasing people’s purchasing power are the three main pillars to improve the quality of human resources and the Human Development Index (HDI) of Indonesia. HDI or “Indeks Pembangunan Manusia (IPM)” is one measurement tool that is considered
to reflect the status of human development, so often
used to compare the success of the human resources development between countries. In the paradigm of HDI, the primary focus is aimed at human development, prosperity, justice, and sustainability. The rationale of this paradigm refers to the human ecological balance and optimal goal is the optimal actualization of human potential.
HDI is a composite indicator consists of health indicators, education and economics.2 Knowledge
has a fundamental role for human development. In calculating the HDI, knowledge is measured by two indicators namely literacy rate and school length average (Mean Years School). Other indicator used in HDI is an indicator of decent living standards using real GDP per capita which has been adjusted. One component of the HDI is the Health Index that only one measurement used as an indicator of the health that is life expectancy (LE). Life expectancy is the estimation of population lifetime average since birth, assuming no change in mortality patterns by age. Calculating life expectancy by an indirect method, from an information of children born alive and children still alive in a certain period of time. With the help of mortality tables, the life expectancy will be obtained. The calculation is still using the indirect method because the implementation of vital registration is not optimal yet, so that changes in the vital activity of population (births, deaths and migration) could not be certainly known. Infant mortality rate (IMR) is also not used for purposes of calculating the HDI because it judged to be non-sensitive indicators for industrialized countries that have been advanced.
Based on the above matters, HDI has been used as a benchmark to assess the success of the development, so that priorities are always geared towards improving the HDI in the region. Many local
governments prioritize the three pillars of development namely: economy, education and health. For the health sector, indicator that represent the HDI is life expectancy at birth. However, when questioned
further, how to increase life expectancy, it is difficult to
answer with certainty. Beside, to attain life expectancy rate is also not easy because of the limited availability of registration data so that must use the indirect method. Therefore, it takes a series of other health indicators are expected to affect health and can further increase the life expectancy at birth. Health indicators can be directly and easily measured to describe life expectancy.
METHODS
Source data used
To develop the health indicators that support life expectancy, National Institute of Health Research and Development (NIHRD) has been implementing the Baseline Health Research (Riskesdas) in 2007
which was designed to collect data in the health field
ways collected: interviews using questionnaires, physical measurements (weight, height, blood pressure), and biochemical examination. These questions are addressed to individuals should be directly interviewing individuals concerned. Questions about household information can be gathered through interviews with heads of households or household members who know the characteristics of the household. In Riskesdas 2007, population is all households in Indonesia. The sample of households and household members in Riskesdas 2007 is designed identical to the sample list of households and household members of SUSENAS 2007. All households and household members on SUSENAS sample 2007 to become sample of Riskesdas 2007. SUSENAS sample of successful re-visited by Riskesdas team in 440 districts as many as 258,446 household and individuals who successfully re-interviewed as many as 973,657 people. Riskesdas 2007 also collects 36,357 samples for measurement of various biomedical variables of household members older than 1 year old and living in villages with urban
classification. In particular for the measurement of
blood sugar, had been gathered as many as 19,114 samples taken from household members aged 15 years old above. Riskesdas limitations include non-random error such as: the formation of new districts, census blocks are not affordable, households are not met, the time period of data collection are
different. Remarkably, for the five provinces (Papua,
West Papua, Maluku, North Maluku and NTT) recently carried out in August-September 2008, while the other 28 provinces was completed in 2007. In addition, district-level estimates could not be applicable to all indicators, and biomedical data that only represent urban census blocks.
Central Bureau of Statistics (BPS) also conducted a survey of Villages Potential (Podes) and National Socio-Economic Survey (SUSENAS), which can support the establishment of health indicators. Data collected from the SUSENAS on household expenditure, social characteristics, and some related to health. Sample of SUSENAS 2007 is represent at district level which includes a sample of individuals 1,167,019 and 285,186 households in 33 provinces in Indonesia. Documenting individual or household based on interviews with the community. Podes record the entire village on human resources and health facilities. Podes survey aims to provide data
on potential and performance development in the village and its development which includes the social, economic, infrastructure and facilities, as well as the potential that exists in the village. Podes 2008 data has been collected by CBS in April-May 2008 were collected from all villages or other administrative areas such as village level in Indonesia with a total 75,410 villages (according to November 2007) were spread in 465 districts. Data collection of Podes 2008 was performed on census (complete enumeration). Field enumeration conducted through direct interviews by enumerators with village heads or designated staff or other relevant sources. Variables that can be used to study the interests of health development at village level such as facilities (hospitals, health centers, village health posts, polindes, posyandu, etc.) and health human resources (doctors, midwives, other health personnels). By using the three national community-based health data that is Riskesdas (Baseline Health Research), SUSENAS (National Socio-Economic Survey), and Podes Survey (Village Potential) then formed a composite indicator that describes the progress of health development. Those composite indicators are developed as the Indonesian Public Health Development Index (IPHDI).
Defining Indicators
To select appropriate indicators included in IPHDI used the following approach. Firstly, indicators that are substantially deserve to go to be part of IPHDI, which is associated with life expectancy at birth, is chosen by consensus of the expert team. Secondly, statistical indicators that can represent the district level, in this case refer to the value of RSE (relative standard error). When the indicator has the RSE value of less than 30% and the value is held for more than 75% of districts, then the indicator is a candidate in the calculation IPHDI.
This first stage of analysis produce data sets that
contain the value of prevalence and the RSE of each variable based on the district. Variables were selected in 91 with a value of RSE < 30% and must be owned by at least 75% of districts for the next index analysis.
Developing IPHDI Alternative
takes approximately 1 year to formulate IPHDI. The process of formulating IPHDI continue to grow in accordance with the number of critiques, feedback and suggestions, both from the practitioners, experts and researchers in NIHRD thinking. IPHDI idea emerged after the Minister of Health (Ms. Siti Fadhilah Supari) asks the best rank of districts and provinces based on the Riskesdas results. This request raises the idea to develop a composite indicator, which can summarize the key indicators of public health. Thus based on the composite indicator can be ranked district, from the best ratings to the lowest rank. This reasoning is also consistent with the purposes of advocacy to local government district, in order to perform concentration on intervention programs in health. Given a reference throughout the Local Government District is the HDI, the composite indicator results from Riskesdas should lead to improvements of HDI, in particular health indicators namely life expectancy at birth.
To formulate IPHDI, there are many of discourses
developed as follows, firstly, how to treat the numbers
in the opposite direction, namely the coverage rate (the higher the percentage means the better) with the prevalence of disease (higher prevalence means more bad). So there must be converted, for its line. Secondly, treatment of prevalence rates, could be from the most simple way to the most complex way or what it is. In this case, there are 3 types of treatment of disease prevalence rate, the prevalence is only used to rank the district, so the prevalence was not taken into account. For example, the prevalence of pneumonia is much less than ARI. To be balanced, both synchronized by way of converting from 0% (lowest) to 100% (highest). Moreover, the prevalence enforced as it is. Whether or not the weighting between variables, and if there is how much weight. In the process of formulating IPHDI, there are several alternatives that without weighting, there is the weighting. Ideal values used as reference. What is the lowest prevalence to be the best reference, or it is best that there is no more disease in question? Various discourses mentioned above determine the number of alternatives that could be developed to formulate this IPHDI. Until now it has developed 22 IPHDI alternative. Variations among alternative IPHDI occur because of the type
and amount of the selected indicators. How many indicators that will be selected, some experts claim that the index of the few indicators only, while other experts claim it could be many, depending on the purpose of developing the index. There are weight and size between the indicators. There is no need to consider the weight between the indicators, but many experts recommend using weighting, because the
influence of each health indicator of life expectancy
are not the same. If there is then agreed weighting, the magnitude of the weights for each health indicator must also be formulated again. Treatment of the prevalence rate is only to determine the rankings, there is equivalency between the prevalence, or prevalence rate as it is enforced. The ideal number for each health indicator. For coverage, of course easily, the best is 100% and the worst is 0%. But for the prevalence of disease how to specify this? What is the best means non ARI? It is unlikely that residents of the district which suffered non ARI. Differences determining the ideal number of IPHDI gives the empirical and theoretical value. Empirical IPHDI when the ideal number of prevalence of disease is taken very low number, while the theoretical IPHDI when disease prevalence equal to 0% in other words there is no disease.
All the alternatives that exist IPHDI then performed using correlation with life expectancy at birth. Alternative IPHDI which has the highest correlation is the best, so that was selected as the
definitive IPHDI.
RESULTS
Based on the method that has been determined, the analysis is carried out on 22 model combinations of indicators. The number of variables involved between 18 to 24. The models are weighted and tested for correlation against life expectancy in each district. Results of correlation ranged from 0.314
to 0.512 and all models have a significance value
The last 4 (four) alternatives using the same indicators, but the differences are:
a) Alternative 19: Ratio of physician/average of health center population and the ratio of midwives/ average villager.
b) Alternative 20: Ratio of physician/health center and the ratio of midwives/village.
c) Alternative 21: Ratio of physician/population and ratio of midwife/population.
d) Alternative 22: Ratio of physician/population ratio and the midwife/resident.
Determination of selected IPHDI
To determine which model will be chosen to be IPHDI, used health indicators life expectancy at birth time as a golden standard. Life expectancy is an indicator of the health component in the HDI/IPM (Indeks Pembangunan Manusia). Alternative or model which has correlation value (r) is best used with a life expectancy as IPHDI determination selected.
IPHDI model involving 24 variables selected by involving the ratio of physician/health center and the ratio of midwives/village. Correlation values
Table 1. The chosen combination model of indicators considered priorities and values of correlation
Alternative Indicators Weight Prevalence r Expln Reason
1 18 (+) model A abort The prevalence/proportion is only used for ranking
2 18 (-) model B 0.455
3 18 (-) model B 0.429
4 12 (-) model B 0.449
5 18 (-) model B 0.406
6 12 (+) model B 0.398
7 18 (+) model B 0.292
8 20 (+) model C 0.449
9 21 (+) model C 0.446
10 21 (+) model C 0.439
11 22 (+) model C 0.436
12 20 (+) model C 0.438
13 24 (-) model A abort The prevalence/proportion is only used for ranking 14 20 (-) model A abort The prevalence/proportion is only used for ranking 15 20 (-) model A abort The prevalence/proportion is only used for ranking
16 20 (+) model C 0.489
17 20 (+) model C 0.496
18 20 (+) model C abort Indicators of malaria and tuberculosis are unrepresentative for the district
19 24 (+) model C 0.505
20 24 (+) model C 0.512
21 24 (+) model C 0.505
22 24 (-) model C 0,505
obtained from this model is 0.512. Details of these variables with operational definitions as follows.
Toddler malnutrition and underweight, this indicator is a comparison of weight and age. Bad category if it has a value of Z score less than -2 SD. Less category if it has a value of Z score less than -3 SD. Toddlers short and very short, this indicator is a comparison of height and age. Short category if it has a value of Z score less than -2 SD. Very short category if it has the value of Z score less than -3 SD. Toddler thin and very thin, this indicator is a comparison of height and weight. Thin category if it has the value Z score less than -2 SD. Very thin category if it has the value of Z score less than -3 SD. Access to water, this indicator is about water use per capita in the household. Good category if household uses minimum 20 liters per person per day. Access to sanitation, this indicator is about using its own toilet facilities and type of septic tank. Weighing children under five, this indicator for toddlers who weighed in last 6 months. It is assumed “good” if weighed 1–3 times. Neonatal 1st Visits, this is refers to infants under 12 months of
Complete immunization, it is about immunization of children aged 12–23 months obtained. It is assumed “complete” if the child has been immunized BCG 1 time, and at least 3 times DPT and at least 3 times Polio and 1 times the measles. The ratio of physician, this indicator is a comparison of the number of physicians per health center. It is assumed “good” if a minimum ratio of 10 doctors per health center. The ratio of midwives, this indicator is a comparison of the number of midwives per village. It is assumed “good” if a minimum ratio of three midwives each health center.
Delivery by health personnels, it means the first health
personnel who help in childbirth with toddlers as the unit of analysis. The health personnels are doctors, midwives, and paramedics. Overweight children under five years, this is a comparison of weight and height. Children are assumed as “overweight” if they have a Z score value above 2 SD. Diarrhea, it means people who are diagnosed diarrhea or have symptoms of diarrhea in the last 1 month. Hypertension, this is about population aged 15 years old above and were examined systole-diastole during the data collection.
It is assumed “Hypertension” if the systolic is greater equal to 140 mmHg or the diastole is greater equal to 90 mmHg. Pneumonia, it is about population who diagnosed pneumonia or experiencing symptoms of pneumonia in the last 1 month. Handwashing behavior, it is a habits of the population aged 10 years old above washing hands with soap. It is assumed “Good habits” if washing hands with soap at the time before eating and before preparing food and after handling animals (birds, cats, dogs). Mental health, it is based on the scores of SRQ questions. Mental health is categorized “disturbed” if it has a score 6 or above. Smoking behavior, the habit of smoking or chewing tobacco during the last 1 month. It categorized as “bad habit” if done every day or occasionally. Oral health, it is about population who have problems with teeth and or mouth in the last 12 months. Asthma, this means population who had been diagnosed with asthma by health personnel or experiencing symptoms of asthma. Disability, population aged 15 years old and above who have at least one limitation and or need help. Injury, population who have had injuries in
Table 2. Health indicators used and value of weight
VARIABLE INDICATOR WEIGHT
Prev. children < 5 y.o malnutrition and underweight Absolute 5
Prev. children < 5 y.o are very short and short Absolute 5
Prev. children < 5 y.o are very thin and thin Absolute 5
Access to clean water Absolute 5
Access to sanitation Absolute 5
Coverage of children < 5 y.o weighing Absolute 5
Coverage of neonatal examination Absolute 5
Coverage of complete immunization Absolute 5
The ratio of physician/health center Absolute 5
The ratio of midwives/village Absolute 5
Delivery coverage by health personnel Absolute 5
Overweight children < 5 y.o Important 4
Diarrhea Important 4
Hypertension Important 4
Pneumonia Important 4
Proportion of handwashing behaviour Important 4
Prevalence of mental disorder Need 3
Proportion of daily smoking behavior Need 3
Prevalence dental and mouth disease Need 3
Prevalence of asthma Need 3
Prevalennce of disability Need 3
Prevalence of injury Need 3
Prevalence of joint disease Need 3
the last 12 months so that their daily activities were disrupted. Hinge, population aged 15 years old and above who were diagnosed with joint disease/arthritis/ rheumatism or had experienced symptoms of joint pain/arthritis/rheumatism by health personnel. ARI, population who have been diagnosed suffering from ARI or experiencing symptoms of respiratory illness by health personnel.
Step-by-step analysis of 24 variables are as
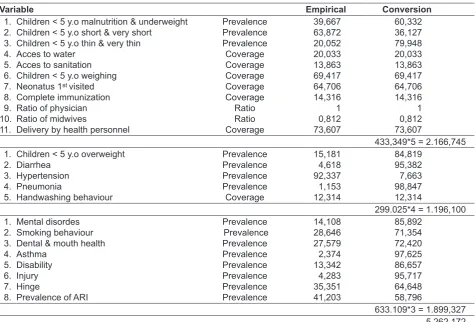
follows, firstly, calculation of empirical values. This is conducted an equalization of coverage conditions with the value of the disease prevalence or health status. On the coverage variable, value is in accordance with the result of the analysis. The higher value, the coverage is the better. In the variable of the disease prevalence or health status, it is conducted an equalization by using the formula 100-digit prevalence. Thus the prevalence of these has the same meaning with the coverage that the higher the value of the variable prevalence is the better. Secondly, for the workforce
was done calculation for the ratio of doctors per health center and the ratio of midwives per village. Value percent each variable that has been carried an equalization was multiplied by the weight. The absolute indicator group is multiplied by weight of 5, the important indicator group is multiplied by weight of 4, while the need indicator group to be multiplied by weight of 3. The multiplication results are sorted into empirical value. The higher the value is the better.
After obtaining empirical values to obtain the value of the index, it is need to do a calculation of theoretical value. To obtain the theoretical value, based on the coverage, the worst value equal to 0 and the best value equal to 100. On the prevalence, the worst value equal to the lowest real value after adjusted and best value equal to 100. On the ratio, the worst value for physicians equal to 0 and the best value equal to 10. For midwives, the worst value equal to 0 and the best is equal to 3.
Table 3. The empirical value and conversion
Variable Empirical Conversion
1. Children < 5 y.o malnutrition & underweight 2. Children < 5 y.o short & very short
8. Complete immunization 9. Ratio of physician 10. Ratio of midwives
11. Delivery by health personnel
Prevalence
5. Handwashing behaviour
Table 4. The teoritical value
Variable The best The worst
1. Children < 5 y.o malnutrition & underweight 2. Children < 5 y.o short & very short
8. Complete immunization 9. Ratio of physician 10. Ratio of midwives
11. Delivery by health personnel
100
12. Children < 5 y.o overweight 13. Diarrhea 19. Dental & mouth health 20. Asthma
21. Disability 22. Injury 23. Hinge
24. Prevalence of ARI
100
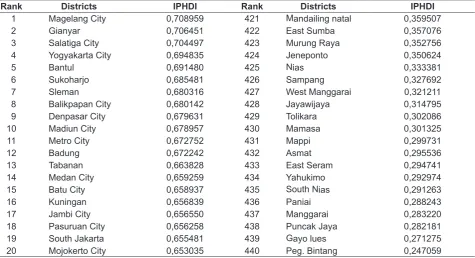
Table 5. The top-20 rank and the lowest-20 rank of districts by IPHDI calculation
Rank Districts IPHDI Rank Districts IPHDI
1 Magelang City 0,708959 421 Mandailing natal 0,359507
2 Gianyar 0,706451 422 East Sumba 0,357076
3 Salatiga City 0,704497 423 Murung Raya 0,352756
4 Yogyakarta City 0,694835 424 Jeneponto 0,350624
5 Bantul 0,691480 425 Nias 0,333381
6 Sukoharjo 0,685481 426 Sampang 0,327692
7 Sleman 0,680316 427 West Manggarai 0,321211
8 Balikpapan City 0,680142 428 Jayawijaya 0,314795
9 Denpasar City 0,679631 429 Tolikara 0,302086
10 Madiun City 0,678957 430 Mamasa 0,301325
11 Metro City 0,672752 431 Mappi 0,299731
12 Badung 0,672242 432 Asmat 0,295536
13 Tabanan 0,663828 433 East Seram 0,294741
14 Medan City 0,659259 434 Yahukimo 0,292974
15 Batu City 0,658937 435 South Nias 0,291263
16 Kuningan 0,656839 436 Paniai 0,288243
17 Jambi City 0,656550 437 Manggarai 0,283220
18 Pasuruan City 0,656258 438 Puncak Jaya 0,282181
19 South Jakarta 0,655481 439 Gayo lues 0,271275
Summarize the theoretical value of all variables in each group of indicators. The sum is to group the worst value and the best value groups. After each group was calculated, then multiply the weight of each group of indicators such as the absolute, important, and need. This multiplication was performed for each group of the worst and the best value groups. Therefore, it is acquired the worst theoretical value from the results of the worst group and get the best theoretical value from the results of the best group.
The next stage to attain the index value are as follows:
Indeks = (empirical value – the worst value) (the best value – the worst value)
Based on IPHDI value, the rank of districts across Indonesia could be made, from the best to the worst. List of the top-20 rank and the lowest-20 rank of the 440 districts in Indonesia based on the IPHDI calculation could be seen on the table 5.
It appears that the highest value is 0.708959 IPHDI (Magelang City, Central Java) and the lowest is 0.247059 (Pegunungan Bintang District, Papua).
DISCUSSION
IPHDI also has weaknesses that the indicator used is limited by the available indicators on Riskesdas and information sources from other surveys. It would be different if the idea came before Riskesdas, so the indicators can be determined from the beginning then it will be more complete. Ideal condition made for IPHDI is theoretically ideal, which could not be done entirely by the district.
The important aspect of this study is the formation of Indonesian Public Health Development Index which is a composite variable. This index could describe the ranking of the 440 districts that has never existed in Indonesia.
Implications of IPHDI uncover health problems in each district so that the program interventions become
more obvious and focus. This finding is useful also for
the allocation of funds from the center to the regions based on justice. However, it should be remembered that the health indicators used in this calculation is not perfect yet. IPHDI could be improved by calculating the rate of prevalence for several diseases as an indicator and to formulate other indicators to complement IPHDI calculation.
Other research which relate to this paper is a study conducted by Abdesslam in 2006 (Abdesslam Boutayeb, Mansour Serghini). He examines the health indicator and its relationship with the HDI in the Arab countries. Unlike IPHDI study developed in Indonesia, where using Pearson Correlation method in the calculation of relative standard error (RSE), then the study in this Arab countries using Principal Component Analysis (PCA). Indicators used in IPHDI of 24 indicators, whereas in Abdesslam’s study using 11 health indicators, namely life expectancy at birth, expectation of lost healthy, maternal mortality ratio, delivery attended by skilled attendant, pregnant women who received prenatal care, the weight of children under < 5 y.o, infant mortality rate, number of physician per 100,000 people, HDI rank, literacy, enrollment of school. IPHDI use many variable factors because they want to know whether that can increase life expectancy. For example, the indicator ratio of doctors, Abdesslam using the ratio of doctors per population, while IPHDI using the ratio of doctors per
health center. This is due to the geographical influence
in Indonesia, where if the area is very spacious but the number of people slightly, for example: Papua Province. IPHDI compare the ranks among 440 districts, while Abdesslam comparing the 19 states in the Arab region. In Indonesia study yielded IPHDI composite indicator which provides a ranking of districts with health problems respectively, while the result obtained Abdesslam’s study described the relationship between the health indicators and human development in the Arab world. Indicators related most closely to the human development index in the Arab countries are maternal and infant mortality.
CONCLUSION
as one of the parameters/criteria for calculating the allocation of central assistance to the district as a justice.
ACKNOWLEDGEMENT
We extend our thanks to DR. Dr. Trihono, MSc who has provided the opportunity to pour the IPHDI book into this article. A big thank you also goes to Prof. Purnawan Junaedi, Dr. Sandy Iljanto MSc., and DR. Atmarita for making this study possible. Thanks you to Rofingatul Mubasyiroh, Suparmi, and Teti Tejayanti for their help in statistically calculating this formulation.
REFERENCES
Abdesslam Boutayeb, Mansour Serghini. Health indicators and human development in the Arab region.
International Journal of Health Geographics. 2006 Dec; 5:61.
Bappenas. [National Long Term Development Plan 2005-2025]. Ministry of State National Development Planning. National Development Planning Board. 2009. Indonesian.