DEVELOPING A LOCAL INSTRUCTION THEORY
ON RATIO AND SCALE
Master Thesis
Wisnuningtyas Wirani 137785078
SURABAYA STATE UNIVERSITY
POSTGRADUATE PROGRAMME
DEVELOPING A LOCAL INSTRUCTION THEORY
ON RATIO AND SCALE
MASTER THESIS
A Thesis submitted to
Surabaya State University Postgraduate Programme as a Partial Fulfillment of the Requirement for the Degree of
Master of Science in Mathematics Education Programme
Wisnuningtyas Wirani 137785078
SURABAYA STATE UNIVERSITY
POSTGRADUATE PROGRAMME
i
APPROVAL OF SUPERVISORS
Thesis by Wisnuningtyas Wirani, NIM 137785078, with the title Developing a Local Instruction Theory on Ratio and Scale has been qualified and approved to be tested.
Supervisor I,
Prof. Dr. Siti M. Amin, M.Pd.
Date,
………
Supervisor II,
Dr. Agung Lukito, M.S.
Date,
………
Acknowledged by
Head of the Mathematics Education Study Programme
ii APPROVAL
Thesis by Wisnuningtyas Wirani, NIM 137785078, with the title Developing a Local Instruction Theory on Ratio and Scale has been defended in front of the Board of Examiners on 29 June 2015.
Board of Examiners
Name Signature Position
Dr. Agung Lukito, M.S. ………. Chairman/Supervisor II
Prof. Dr. Siti M. Amin, M.Pd. ………. Member/Supervisor I
Prof. I Ketut Budayasa, Ph.D. ………. Member
Dr. Abadi, M.Sc. ………. Member
Dr. Siti Khabibah, M.Pd. ………. Member
Acknowldged by
Director of Postgraduate Programme
iii
DEDICATION
Sungguh saya bukan siapa-siapa tanpa doa dan didikan orangtua
Untuk ibuku, Sunarni Yang selalu mengajarkan dan menanamkan “maaf”, “tolong”, dan “terima kasih”
Untuk adekku, Anggra Nur Cahyo Yang telah menunjukkan arti kegigihan dan kesabaran
Untuk suamiku, Ronggo Nurseto Yang berjuang bersama mulai dari nol
iv ABSTRACT
Wirani, W. 2015. Developing a Local Instruction Theory on Ratio and Scale.
Thesis, Mathematics Education Study Programme, Postgraduate Programme of Surabaya State University. Supervisors: (I) Prof. Dr. Siti M. Amin, M.Pd. and (II) Dr. Agung Lukito, M.S.
Keywords: ratio, multiplicative comparison, double number line, RME, design research
v ABSTRAK
Wirani, W. 2015. Developing a Local Instruction Theory on Ratio and Scale. Tesis, Program Studi Pendidikan Matematika, Program Pascasarjana Universitas Negeri Surabaya. Pembimbing: (I) Prof. Dr. Siti M. Amin, M.Pd. dan (II) Dr. Agung Lukito, M.S.
Kata kunci: rasio, multiplicative comparison, garis bilangan ganda, RME, design research
Mempelajari rasio merupakan hal yang penting bagi siswa di sekolah dasar sebagai dasar untuk mempelajari dan menalar mengenai proposi pada tingkat pendidikan yang lebih tinggi. Terdapat dua konsep penting pada rasio, yaitu multiplicative comparison dan composed unit. Meskipun rasio terkait dengan penggunaan
multiplicative comparison untuk menyatakan hubungan antar bilangan, siswa mengalami kesulitan dalam menyatakan hubungan antar bilangan dalam suatu rasio atau antar rasio dengan menggunakan multiplicative comparison. Berdasarkan penelitian, siswa menggunakan selisih dan penjumlahan untuk menyatakan hubungan antar bilangan pada rasio. Menyadari miskonsepsi yang terjadi pada siswa dan kurangnya penjelasan mengenai instruksi pembelajaran pada perbandingan dan skala, diperlukan adanya pengembangan local instruction theory
yang dapat mendukung siswa untuk memahami perbandingan dan skala. Oleh karena itu, penelitian ini bertujuan untuk memberikan kontribusi local instruction theory, yang dapat mendukung siswa untuk memahami rasio dan skala dengan menggunakan garis bilangan ganda. Untuk memunculkan model, konteks yang digunakan pada penelitian ini antara lain denah dan peta. Design research
digunakan sebagai pendekatan penelitian yang terdiri dari dua siklus eksperimen pembelajaran. Instruksi pembelajaran pada penelitian ini disusun dengan mengimplementasikan Realistic Mathematics Education (RME). Pengambilan data dilakukan di SDIT At Taqwa, Surabaya. Partisipan penelitian ini adalah guru matematika dan siswa kelas lima. Pada penelitian ini, data yang diperoleh berupa fragmen video penting yang terkait dengan pembelajaran dan pekerjaan siswa. Data tersebut akan dibandingkan dengan hypothetical learning trajectory. Hasil analisis menunjukkan bahwa sebagian siswa menggunakan multiplicative comparison
vi PREFACE
Praise and thank to Allah for every blessing and joy. Finishing the thesis will be impossible without support and cooperation from many people. Therefore, I would like to give my appreciation to:
1. Prof. Dr. Siti M. Amin, M.Pd. and Dr. Agung Lukito, M.S as my supervisors in Surabaya State University. Thank you for the encouragement and guidance during writing this thesis. I enjoyed every discussion we had, it brought enlightenment every time I face the dead end.
2. Dr. Dolly van Eerde and Drs. Monica Wijers as my supervisors in Netherlands for the concerns and the thoughtful feedback to improve the first part of the thesis and the design of this study.
3. Dr. M. L. A. M Dolk as the coordinator of IMPoME in the Freudenthal Institute, Utrecht University, for sharing thoughts and looking things from different perspectives.
4. Lecturers and staffs of UNESA and Utrecht University for many kinds of help. 5. Dikti and NESO for funding the study.
6. The principal, the curriculum vice principal, the teachers, and students of class 5B and 5C of SDIT At Taqwa for cooperating during the data collection. 7. Colleagues of IMPoME 2013 in Surabaya and Palembang for the joyous and
unforgettable moment.
8. Prof. Dr. Marsigit, M.A. and family for supports and prayers.
This thesis is not perfect as the writer still learning from her point of view. To improve, the writer needs different points of view from the readers. Therefore, critics and feedback are welcomed.
vii
TABLE OF CONTENTS
APPROVAL OF SUPERVISORS ... i
APPROVAL ... ii
DEDICATION ... iii
ABSTRACT ... iv
ABSTRAK ... v
PREFACE ... vi
TABLE OF CONTENTS ... vii
LIST OF TABLES ... x
LIST OF FIGURES ... xi
LIST OF APPENDICES ... xiii
CHAPTER 1: INTRODUCTION ... 1
A. Research Background ... 1
B. Research Question ... 3
C. Research Aim ... 4
D. Definition of Key Terms ... 4
E. Significance of the Research ... 5
CHAPTER 2: THEORETICAL FRAMEWORK ... 6
A. The Concepts ... 6
1. Proportion and proportional reasoning ... 6
2. Ratio and scale ... 7
B. The Importance of Learning Ratio and Scale ... 9
C. Knowledge Gap ... 10
D. Students’ Misconceptions ... 11
E. Double Number Line ... 15
F. Realistic Mathematics Education ... 16
G. Indonesian Mathematics Curriculum ... 21
H. Social Norms, Socio-mathematical Norms and the Role of Teacher ... 22
I. Local Instruction Trajectory... 24
CHAPTER 3: METHODOLOGY ... 25
A. Research Approach ... 25
B. Data Collection ... 28
1. Observation ... 28
2. Semi-structured interview ... 28
3. Pretest ... 29
4. The pilot study (first cycle) ... 29
5. The teaching experiment (second cycle) ... 30
6. Posttest ... 30
viii
C. Data Analysis ... 31
1. Observation ... 31
2. Semi-structured interview ... 32
3. Pretest ... 32
4. The pilot study (first cycle) ... 32
5. The teaching experiment (second cycle) ... 33
6. Posttest ... 33
7. Validity and reliability ... 34
D. Research Subject ... 35
CHAPTER 4: HYPOTHETICAL LEARNING TRAJECTORY ... 36
A. Lesson 1 ... 37
B. Lesson 2 ... 44
C. Lesson 3 ... 50
D. Lesson 4 ... 55
E. Lesson 5 ... 58
CHAPTER 5: RETROSPECTIVE ANALYSIS ... 61
A. The Timeline of the Study ... 61
B. Data of Preparation Phase ... 63
1. Class Observation ... 63
D. Analysis of the Teaching Experiment ... 99
1. Pretest ... 99
E. Validity and Reliability ... 157
CHAPTER 6: CONCLUSION AND DISCUSSION ... 158
ix
B. Discussion ... 161
1. The weakness of the study ... 161
2. Suggestion ... 163
REFERENCES ... 164
x
LIST OF TABLES
Table 2.1. The concept of ratio and scale in the Indonesian mathematics
curriculum (Kemendikbud, 2013) ... 22
Table 4.1. Conjectures of students’ answer for problem 1a in lesson 1... 40
Table 4.2. Conjectures of students’ answer for problem 1b in lesson 1 ... 42
Table 4.3. Conjectures of students’ answer for activity 2 in lesson 1 ... 43
Table 4.4. Conjectures of students’ answer for problem a in lesson 2... 46
Table 4.5. Conjectures of students’ answer for problem b in lesson 2 ... 47
Table 4.6. Conjectures of students’ answer for activity 2 in lesson 2 ... 49
Table 4.7. Conjectures of students’ answer for problem 1a in lesson 3... 51
Table 4.8. Conjectures of students’ answer for problem 1b in lesson 3 ... 52
Table 4.9. Conjectures of students’ answer for problem 2 in lesson 3 ... 54
Table 4.10. Conjectures of students’ answer for problems in lesson 4 ... 57
Table 4.11. Conjectures of students’ answer for problems in lesson 5 ... 59
Table 5.1. The timeline of the study ... 62
Table 5.2. The students’ actual answer on lesson 1 cycle 1 ... 71
Table 5.3. The students’ actual answer on lesson 2 cycle 1 ... 77
Table 5.4. The students’ actual answer on lesson 3 cycle 1 ... 83
Table 5.5. The students’ actual answer on lesson 4 cycle 1 ... 88
Table 5.6. The students’ actual answer on lesson 5 cycle 1 ... 92
Table 5.7. Refinement of learning material and additional HLT ... 95
Table 5.8. The students’ actual answer on lesson 1 cycle 2 ... 108
Table 5.9. The students’ actual answer on lesson 2 cycle 2 ... 116
Table 5.10. The students’ actual answer on lesson 3 cycle 2 ... 128
Table 5.11. The students’ actual answer on lesson 4 cycle 2 ... 139
Table 5.12. The students’ actual answer on lesson 5 cycle 2 ... 151
Table 5.13. Reflection for the next study related to ratio... 156
xi
LIST OF FIGURES
Figure 2.1. A proportion problem about heights (Riehl & Steinthorsdottir, 2014)
... 11
Figure 2.2. The child determined the difference within the given ratio to determine the number of paperclips for Mr. Tall (Riehl & Steinthorsdottir, 2014) ... 12
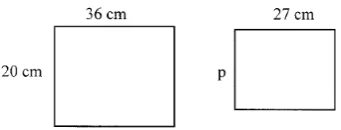
Figure 2.3. Determining the width p (Singh, 2000) ... 12
Figure 2.4. Using double number line in ratio problems ... 15
Figure 2.5. Levels of emergent model (Gravemeijer, 1997) ... 20
Figure 3.1. Micro cycles form and shape the local instruction theory (Gravemeijer & Cobb, 2006) ... 27
Figure 4.1. The studio plan and the blank studio plan ... 39
Figure 4.2. Making illustration and determining the real length... 41
Figure 4.3. Instructions to draw a classroom plan ... 43
Figure 4.4. Three different size maps and a double scale line ... 45
Figure 4.5. Students have to draw double scale lines ... 47
Figure 4.6. Using double scale line to determine real distance ... 48
Figure 4.7. A Bali map and its route ... 50
Figure 4.8. Working with the stretched route ... 52
Figure 4.9. Problem 2 in lesson 3 ... 54
Figure 4.10. Problem a in lesson 4 ... 56
Figure 4.11. Problem b in lesson 4 ... 57
Figure 4.12. Problem c in lesson 4 ... 57
Figure 4.13. Problems with shopping context ... 59
Figure 4.14. A problem with food consumption context ... 59
Figure 5.1. Choosing references ... 68
Figure 5.2. Using a reference to measure ... 68
Figure 5.3. Using a scale line to measure... 69
Figure 5.4. An illustration of ratio 3 cm:30 km ... 73
Figure 5.5. The students’ reasoning ... 74
Figure 5.6. An inappropriate double scale line ... 74
Figure 5.7. The students’ double scale line ... 75
Figure 5.8. Misplacing 90 km ... 76
Figure 5.9. The example of the students’ work ... 80
Figure 5.10. An illustration of Aisyah’s double scale line ... 80
Figure 5.11. An example of the students’ work ... 82
Figure 5.12. The students’ work ... 87
Figure 5.13. The student ordered numbers inappropriately ... 91
Figure 5.14. The teacher writings about difference and comparison ... 102
Figure 5.15. Using the width and the length to measure the coloured lines ... 104
xii
Figure 5.17. The student’s drawing in comparing a scale line to the orange line 106
Figure 5.18. The students drew the plan first ... 107
Figure 5.19. Students comparing the double scale line and the distance on maps ... 110
Figure 5.20. The teacher divided the lower scale line and asked a student to write information for every 1 cm ... 112
Figure 5.21. Tegar’s double scale line for map A ... 113
Figure 5.22. Information on Diva’s double scale line ... 114
Figure 5.23. An illustration of Sisi’s drawing ... 119
Figure 5.24. Sisi’s double scale line becomes more precise compared to the previous ... 120
Figure 5.25. Students determined the real distance for every 0,5 cm ... 121
Figure 5.26. Rizqi’s (a) and Danis’ (b) illustration ... 126
Figure 5.27. An illustration of the teacher’s drawing on the board ... 131
Figure 5.28. The students used multiplication to express the relationship between numbers ... 132
Figure 5.29. Tegar was using the double number line to solve the problem ... 134
Figure 5.30. The student only related the numbers from 10 ... 135
Figure 5.31. The students simplified the given ratio ... 136
Figure 5.32. The student used multiplication to express relationship between numbers ... 138
Figure 5.33. The teacher used fractional form and simplified it ... 141
Figure 5.34. Rizqi determined the relationship between numbers ... 142
Figure 5.35. Students directly simplified the given ratio and started from 4 ... 143
Figure 5.36. Sisi used multiplicative comparison to solve the problem ... 145
Figure 5.37. An example of the student’s work ... 146
Figure 5.38. The students expressed multiplicative comparison using the model ... 147
Figure 5.39. Diva drew the model as in using a double scale line ... 148
Figure 5.40. An example of students’ work ... 149
Figure 5.41. Students used the double number line ... 153
xiii
LIST OF APPENDICES
APPENDIX A. The Classroom Observation Scheme ... 1689
APPENDIX B. The Teacher’s Interview Scheme ... 170
APPENDIX C. Pretest, Posttest, and Examples of Expected Answer ... 171
1 CHAPTER 1
INTRODUCTION
A. Research Background
Many things in life are related to mathematics. One of the example is proportion. According to Tourniare and Pulos (1985), proportion is two equivalent ratios. People might not recognize the use of proportion in daily life. To illustrate the use of proportion in daily life, we provide an example. There is promotion price of tissue in two different shops, namely shop A and shop B. From brochures, we know that in shop A, people can buy 3 packs of tissue for IDR 8.000. In shop B, the price for 4 packs of tissue is IDR 9.000. A woman wants to buy tissue and she decides to go to shop B because the price is cheaper. When the woman is able to reason that tissue in shop B is cheaper, she has the notion of proportional reasoning. Proportional reasoning is related to the idea of reasoning for the equality of two ratios.
Proportion is related to ratio. What is ratio and how it is related to proportion? According to Lamon (2012), ratio is a comparison between two quantities. Refer back to the definition of proportion, proportion consists of two ratios. Ratio is a common topic we can find in the daily life. For example, in shopping context, shops usually give promotion of a product with label “buy 3
get 1 free”. In this case, we compare the number of product we buy and the
number of free product we get.
2 which talks about distance. To be more specific, scale is comparison between distance on the map and real distance (Ben-Chaim et al., 2012). We may find scale in maps. However, there are different examples which contains the notion of scale such as plans, miniature, and printing/copying. Scale usually use to shrink or enlarge objects. In maps, scale can be represented into symbols or drawings, for example double scale line. As an example, when we open google maps, we can see two scale lines with different measurement. These scale lines represent distance on the map and real distance.
Several studies have been done to find out students’ thinking related to proportion and ratio (Karplus et al., 1983; Hart, 1984; Tourniare & Pulos, 1985; Singh, 2000). These studies provide explanation on students’ misconception in learning ratio and proportion. There are two key concepts of ratio, multiplicative comparison and composed unit (Lobato and Ellis, 2010, as cited in Rathouz et al., 2014). In working on ratio problems, students tend to use subtraction and addition rather than use multiplication and division to determine relationship of numbers on ratios (Hart, 1984; Singh, 2000; Riehl & Steinthorsdottir, 2014).
3 contexts such as maps and shopping. However, the instructional learning on the textbook is limited to determine the real distance, the distance on the map, and the scale using formal method. The textbook focuses on students’ ability
to calculate rather than understanding the concept of ratio. In addition, the context does not support students to investigate the concepts of ratio using students’ informal knowledge. Therefore, when it comes to ratio problems,
students usually stick to the formula to determine real distance and use cross-multiplication to solve problems.
To help students in learning ratio, we can use a certain context and a model to help students in visualizing information. One of models we can use to introduce ratio is double number line. Using the context of maps, double number line elicits in the double scale line, in which scale is involved. According to Küchemann et al., (2014), double number line is a proper model to introduce ratio to students. This argument is supported by Abels et al. (2006) who mention the benefit of using double number line as a model. Numbers on the double number line are well ordered. It supports students to see the aligned relationship along the lines.
B. Research Question
Based on research background, we formulate the research question as follows:
4 C. Research Aim
Study which explicates the learning instruction on ratio and scale is still rare. Therefore, the study aims at developing the local instruction theory on topic ratio and scale. In this study, we involve double number line as a model to help students understand multiplicative comparison. We also involve contexts which fit well and elicit the model of double number line.
D. Definition of Key Terms
We define the key terms from the title, the research question, and the research aim to avoid misunderstanding of meaning and to restrict the focus of study.
1. To support
To facilitate, to engage, and to stimulate students to do investigations, observations, and discussions to achieve certain purposes.
2. Ratio
Ratio is comparison between two quantities. Ratio is the subset of proportion. In this study, we focus on determine missing value of equivalent ratios.
3. Scale
Scale is comparison between distance on the map and real distance. Scale is the subset of ratio. In this study, we use scale in the map context.
4. Double number line
5 number lines with two different scales. In this study, we use double number line to represent ratios and to express multiplicative comparison between ratios.
5. Local instruction theory
The instruction theory in this study consists of envisioned learning route and mathematical activities on topic ratio and scale.
E. Significance of the Research
6 CHAPTER 2
THEORETICAL FRAMEWORK
In this chapter, we will present the elements involved in the study. Before we discuss about ratio and scale, firstly we will discuss about proportion and proportional reasoning. We provide literature review about the importance of learning ratio and scale, the knowledge gap, and students’ misconceptions in learning ratio.
In this study, we will design a learning trajectory based on the design principles of Realistic Mathematics Education (RME). Considering the study will take place in Indonesia, the context will be modified so that it is familiar to Indonesian students. Besides, we will provide an overview of the topic according to the Indonesia mathematics curriculum.
A. The Concepts
1. Proportion and proportional reasoning
Tourniare and Pulos (1985) defined proportion as equality relationship
between two ratios in the form of = . To say that two ratios are
7 multiplicative comparison (Lamon, 2012).
Proportion problems can be distinguished into two types, missing value problems and comparison problems (Tourniare & Pulos, 1985). Missing value problems usually provide three given numbers, in which children are asked to determine an unknown number to satisfy the equivalent ratios. As an example, given a car needs 36 minutes to travel 24 km. Children are asked to determine how many minutes needed for a car to travel 6 km. For comparison problems, children are asked to compare ratios. Given car brand A consumes 3 litres of fuel to travel 40 km while car brand B consumes 4 litres to travel 50 km. We can say that the fuel consumption of car brand B is more efficient.
2. Ratio and scale
Ratio is a part of proportion. In general, ratio is widely used in describing the relationship between two measurements. Lamon (2012) defined ratio as a comparison of two quantities. For example, if there are 3 boys and 7 girls in a classroom, then the ratio between boys and girls is 3:7. Ratio can be represented as fractional form. As mentioned before, to determine whether two ratios are equal, we can write ratios into fractions. Using fractional form, it is easier to perceive ratio as a unit (Lamon, 2012).
8 composed units and multiplicative comparisons. To interpret the ratio 3:7 in composed units, students must be able to perceive that for every 3 boys, there are 7 seven girls. In addition, if students are able to express that the number of girls is 7/3 times as many of the number of boys, it means students understand that there is a multiplicative comparison in ratio.
Even though there is not much literature that specifically discusses about scale, Freudenthal (1999) mentioned scale as the example of ratio. Ratio and scale are connected one another. In addition, Ben-Chaim et al., (2012) claimed that “scale (in measurement) can be defined as the ratio between a unit of measure on a map and the real distance (using the same unit of measurement)” (p. 25). Since scale also compares two quantities, we
may derive a conclusion that scale is also ratio. There are different ways to express scale, for example a verbal scale, representative scale, and graphic scale (Roberge & Cooper, 2010). Scale and its representations are usually found in map and resizing context.
9 multiplicative comparison between numbers on ratios. Students need to use multiplicative comparison to determine missing values problems to show that they understand the concept of ratio.
B. The Importance of Learning Ratio and Scale
Multiplicative reasoning, equivalence, and computational fluency become the focus of mathematical themes for students in grade 3-5 (NCTM, 2000). During these grades, children must be able to understand the idea and the relationship of multiplication and division. Moreover, children must be able to recognize, create, and use the idea of equivalence using numbers and representations. In equivalence, children will involve fractions, decimals, multiplications, and divisions as their prior knowledge. Regarding to multiplicative reasoning and equivalence, children should be fluent in understanding the relationship among numbers. As mentioned before, proportion, ratio, and scale are related to multiplicative comparison and equivalence. Therefore, children must be able to employ the three mathematical themes in confronting with proportion, ratio, and scale.
Children’s prior knowledge will be used together with ratio to study other
10 sides on triangle is in fact ratio. Moreover, comparing whether all pairs of corresponding sides holds the same ratio is related to proportion.
On the lower level of secondary education, children will encounter ratio as an integrated concept. Children’s understanding about ratio will be used in the concept of slope in linear equations (Rathouz et al., 2014). As an example, to describe what slope is, students must be able to perceive the relationship between the value of x and y. The comparison between x and y can be written as m, in a linear equation it is called as gradient. Observing every pair of x and
y, children find out that the value of all pairs is the same. Thus, children who have a strong ratio concept will have better understanding of slope (Ellis, 2013).
C. Knowledge Gap
Many studies have been done to explore students’ understanding in
learning ratio and proportion (Karplus et al., 1983; Hart, 1984; Tourniare & Pulos, 1985; Singh, 2000). However, the study about developing a local instruction theory on ratio and explanation on how the learning sequences help students to learn the concept of ratio are still rare. Therefore, as a researcher, we need to carry out the study which aims at developing learning sequences on ratio. We hope the result of the study can contribute to the development of local instruction theory on ratio.
11 Teachers have tendency to instruct students to solve ratio and proportion problems in fractional form using cross-multiplication. Students who already understand the formal method of working with fractions might solve the problems using cross-multiplication. However, teachers need to be careful in introducing cross-multiplication. It may cause students to make mistakes, especially when students use incorrect proportions (Ellis, 2013).
D. Students’ Misconceptions
There are different strategies children use to solve ratio problems. According to Tourniare & Pulos (1985), there are at least four strategies. 1. Constant difference (subtraction and addition)
In this strategy, children determine the difference within the ratio. Later, children add the difference on another ratio. We provide the problem of Mr, Short and Mr. Tall as in figure 2.1.
From the problem, we know that the given ratio for the height of Mr. Short is 4 matchsticks:6 paperclips. Riehl and Steinthorsdottir (2014) found out that some children use constant difference to solve the problem as in figure Figure 2.1. A proportion problem about heights (Riehl & Steinthorsdottir,
12 2.2.
2. Multiplicative and constant difference
Children compare numerator or denominator between ratios using multiplicative comparison. However, when the relationship between ratios is non-integer, children use constant difference. As an example, we provide an example from a study (Singh, 2000). A child was asked to determine the width of a rectangle. The researcher provided another dimension of rectangle as the given ratio as in figure 2.3.
The child tried to determine the relationship between 36 and 27 using division. However, she could not obtain an integer as the relationship. Therefore, to determine p, she subtracted 36 by 27 and added the difference to 20.
Figure 2.2. The child determined the difference within the given ratio to determine the number of paperclips for Mr. Tall (Riehl & Steinthorsdottir,
2014)
13 3. Building up (repeated addition)
In this strategy, children are able to perceive the ratio within numbers. However, instead of using multiplicative comparison to determine the relationship between ratio, children use addition. We provide an example to illustrate how children use this strategy (Tourniare & Pulos, 1985). “Given, 2 pieces of candy cost 8 cents. How much does 6 pieces of candy cost?”
From the problem, we know that the given ratio is 2 candies:8 cents. To solve the problem, children may add 8 cents more to get 4 candies and add 8 cents more to get 6 candies. However, even though children are able to perceive the ratio, this strategy may leads students to an error when the numbers are non-integer (Steinthorsdottir, 2006).
4. Multiplicative
Children are able to perceive the multiplicative comparison within and between ratios. Using the candies example, children understand that the relationship within ratio is the price is four times the number of candies. In addition, children understand that the number of candies in the second ratio is six times the number of candies in the first ratio. To determine the price of 6 candies, children multiply 6 candies by 4.
14 The first, children do not pay attention to the given information on the problem. Ratio problems provide the given ratio of the problem. Rather than understanding the given ratio and the complete information, children tend to solve the problem using part of information (Tourniare & Pulos, 1985). It means that children do not fully understand the problem, especially the notion of ratio.
The second error is that children determine difference of numbers between ratios. As mentioned in previous studies, children are struggling to determine an integer relationship between numbers in ratios. Therefore, to obtain an integer, children are more comfortable to use addition and subtraction. We cannot separate the struggles and the fact that children are experiencing counting and whole numbers before multiplying, dividing, and working with non-integer numbers (Lamon, 2012). The second error is related to children’s fluency in understanding the relationship among numbers. The fact that children use addition and subtraction in solving ratio problems proves that they are not able to grasp ratio as a multiplicative operation (Hart, 1984; Karplus et al., 1974; Singh, 2000).
Based on the literature review, we can conclude that students tend to determine difference and to do addition in order to find missing values. The cause of these misconceptions is that students try to obtain integers as the relationship within ratio and between ratios. To tackle students’ misconception, we plan to design
15 ratios using multiplicative comparison.
E. Double Number Line
Students in grade 3-5 must be able to develop and to use models or representations in learning process to achieve three standards (NCTM, 2000): (1) to model problem situations, (2) to investigate mathematical relationships, and (3) to justify or to disprove conjectures. Using models or representations, students are able to select important information related to the problem.
There are different models to introduce ratio to students such as ratio table and double number line. In this study, we want to involve double number line in the learning process. On the double number line, we can display two quantities with different scales. In addition, the use of double number line supports students in understanding relationship within ratio and between ratios (Orrill & Brown, 2012). Given 2 mangos can be exchanged with 6 apples and the problem asks the number of apples for 5 mangos. Students can utilize the double number line to illustrate the ratio by putting the number of mangos on the lower line and the number of apples on the upper line as in figure 2.4.
The double number line supports students to understand the relationship within ratio, the number of apples is three times the number of mangos. To
mangos apples
0
0
6
2 5
?
16 determine the number of apples in another ratio, students multiply 5 mangos by 3. Thus, students are able to determine the missing value and to understand that the numbers on the second ratio is 2,5 times the numbers on the first ratio. In addition, students are able to see the composed unit since the paired numbers are aligned and connected (Orrill & Brown, 2012).
Double number line is an appropriate model for students in grade five. As mentioned before, students in grade five do not only involved integers but also decimals and fractions. According to Abels et al. (2006), double number line serves many advantages such as it gives visual support and allows students to have an accurate calculation. Moreover, double number line has the same nature as number line, numbers on the lines are well ordered. It allows students to directly observe the relationship between numbers on the lines, especially to reason that numbers on the right side are greater than numbers on the left side. In addition, Küchemann et al. (2014) suggested to use double number line to learn about ratio. To be more specific, double number line support students in relating numbers within ratio and between ratios using multiplicative comparison.
F. Realistic Mathematics Education
17 2003), who thought that mathematics should be connected to the reality. Freudenthal (1991) proposed that children should experience mathematics as a human activity. Mathematics will be more relevant and meaningful for children if they are allowed to investigate the solution of problems using their own strategy.
Even though mathematics should be meaningful for children, it does not mean that the context should be real and exists in real life. Since the word ‘realistic’ in Dutch means ‘able to imagine’, it is possible for the teacher to
make up the context. At least, by using the made-up context, students are able to imagine (van den Heuvel-Panhuizen, 2003).
Choosing and designing contexts are important in developing learning sequences. To support students in building their own understanding, it is also important to design learning sequences according to the three key principles of RME which were proposed by Gravemeijer (1997).
1. Reinvention/mathematising
The idea of the first key principle is to give students an opportunity to experience the same process as the process of how a specific concept of mathematics was invented. By having a discussion and informal talk, students will develop their informal knowledge to formal knowledge (Freudenthal, 1991).
18 length of an object as a reference to measure the length of a room. The problems also ask students to express the length of a room using the length of an object. When students use their references to mark and measure the length of the room on the picture, they have their own illustration of the informal model. In another lessons, we also ask students to draw an illustration which represents the relationship between two quantities such as double scale line and double number line.
2. Didactical phenomenology
To define phenomenology more clearly, Freudenthal (1999) described mathematical objects as nooumena. In addition, experiencing a mathematical object can be called as phainomenon. Freudenthal (1983, as cited in Gravemeijer & Bakker, 2006) also distinguished phenomenologies into mathematical phenomenology, historical phenomenology, and didactical phenomenology. Here are the descriptions for each phenomenology.
19 We involve contexts related to scaling as a didactical phenomena. For the context, Roberge and Cooper (2010) suggested to use a context which is familiar with students’ surrounding and continue the context with a new
situation. Students are familiar with environment around their home and school. In this study, we design the first activity with plan context and continue to larger area, for example travelling to different cities using maps. In plan and map contexts, students will use a reference.
According to Streefland (1991), mathematical activities involving the reference promotes the notion of comparison and multiplication. Students compare the reference to determine how many times the reference fits the length of the object or the path. In this case, the reference becomes the representation of fraction (Roberge & Cooper, 2010). It is also possible to include following problems involving real distance and travel time. Using the length of the path, students can determine the total travel time by multiplying the given time for a certain distance to the number of reference fits the path.
20 Figure 2.5. Levels of emergent model (Gravemeijer, 1997)
3. Self-developed models
Models may support students in learning mathematical concepts, especially to bridge informal and formal knowledge (Gravemeijer, 1997). There are different levels in which the informal model of shifts to the formal
model for. In this study, we use double number line as a model to support students in solving ratio problems. We will describe each level of models as seen in figure 2.5 and its connection with the study.
a. Situational level
In the first level, students use strategies which are within the context of the situation (mainly out-of-school situations) (Gravemeijer, 1997). Students’ strategies in solving problems depend on their prior
knowledge. In the study, we provide problems which involve students’ prior knowledge in making and using a reference as a scale line. Students use the length of a reference to determine how many time it fits the length of an object. While comparing and iterating the reference on the object, students make their own illustration to represent the comparison between the length of the reference and the length of the object.
b. Referential level
21 in this level becomes a model of for problems. In the study, the scale line develops to the double scale line. Students will be asked to illustrate the relationship between distance on the map and real distance into a double scale line. The double scale line considers the precise measurement. Therefore, the model will be more like a ruler, in which spaces between numbers are important.
c. General level
After some time, the focus of the model shifts towards the mathematical relations (Gravemeijer, 2004). In the general level, the model becomes a
model for for the mathematical activity. Later in the study, it is unnecessary for students to preserve the precise mesurement between numbers on the model. As the context is not always about finding the real distance, students shift the model to the formal double number line. d. Formal level
In the last level, students will work with conventional procedures and symbols (Gravemeijer, 1997). Students will not need the model to solve ratio problems. The focus is to elicit the multiplicative comparison using the formal method.
G. Indonesian Mathematics Curriculum
22 We provide the standard competence and the basic competence of learning ratio for students grade five in table 2.1.
Table 2.1. The concept of ratio and scale in the Indonesian mathematics curriculum (Kemendikbud, 2013)
The Standard and Basic Competence in Grade 5 3. Understanding the factual and
conceptual knowledge by observing and asking about their environment
3.4 Learning the concept of ratio and scale
H. Social Norms, Socio-mathematical Norms and the Role of Teacher
The notion of social norm comes from a situation where a person is involved in a specific environment (Tatsis & Koleza, 2008). To interact well, the person must agree to the written or unwritten rules set in the environment. A social norm is general and can be found in different situations (Yackel & Cobb, 1996), for example in a mathematics classroom. However, we cannot say that norms in the mathematics classroom are socio-mathematical norms. Socio-mathematical norms are unique and can be applied only in the mathematics classroom.
23 mathematicals knowledge.
A certain classroom culture contributes to the mathematics reformation (Gravemeijer, 2004). One of affecting elements in the classroom is the teacher. Since it is important to raise students’ awareness of what they are capable of in the mathematics classroom, the role of the teachers is important. Teachers support students by asking questions or making explicit statements on why a students’ strategy in solving a problem counts as a good strategy. In addition,
the teacher may ask students to reason how their answers are different compared to other students’ answers.
In the study, the role of the teacher is to focus on supporting students to discuss about concepts related to ratio. For example, the teacher can conduct a discussion about a scale line, double scale line, and double number line during the lessons. During the discussion, the teacher may ask questions such as what students know about the term, what students can derive from the term, what information the model holds, and what differences and similarities among those models. In addition, the teacher should give an example to distinguish between difference and comparison. The teacher may ask students what they know about ratio. Later, using students’ understanding about ratio, the teacher gives
reinforcement that difference denotes the notion of subtraction and addition while comparison denotes the notion of multiplication and division.
24 According to literature review, students often use subtraction and addition to determine missing value. The teacher should suggest students to focus on multiplicative comparison between numbers on ratios. The teacher should discuss students’ answers. For example, the teacher invites students to discuss
what effect students will face if they are using subtraction and addition or multiplication and division to solve problems.
I. Local Instruction Trajectory
25 CHAPTER 3
METHODOLOGY
A. Research Approach
As mentioned before, the study and the development of local instruction theory on the teaching and learning of ratio and scale is rare, especially in Indonesia. According to the research question of the study: How can the double number line support students in learning ratio and scale problems?, we aim to design learning sequences on ratio and scale. Moreover, the study wants to find out how the learning sequences enable students to learn about ratio and scale. In other words, the study aims to innovate the current learning and to contribute to the development of local instruction theory on ratio and scale. The aim of the study fits with the design research approach because it gives insights about innovative ways of teaching (van Eerde, 2013).
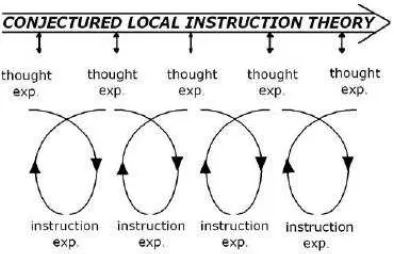
According to Gravemeijer and Cobb (2006), there are three steps in carrying out design research. In each step, the designed HLT has its own function. In this section, we will mention and connect the steps to the study. 1. Preparing for the experiment
26 HLT becomes a guideline for the researcher to develop the design instructional materials in the preparation phase (Bakker, 2004).
Other than that, we perform interview with the teacher and class observation to find out socio norms, socio-mathematical norms, and the teaching-learning process in the classroom. To find out whether students have a notion on a multiplicative comparison and on using double number line to solve ratio problems, we carry out a pretest. Problems in the pretest are based on the literature review on ratio and scale.
2. Experimenting in the classroom
According to Gravemeijer and Cobb (2006), the aims of experiment are to test conjectures on the HLT and to understand how conjectures work. In this step, the HLT becomes a guideline for the teacher and the researcher to focus on every activity in the learning sequences, especially the teaching-learning activity, interview, and observation (Bakker, 2004). There are three stages of cyclic process in experimenting: testing, understanding, and developing the learning trajectory. The cyclic process aims to improve the HLT for the next cycle.
27 Figure 3.1. Micro cycles form and shape the local instruction theory
(Gravemeijer & Cobb, 2006)
Once the first cycle has finished, the researcher analyzes all collected data and compares the HLT to the actual learning. The researcher finds out things to be improved or revised for the design. The improved HLT is carried out on the second cycle.
3. Conducting a retrospective analysis
In general, the aim of the retrospective analysis is to contribute to the development of a local instruction theory (Gravemeijer & Cobb, 2006). In this step, the HLT becomes a guideline for the researcher to determine the focus of the analysis in the retrospective analysis (Bakker, 2014).
28 B. Data Collection
1. Observation
In order to gain an overview about the classroom and the participants, the researcher observes the learning in the classroom. The researcher pays attention to the way the teacher manages the class and conducts the lesson, the interaction among students, and the interaction between the teacher and students. In specific, the focus of the observation is socio norms and socio-mathematical norms in the classroom. The researcher makes field notes according to the observation scheme (see appendix A) and video registration during the observation.
2. Semi-structured interview
After the observation, the researcher interviews the teacher to ask questions according to the observation. The interview is conducted according to the interview scheme (see appendix B) to obtain the intended information. Through the interview, the researcher gains more information not only about what happens in the classroom but also things which the researcher cannot observe in the class, for example the background of the teacher, learning material and teaching method the teacher used on ratio and scale, and students’ knowledge. The researcher makes recordings of the interview for
29 3. Pretest
Before the researcher starts implementing the lesson, a pretest is conducted. The pretest consists of five problems on the topic of ratio and scale (see appendix C). In general, the goal of each item is to determine students’ ability in using multiplicative comparison to solve ratio problems. Moreover, we want to find out whether students use representations to help them solve problems.
The researcher also conducts an interview and makes video registrations to gain information about how students understand the topic of ratio and scale and on how students solve problems. In the first cycle, the researcher interviews students who become the participant of the pilot study. In the second cycle, the researcher interviews the focus group students.
4. The pilot study (first cycle)
The first cycle becomes a pilot study which aims to try out the designed HLT and involves five students of class 5B who are intermediate achievers according to the teacher’s recommendation. In the first cycle, the researcher
becomes the teacher. With the help of observer, the researcher collects students’ written work, and makes field notes and video registration on the
30 5. The teaching experiment (second cycle)
In the second cycle, the researcher implements the improved HLT. The teaching experiment involves 34 students from class 5C and the regular mathematics teacher. There is one focus group consists of four students with the intermediate level of mathematics according to the pretest and the teacher’s recommendation. In the second cycle, the teacher is the regular
mathematics teacher in that class while the researcher acts as the observer. The researcher collects students’ written work, makes field notes and
video registrations. There are two video recorders to record the activity and discussion in the focus group and the activity of the whole class.
6. Posttest
Once the researcher has finished implementing all the five lessons, the researcher conducts a posttest in each cycle. The posttest aims to find out the development of students’ understanding about ratio, especially the
31 7. Validity and reliability
Validity and reliability are important in the data collection to derive valid and reliable conclusion. In general, validity means whether the instruments truly measure what it intends to measure while reliability means the independency of the researcher (Bakker & van Eerde, 2014).
To improve the validity, the researcher consults the design materials to experts. In data collection, the researcher collects data using different methods. The collected data is triangulated in the analysis. The data triangulation also contributes to the internal validity of data collection. Furthermore, the natural learning environment, in which the teacher conducts the lessons and the learning happens in a regular classroom, promotes the ecological validity of the study. To increase the reliability of the data collection, the researcher obtains video registrations by using video recorders.
C. Data Analysis 1. Observation
32 2. Semi-structured interview
This study analyzes the interview recording as the same as in analyzing the fragments in observation. Together with the result of observation analysis, the result of analyzing transcripts and fragment of interview is aiming to improve the HLT and to support the conclusion of the study.
3. Pretest
The researcher analyzes the pretest in both cycles qualitatively by looking at students’ reasoning in solving ratio problems. The pretest analysis
aims to determine students’ knowledge about ratio and scale. Important fragments from the interview reveal students explanation on solving problems. The researcher describes and use fragments to support students’
written work.
The result of the pretest can be used to improve the HLT about students’
prior knowledge. Along with the recommendation from the teacher, the result of the pretest in the second cycle is used to determine the focus group students.
4. The pilot study (first cycle)
In this study, the researcher analyzes the collected data by comparing the designed HLT to the actual learning. The researcher chooses important fragments from video registrations about students’ thinking, especially in
33 number line to solve the problems. These fragments give information about the occurrence of the conjectures. Together with the fragments, the researcher uses relevant field notes and students’ work to illustrate and
describe students’ thinking. The result of the analysis of each lesson is used
to improve the HLT for the next lesson while the result of the whole analysis is used to improve the HLT for the next cycle.
5. The teaching experiment (second cycle)
The researcher analyzes the collected data in the second cycle by selecting and describing important fragments from video registrations. In general, the researcher chooses important fragments to confirm or to refute conjectures in the HLT. Since the result of the retrospective analysis is to answer the research question, it is important for the researcher to choose a fragment which shows students solving problems using the double number line and multiplicative comparison. The researcher interprets the fragments together with relevant field notes and students’ written work as an illustration of
students’ thinking. To analyze students’ written work, the researcher uses
conjectures to compare it to the actual students’ work.
6. Posttest
34 example of important segments is the fragment shows students explaining their method in solving problems. From the posttest, the researcher also derives supporting arguments about the development of students’ understanding in learning ratio and scale, especially in using a double number line and a multiplicative comparison to solve ratio problems.
7. Validity and reliability
Bakker and van Eerde (2014) classified validity and reliability into internal and external aspects. In the study, the researcher tests the data with the HLT. From the analysis, the researcher adjusts and improves the HLT for the next lesson and cycle. This process contributes to the internal validity.
External validity is related to the generalizability of the result which can be used in different contexts (Bakker & van Eerde, 2014). To improve the generalizability of the study, thick description is needed. In the study, the researcher provides the description and interpretation on the actual and observed learning. In addition, the researcher considers the diversity of environment conditions such that others can adjust the design according to their own condition.
35 explains explicitly about the process and the result. Therefore, the readers can follow the line of this study.
D. Research Subject
36 CHAPTER 4
HYPOTHETICAL LEARNING TRAJECTORY
Before carrying out a design research study, a researcher needs to design learning sequences. A researcher has to find out the prior knowledge of students to learn the topic and decide the end point of the learning. Every learning sequence contains planning about how the learning will be implemented, which is called hypothetical learning trajectory (HLT). It is important for a researcher to have HLT according to background theories. HLT provides an insight about the focus of each learning. According to Simon (1995), an HLT consists of three components: the learning goals, the learning activities, and conjectures of students’ answer.
37 before researchers implementing the next cycle.
In this study, we focus on developing a local instruction theory on ratio and scale. Using information on the preparation phase, such as reviewing literature and interviewing the teacher about students’ prior knowledge, we design five lessons
which aim to support students to learn about ratio using double number line. Each lesson has its own learning goal. We provide the instructional activities for learning ratio as follows.
A. Lesson 1
1. Starting points
In previous grades, students have learned about expressing inequality informally by comparing a pair of opposite characteristics, estimation, multiplication, and division. Before students learn about ratio, they have learned about fraction and decimal. Using the preliminary knowledge, we would like to allow students to develop their knowledge. Thus, we assume that students have starting points such as:
Students are able to estimate the length of an object Students are able to compare two quantities
Students are able to use multiplication and division
Students are able to present numbers into fractions and decimals
2. The learning goals
38 Students are able to use the length of a reference to describe the length
of an object.
Students are able to use the scale line to describe the real length. Students are able to make and to use a scale line in a plan.
3. Description of activity Activity 1
Problem 1a
The teacher starts the lesson by displaying the picture of a studio plan. The purpose of displaying a picture of a studio plan is to trigger students to come up with the notion of a scale line. To support students, the teacher asks information students usually get from a plan and leads students to mention about scale. These are questions the teacher can ask students:
“What do you know about scale?”
“Where do you find scale other than in a plan?” “What representation do you use to illustrate scale?”
A scale can be in different forms. As in a plan, it can be in numeric or illustration such as a scale line. Some students might not familiar with a scale line. Thus, the teacher supports students by telling that a scale line is a line which contains a certain scale.
39 teacher asks students to imagine it is in a real condition, therefore it is impossible to use a ruler because it will be inefficient. Besides, the focus is not about being precise in measuring but describing how many times the length of an object fits the length of another object. The teacher suggests students to use a paper strip as a ruler. If students have no idea, the teacher may lead students to use furniture on the plan to measure the dimension of bedroom. An object which students use to measure is called reference. Once students are able to use the reference, the teacher proceeds to students’ worksheet. Figure 4.1 illustrates the problem. The teacher narrates the context:
“An architect draws a studio plan. However, he does not write the
measurement of the studio. If people who are interested in buying the studio
want to know the measurement of the studio, what will they do?”
To emerge discussion, the teacher gives students some time to think and to Below is a studio plan.
Choose an object on the plan as your reference. Make a scale line with the same length as your reference.
Use the blank plan to measure the coloured walls. Make an illustration to determine how many times your reference fits the coloured walls. KITCHEN
BATHROOM
BEDROOM
40 discuss with their friends. We provide conjectures of students’ answer in table 4.1.
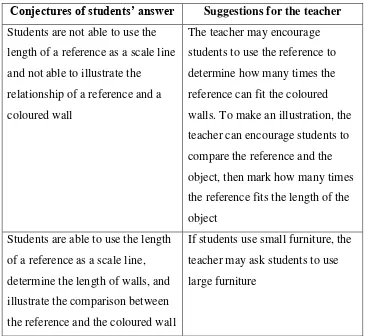
Table 4.1. Conjectures of students’ answer for problem 1a in lesson 1
Conjectures of students’ answer Suggestions for the teacher Students are not able to use the
length of a reference as a scale line and not able to illustrate the
relationship of a reference and a coloured wall
The teacher may encourage students to use the reference to determine how many times the reference can fit the coloured walls. To make an illustration, the teacher can encourage students to compare the reference and the object, then mark how many times the reference fits the length of the object
Students are able to use the length of a reference as a scale line, determine the length of walls, and illustrate the comparison between the reference and the coloured wall
If students use small furniture, the teacher may ask students to use large furniture
Once students finish working, the teacher conducts class discussion. The teacher can discuss about different references give different measurements. For example, to fit the orange wall using the length of a bed, we need two times of the bed’s length. However, when we use the length of a couch, we
41 walls.
Problem 1b
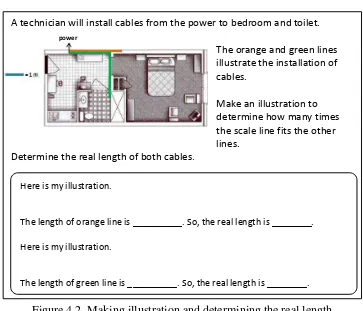
The context of the problem is as the same as the previous problem. Students will encounter a problem which involves a scale line with a specific measurement as in figure 4.2. The problem promotes students to make their own model to compare the length of a scale line and the cables.
Students will be given some time to think and to discuss with their friends. We provide conjectures of students’ answer in table 4.2.
A technician will install cables from the power to bedroom and toilet. The orange and green lines illustrate the installation of cables.
Make an illustration to determine how many times the scale line fits the other lines.
Determine the real length of both cables.
Here is my illustration.
The length of orange line is __________. So, the real length is ________.
Here is my illustration.
The length of green line is __________. So, the real length is ________.
power
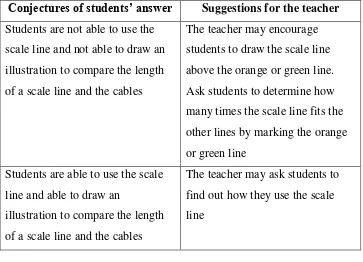
42 Table 4.2. Conjectures of students’ answer for problem 1b in lesson 1
Conjectures of students’ answer Suggestions for the teacher Students are not able to use the
scale line and not able to draw an illustration to compare the length of a scale line and the cables
The teacher may encourage students to draw the scale line above the orange or green line. Ask students to determine how many times the scale line fits the other lines by marking the orange or green line
Students are able to use the scale line and able to draw an
illustration to compare the length of a scale line and the cables
The teacher may ask students to find out how they use the scale line
In the class discussion, the teacher needs to point out the illustration students make to illustrate how many times the scale line fits the cables. The illustration will be students’ own construction model. There are questions
the teacher can ask to students in the class discussion: “What do you know about the blue line on the problem?” “What the blue line represents?”
“How do you use the blue line to measure the orange and green line?” Activity 2
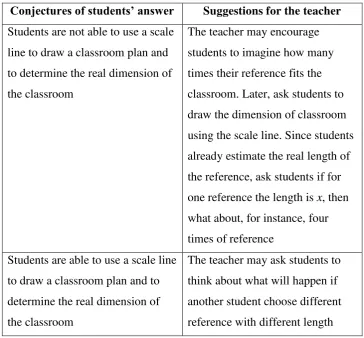
43 Table 4.3. Conjectures of students’ answer for activity 2 in lesson 1
Conjectures of students’ answer Suggestions for the teacher Students are not able to use a scale
line to draw a classroom plan and to determine the real dimension of the classroom
The teacher may encourage students to imagine how many times their reference fits the classroom. Later, ask students to draw the dimension of classroom using the scale line. Since students already estimate the real length of the reference, ask students if for one reference the length is x, then what about, for instance, four times of reference
Students are able to use a scale line to draw a classroom plan and to determine the real dimension of the classroom
The teacher may ask students to think about what will happen if another student choose different reference with different length
In a class discussion, it is important to point out how students use a reference as a scale line to draw the classroom plan. Students might choose
Make a plan of your classroom. Choose an object as your reference. Use the reference as a scale line to draw the plan. Describe the dimension of your classroom.
I use ___________ as a reference. I estimate its real length is _________. Below is my scale line:
Below is my classroom plan:
44 different references and different estimations for the length. The teacher can discuss how different references and different lengths may affect students’
classroom plan.
B. Lesson 2
1. The learning goals
Students are able to work with a double scale line.
Students are able to use information about real distance and distance on the map to determine which map fits the given double scale line.
Students are able to illustrate the relationship between the distance on the map and the real distance into a double scale line.
Students are able to use the double scale line to determine real distances.
2. Description of activity Problem a
The teacher starts the lesson by asking following questions related to a map:
“What information you can get from a map?”
“Have you ever seen a double scale line? What do you know about it?” “Why do you think it is called as a double scale line?”
“Why there are two lines on a double scale line?”
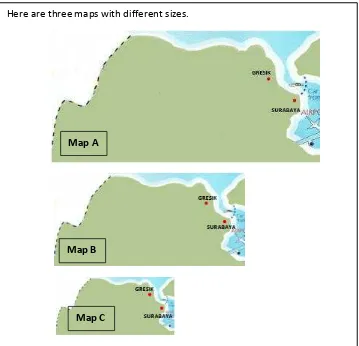
45 information given on the problem and to discuss with their friends. In this lesson, students are allowed to use a ruler to measure. Figure 4.4 illustrates the problem. We provide conjectures of students’ answer in table 4.4.
Figure 4.4. Here are three maps with different sizes.
A map usually has a double scale line. Below is the double scale line.
Given the distance from Gresik to Surabaya is 15 km, determine which map fits the double scale line. What will happen to other maps if those maps use the provided double scale line? Explain your answer.
Map A
Map B
Map C
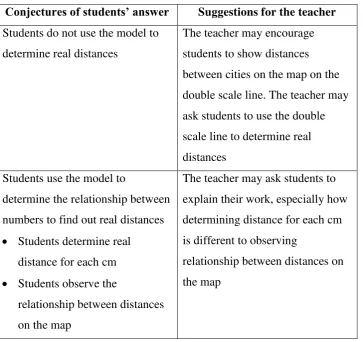
46 Table 4.4. Conjectures of students’ answer for problem a in lesson 2
Conjectures of students’ answer Suggestions for the teacher Students have no idea on working
with the double scale line
The teacher may remind students about why there are two lines on a double scale line and what
information it holds Students are able to determine
which map fits the double scale line but they are not able to reason for other maps
The teacher may encourage students to compare 15 km on the double scale line to the two other maps
Students are able to determine which map fits the double scale line and able to reason for other maps
The teacher may ask students to show his reason using different distances from the three maps and the double scale line
In a class discussion, the teacher points out what will happen to other maps if those maps use the provided double scale line. Moreover, the teacher leads students to discuss why a double scale line on a map should represent the precise measurement. Other than that, the teacher may direct the discussion to ratio. The teacher tells students that a double scale line is a way to illustrate ratio and that ratio is a comparison between two quantities. The teacher may discuss ratio in depth relating to the double scale line by asking following questions:
“What do you know about ratio?”
47 Problem b
Once students have determine the map which fits the double scale line, students will have to draw double scale lines for two other maps. Figure 4.5 shows the problem. We provide conjectures of students’ answer in table 4.5.
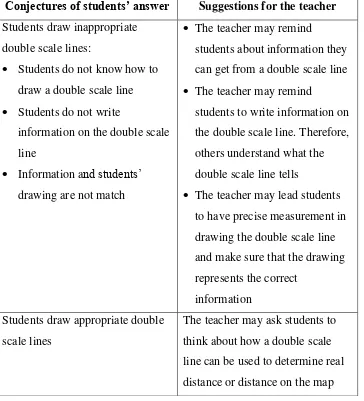
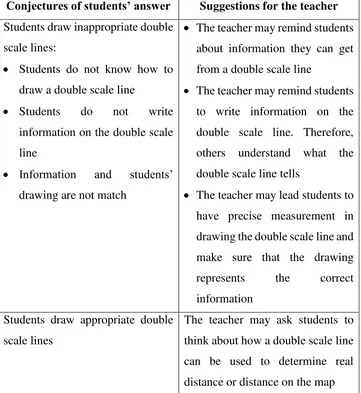
Table 4.5. Conjectures of students’ answer for problem b in lesson 2
Conjectures of students’ answer Suggestions for the teacher Students draw inappropriate
double scale lines:
Students do not know how to draw a double scale line Students do not write
information on the double scale line
Information and students’ drawing are not match
The teacher may remind
students about information they can get from a double scale line The teacher may remind
students to write information on the double scale line. Therefore, others understand what the double scale line tells
The teacher may lead students to have precise measurement in drawing the double scale line and make sure that the drawing represents the correct
information Students draw appropriate double
scale lines
The teacher may ask students to think about how a double scale line can be used to determine real distance or distance on the map
You have determine which map fits the double scale line. Draw double scale lines for the other maps.