Jurnal Ekonomi dan Studi Pembangunan Volume 16, Nomor 2, Oktober 2015, hlm.210-219
MICROECONOMICS ANALYSIS OF HEALTH CARE UTILIZATION:
EVIDENCE FROM INDONESIA FAMILY LIFE SURVEY
Andika Ridha Ayu Perdana
Faculty of Economics, Universitas Islam Indonesia
Ringroad Utara Condongcatur, Depok, Sleman, Yogyakarta 55283 Indonesia. Phone: +62 0274 881546. Corespondence email: [email protected]
Received: October 2014; accepted: September 2015
Abstract: There are still many health problems faced by most people in Indonesia such as problems of diseases, availability of medicines, health services, provision of health insurance, access to health facilities, problems with traditional healers, problems of malnutrition, and utilization of health service. Utilization can be categorized as one of health problems if the people do not utilize health service. This study aims to identify the determinants of utilization of health service in Indonesia. Data used in this study is from Indonesia Family Life Survey (IFLS), the third and fourth waves. From the results, it can be concluded that people aged between 15 74 years old have positive relation in probability to use health and medical services. People with higher level of education tend to use health service when get sick, but does not affect them to do self-treatment and use public or private health facilities. Having insurance is very important and affecting people to utilize health and medical service, it also affects people to choose public health service. Distance to hospital, better facilities of health services, and some types of illnesses are also significant. These results can be used as references for government to make policies in order to solve health problems in Indonesia.
Keywords:health services; public health facility; IFLS; linear probability model JEL Classification:I11, I15
Abstrak:Banyak masalah kesehatan yang dihadapi oleh kebanyakan orang di Indonesia seperti masalah penyakit, ketersediaan obat-obatan, pelayanan kesehatan, penyediaan asuransi kesehatan, akses ke fasilitas kesehatan, masalah dengan dukun, masalah kekurangan gizi, dan pemanfaatan kesehatan layanan. Pemanfaatan dapat dikategorikan sebagai salah satu masalah kesehatan jika orang tidak memanfaatkan pelayanan kesehatan. Studi ini bertujuan untuk mengidentifikasi factor-faktor yang berpengaruh terhadap penggunaan fasilitas kesehatan di Indonesia. Data yang digunakan dalam studi ini adalah dari Survei Kehidupan Keluarga Indonesia (IFLS), gelombang ketiga dan keempat. Hasil penelitian yang diperoleh memberikan kesimpulan bahwa orang berusia antara 15 - 74 tahun memiliki hubungan positif dalam probabilitas untuk menggunakan kesehatan dan pelayanan medis. Orang-orang dengan tingkat pendidikan yang lebih tinggi cenderung menggunakan pelayanan kesehatan ketika sakit, tetapi tidak mempengaruhi mereka untuk melakukan pengobatan sendiri dan menggunakan fasilitas kesehatan publik atau swasta. Memiliki asuransi sangat penting dan mempengaruhi orang untuk memanfaatkan kesehatan dan pelayanan medis, juga mempengaruhi orang untuk memilih pelayanan kesehatan masyarakat. Jarak ke rumah sakit, fasilitas yang lebih baik dari pelayanan kesehatan, dan beberapa jenis penyakit juga signifikan. Hasil ini dapat digunakan sebagai referensi bagi pemerintah untuk membuat kebijakan dalam rangka memecahkan masalah kesehatan di Indonesia.
INTRODUCTION
Health becomes a critical problem in some countries particularly in developing countries including Indonesia. Economic growth and wellbeing of population need a good health (Mwabu, 2008). According to Ritonga (2007), health is one of factors underlying people capa-bility which becomes a basic dimension that must be owned by everyone. Health status of population can be assessed based on rate of life expectancy, infant mortality, and children under-five mortality. Indonesia experienced increasing in health status signed by the in-creasing in life expectancy rate (from 1999 to 2005, increased from 66.2 percent to 68.1 per-cent) and decreasing in infant (from 1990 to 1999, decreased from 71 to 46 points) and chil-dren under-five mortality rate (at the same range of years, decreased from 99 to 59.55 points)1. Nevertheless, there are still many problems related to health that would be obsta-cles for the development if not be immediately tackled.
Health issues in Indonesia are very com-plex, ranged from problems of diseases (chroni-cally and acute as well as communicable and non-communicable ones), availability of medi-cine, health services, provision of health insur-ance, access to health facilities, problems with traditional treatment, until the problems of malnutrition and the kinds of. Utilization of health facility can be considered as one of the issues when people facing difficulties in accessing health facilities. In some areas in Indonesia, especially in poor areas, people still find the difficulties. Triratnawati (2006) states that most of Indonesia health care centers are underutilized for example in Purworejo, Cen-tral java. Ariani2 also finds underutilization of health service and high infant mortality rate in some areas in eastern Indonesia. She finds peo-ple in eastern Indonesia prefer to use self-medi-cation than go to health facility because of lack
1 Statistics Indonesia, Population Reports (Visited August, 20 2009)
2 Potret Ketertinggalan Sumber Daya Manusia di Kawasan Timur Indonesia
(http://bto.depnakertrans.go.id/download/Jurnal/POTR ET%20KETERTINGGALAN%20SUMBER%20DAYA%20M ANUSIA.doc) visited September , 19 2009.
of access and limited number of health facilities available. However, this does not predomi-nantly occur in Indonesia. Much of population in South Asia lacks of access even to the most basic health care, it can be seen from the high rate of maternal and children death each year, and it becomes a problem. (Janjuaet al, 2006).
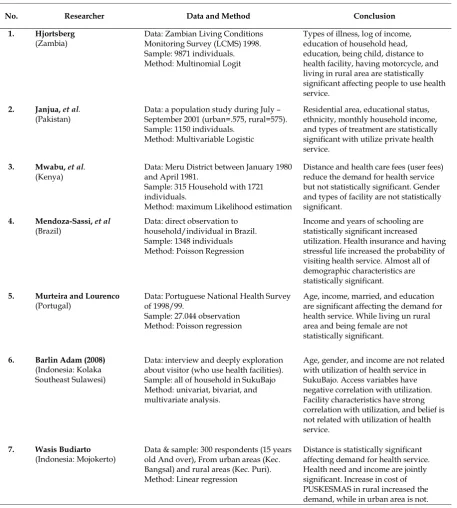
Amelioration of individuals health be-haviors (increase in utilize health service) can raise their health outcomes. Gakunju (2003) states that as the health facility utilization increased, the indicators of health status such as infant mortality rate and life expectancy are improved as well. Tildenet.al.(2006) have ana-lyzed health status and health care utilization pattern in Indonesia between 2000 and 2004. He finds utilization and inpatient care increased, and outpatient care is greater than no treat-ment. He also finds better improvements in three parameters of health status (infant and children under-five mortality rate and also life expectancy) at the same time. From the analysis found by Tilden et al (2006), it can be concluded that raise in health care utilization can improve people s health status. Other study found by Strauss and Thomas (2007) who analyzes pop-ulation health and economic development. They assume that there is a static health pro-duction function for an individual where health outcomes depend on individual s health inputs and behaviors. One of conclusions from the analysis is improvement in health inputs and behaviors are influential toward health out-comes and health development. Geda and Shimeles (2009) also find that access to basic health service plays a very important role in affecting health outcomes. They find improve-ment in health outcomes are in conformity with increase in seeking health care in Ethiopia. There are also several previous studies related to utilization of health service presented in Table 1.
manifested in form of mistargeted health pro-gram. Susantoet al(2006) find that in provision of health service provided by the state, people with higher economic status have a better access for the health service than people with lower economic status. From the results of evaluation program of basic health care for the poor community, utilization of basic health care facilities is too low, under the national digit 15%.
Other supports that the poor especially in developing countries are less to receive effective health care (O Donnell 2007: 2820). Therefore, the problem of utilization is usually faced by poor people. According to Susanto (2006), the low of health care utilization can be affected by some factors such as (1) the descent of purchasing power parity, (2) the descent of the interest to go to the health sub center, and (3) access to the health care is difficult.
Table 1. Previous studies related to utilization of health care
No. Researcher Data and Method Conclusion
1. Hjortsberg
Types of illness, log of income, education of household head, education, being child, distance to health facility, having motorcycle, and living in rural area are statistically significant affecting people to use health service.
2. Janjua,et al. (Pakistan)
Data: a population study during July September 2001 (urban=.575, rural=575). Sample: 1150 individuals.
Method: Multivariable Logistic
Residential area, educational status, ethnicity, monthly household income, and types of treatment are statistically significant with utilize private health service.
3. Mwabu,et al. (Kenya)
Data: Meru District between January 1980 and April 1981.
Sample: 315 Household with 1721 individuals.
Method: maximum Likelihood estimation
Distance and health care fees (user fees) reduce the demand for health service but not statistically significant. Gender and types of facility are not statistically significant.
Income and years of schooling are statistically significant increased utilization. Health insurance and having stressful life increased the probability of visiting health service. Almost all of demographic characteristics are statistically significant.
5. Murteira and Lourenco (Portugal)
Data: Portuguese National Health Survey of 1998/99.
Sample: 27.044 observation Method: Poisson regression
Age, income, married, and education are significant affecting the demand for health service. While living un rural area and being female are not statistically significant.
6. Barlin Adam (2008) (Indonesia: Kolaka Southeast Sulawesi)
Data: interview and deeply exploration about visitor (who use health facilities). Sample: all of household in SukuBajo Method: univariat, bivariat, and multivariate analysis.
Age, gender, and income are not related with utilization of health service in SukuBajo. Access variables have negative correlation with utilization. Facility characteristics have strong correlation with utilization, and belief is not related with utilization of health service.
7. Wasis Budiarto (Indonesia: Mojokerto)
Data & sample: 300 respondents (15 years old And over), From urban areas (Kec. Bangsal) and rural areas (Kec. Puri). Method: Linear regression
Health should be prioritized in national development in order to achieve welfare of society. Health development is a form of change in health sector where people s health condi-tions have increased, there is improvement in healthy lifestyle, society has a healthy environ-ment, and people trust to medical care facility to treat them. According to Juanita (2000), health development is a process of change in the level of people s health from poor levels to the better in accordance with health standards. Despite the concept of health development is to promote national development, in reality health development is not in the mainstream of national development. This is the cause of many health problems in Indonesia. Post-decentrali-zation in 2001, health system in Indonesia is little changed. Changes may occur due to a pre-vious transfer of authority by the central gov-ernment to be a responsibility of local govern-ment. According to Indonesian Health Profile by World Health Organization, decentralization gives impact on health system such as health financing, health information system, human resources for health, and the existence of health facilities in Indonesia. With these changes, the possibility of health problems occurred may be greater. For example, as reported by World Health Organization, decentralization is one of factors that cause mal distribution, low produc-tivity and poor quality of health workers. In addition, the health information system will also be affected because of the partial break-down. This far, it can be concluded that health development in Indonesia is still not good enough even though the purpose of decentrali-zation is to improve national development.
The government has tried to improve health conditions of the society through variety of ways. One of the ways is providing health insurance especially for poor people where the government can help them overcome the prob-lem of medical costs. However, the impprob-lemen- implemen-tation is sometimes not necessarily according to plan. In solving various health problems in Indonesia, the government has directed health development to be better. After health sector reform in 1998, the government has formulated the vision, mission, and strategy of health development in the next ten years known as Indonesia Sehat 2010 . Ministry of health
stated that the vision, mission, and strategy of Indonesian society are formed to achieve a cer-tain health level such as living in a healthy environment, practice the behavior of clean and healthy, able to utilize health, achieving high rate of health. These four things are the main objectives on making vision, mission and development strategy, and the process of achieving these goals are still going on until now. The third objective is related to this study which looks at how people utilize health service and what factors influence people to utilize or not utilize health service.
Therefore, analyzing health service utiliza-tion in Indonesia is very interesting. The analy-sis will give the real situation of people s behavior when ill and give information related to factors that influence people to use health facility or not. The results of this analysis can be used as references in making policy in order to solve health problems in Indonesia.
RESEARCH METHOD
This study uses a simple model to establish relationship among interest variables (onHjorts-berg, 2003: 759). It can be simplified with the following model modified from Hjortsberg (2003):
C = f (D,T,F,I) 1)
Where:C: Individual choice when get sick (uti-lize, choice, factype; D: vector indicates demo-graphic characteristics; T: vector indicates dis-tance (time) to health facility from head office;
F: vector indicates facility characteristics; I: vector indicates types of Illness
in 1993, the second wave in 1997, the third wave in 2000, and the fourth wave in 2007. There is a follow up survey (IFLS2+) was conducted in 1998 to measure the impact of crisis happened in Indonesia. This study is using the third and fourth waves of the data. Reasons of using this data are firstly, the information related to what to be studied is available in this data. Secondly, IFLS is the most complete family data survey in Indonesia. IFLS give information about the life of the respondents, households, families, and communities where the respondents live. There are two main data in IFLS. The first is house-hold data and the second is community facility data. We use both of those data. STATA 9.1 used as a data processing tool. It provides an appropriate longitudinal data analysis and regression. For IFLS data, employing STATA is recommended. STATA is powerful econometric and statistical software (Stock and Watson, 2003). According to Tawi (2008), STATA can analyze data survey which the sample is not usually gained by simple random sampling. This study uses Linear Probability Model (LPM) as tool of analysis. LPM is one of econometrics model for analyzing probability. This model assumes that the probability is linear to the ex-planatory variables and explains two dichoto-mous choices situation (yes or not). Fixed effect and non-fixed effect are used as regression method. There are some considerations to choose whether will use fixed effect or non-fixed effect. If there is an assumption thatuiand
X are uncorrelated, non-fixed effect may be appropriate, However ifuiandXare correlated, fixed effect is more appropriate. This study is using stepwise on regression where firstly regress only the demographic characteristics, then regress demographic characteristics plus distance to health service, the third plus facility characteristic, and the last plus types of illness. These regression methods appropriate with the model formed below.
There are four models of analysis formed in this study. Each model will be explained as follows:
MODEL1 = Demographic Characteristics
Yi = 1 + 2adult* + 3fml + 4fmlhh +
5educ + 6lnpce1 + 7lnpce2 +
8rural + 9h_vec +
b10ins_ask + Ui 2)
MODEL2 = Demographic Characteristics + Distance to health service
Yi = 1 + 2adult* + 3fml + 4fmlhh +
5educ + 6lnpce1 + 7lnpce2 +
8 rural + 9h_vec + 10ins_ask +
11d* + Ui 3)
MODEL3 = Demographic Characteristics + Distance to health service + Facility character-istics
Yi = 1 + 2adult* + 3fml + 4fmlhh +
5educ + 6lnpce1 + 7lnpce2 +
8 rural + 9h_vec + 10ins_ask +
11d* + 12pp* + 13pusk* +
14vilmdwf + Ui 4)
MODEL4 = Demographic Characteristics + Distance to health service + Facility character-istics + Types of illness.
Yi= 1 + 2adult* + 3fml + 4fmlhh +
5educ + 6lnpce1 + 7lnpce2 +
8 rural + 9h_vec + 10ins_ask +
11d* + 12pp* + 13pusk* +
14vilmdwf + 15ill* + Ui 5)
Where: adult*= being adult age 15 until more than 75 (spline of adult); fmlhh= female as the head of household; educ= years of education;
lnpce= log of per capita expenditure;rural= living in rural area; h_vec= having vehicle; ins_ask= having ASKES;d*= distance to hospital, private practice, PUSKESMAS, and traditional healer;
pp*= characteristics of private practice; pusk*= characteristics of PUSKESMAS; ill*= types of illness.
RESULT AND DISCUSSION
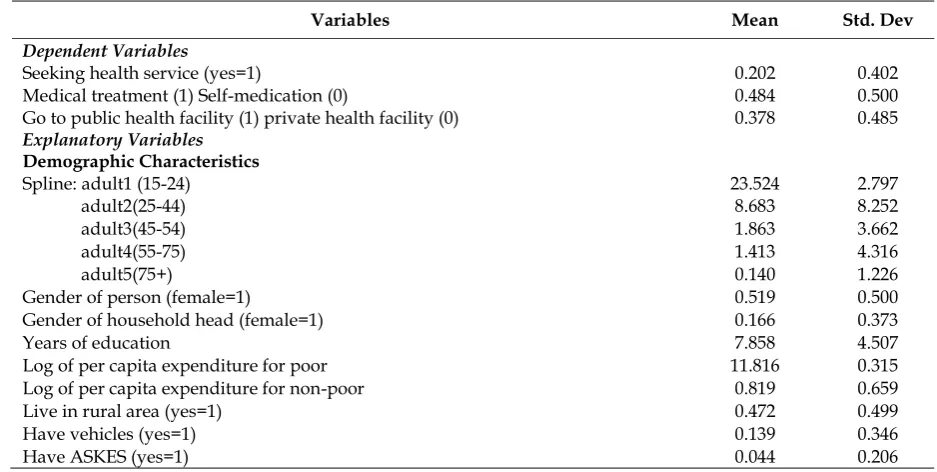
old, the average of age is 35.6 years old, 51.9% are female, 16.6% reported that the gender of head of household is female, years of individu-als education is approximately 7.86 years or equivalent to Junior High School, 47.2% are reported living in rural area, only 13% have their own vehicles, and only 4% have health insurance (ASKES). Log of per capita expendi-ture for poor category is 11.82 and for non-poor category is 0.819 on average.
In the basic specification of the first model in table 2 below, some variables, being aged 15 24 and 45 74 years old, being female, years of education, log of per capita expenditure for poor and non-poor, living in rural area, owning vehicle, and having insurance (ASKES) turn out to be positive covariates with the probability of utilize health service. Only female as household head turns out to be negative covariate. Being aged 15 24 is statistically significant and increases the probability to use health service by one percentage point. Being aged 45 74 and increase in years of education also significantly increase the probability of using health service by less than one percentage point. Being female increases the probability to use health service by 9.7 percentage points. Log of per capita expenditure for poor increases the probability by 4.5 percentage points, while for non-poor
increases the probability by 2.8 percentage points. Living in rural area, having vehicle, and having insurance will increase the probability of using health service by 2.4, 1.7, and 7.4 per-centage points. Model 2, 3, and 4 have the same results with model 1 except living in rural area which is not statistically significant. F statistics show that demographic characteristics in all models are jointly significant. Distances to health service in all models are not jointly nificant. Facility characteristics are jointly nificant, and types of illness are also jointly sig-nificant affecting the probability of utilize health service.
Values of robust standard errors are reported in parentheses. The regression also includes years of observation. Distance to health service measured by time from head office to health services include distance to hos-pital, distance to public health centre, distance to private practice, and distance to traditional practice. Facility Characteristics include availa-bility of electricity, source of water and electric-ity, availability of service completeness, and existence of private practices and public health services at community level. Types of illness show the morbidity condition include head-ache, stomach head-ache, runny nose, fever, and toothache.
Table 2. Descriptive Statistics
Variables Mean Std. Dev
Dependent Variables
Seeking health service (yes=1) 0.202 0.402
Medical treatment (1) Self-medication (0) 0.484 0.500
Go to public health facility (1) private health facility (0) 0.378 0.485 Explanatory Variables
Demographic Characteristics
Spline: adult1 (15-24) 23.524 2.797
adult2(25-44) 8.683 8.252
adult3(45-54) 1.863 3.662
adult4(55-75) 1.413 4.316
adult5(75+) 0.140 1.226
Gender of person (female=1) 0.519 0.500
Gender of household head (female=1) 0.166 0.373
Years of education 7.858 4.507
Log of per capita expenditure for poor 11.816 0.315
Log of per capita expenditure for non-poor 0.819 0.659
Live in rural area (yes=1) 0.472 0.499
Have vehicles (yes=1) 0.139 0.346
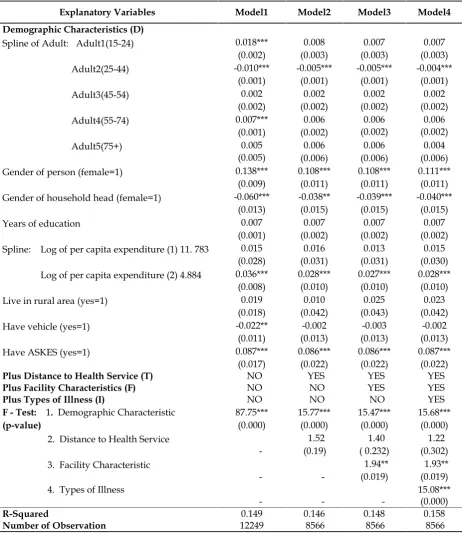
The first model from table 4 below reports that being adult 15 24 years and 55 74 years old are statistically significant and increase the probability of using medical treatment posi-tively by approximately one percentage point. While being aged 25 44 years old are negatively correlated, yet statistically significant. Female are positively significant and increase the prob-ability of using medical treatment by 13.8 per-centage point. Female as household head is significantly decreasing the probability of using medical treatment by 6 percentage points. Increase in per capita expenditure for non-poor is positively significant and increase the proba-bility of using medical treatment by 3.6 per-centage points. Having vehicle decreases the probability of using medical treatment by 2.2 percentage points. While having insurance (ASKES) will increase the probability by 8.7 percentage points. All of demographic charac-teristics variables above presented in the first model are jointly significant increase the proba-bility of using medical service.
Model 2, 3, and 4 generally have the same pattern with the first model. However, being aged 15 24 and 55 74 are not statistically nificant. Having vehicle is not statistically sig-nificant as well. In the second model, all of de-mographic characteristics variable are jointly significant, while all of distance variable are not jointly significant. In model 3, facility charac-teristics are jointly significant, demographic characteristics are jointly significant, while dis-tance to health facility are not jointly significant. In the last model, types of illness variables added are jointly significant.
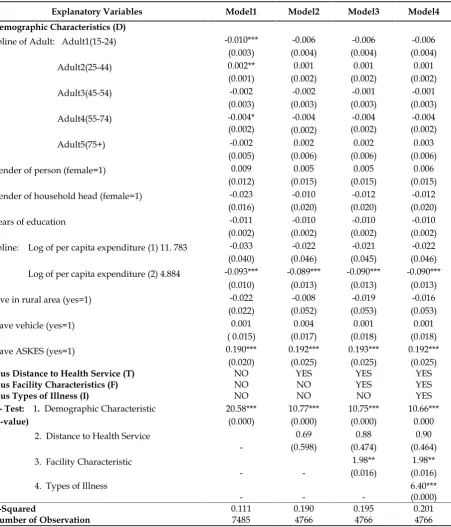
Below is the regression result of probability of using public health service with fixed effect. From the table, there are only six variables are statistically significant in the first model. Being aged 15 44 is significant decreasing the proba-bility of using public health service by one per-centage point. However, being aged 25 44 is significant increasing the probability of using public health service by less than one percent-age point. Increase in log of per capita ex-penditure for non-poor decreases the probabil-ity of using public health service by 9.3 percent-age points. Having insurance (ASKES) will increase the probability to use public health service by 2.2 percentage points. Being female,
aged between 45 54 and more than 75, years of education, being female as household head, log of per capita expenditure for poor, living in rural area, and having vehicle are not statisti-cally significant.
In model 2, 3, and 4 being adult (aged more than 15 years old) are not statistically signifi-cant. In these models, only two variables are statistically significant, log of per capita ex-penditure for non-poor and having insurance (ASKES). This log of per capita expenditure in model 2, 3, and 4 have the same negative coeffi-cient thus will decrease the probability to use public health service by 8.9 percentage points. While having ASKES increases the probability by approximately almost 2 percentage points. F statistics show that demographic characteristics are jointly significant in all models. Distance to health facilities is not jointly significant in all models. Facility characteristics in all models are jointly significant and the types of illness also jointly significant in all models.
CONCLUSION
also affects people to choose public health ser-vice. Other variables such as distance to health service, completeness of health facility, and type of diseases are possible in affecting people to utilize health care. Health indirectly reduces people s expenses for medical treatment later. Government must be able to provide appropri-ate health facilities in order to make people easier to get health service. More health insur-ance schemes are needed to enhinsur-ance access to health service since ASKES is positive and sig-nificant.
REFERENCES
Budiarto, Wasis. (1996).Analisis Permintaan (De-mand Analysis) Pelayanan Kesehatan Pusk-esmas di Kabupaten Mojokerto. Buletin Penelitian Kesehatan (24). Ministry of Health, Republic of Indonesia
Gakunju, E. M. (2003).Determinants of health Sta-tus in Kenya. Research Paper. Mekerere University Institute of Economics.
Geda, Alemayehu and Shimeles, Abebe. (2009).
Demand for Health in Ethiopia: Explanatory Analysis from Welfare Monitoring Surveys.
Hjortsberg, Catharina. (2003). Why do The Sick not Utilise Health Care? The Case of Zambia, Health Economics12: 755-770. Janjua, N.Z., Khan Muhammad I, et al. (2006).
Pattern of Health Care Utilization and De-terminants of Care-Seeking From GPs in Two Districts of Pakistan. Southeast Asian J Trop Med Public Health, vol. 37, No.6: 1242-1253.
Juanita. (2002). Kesehatan dan pembangunan na-sional. Fakultas Kesehatan Masyarakat. Universitas Sulawesi Utara.
Juanita. (2002). Pengaruh krisis ekonomi terhadap pelayanan kesehatan masyarakat. Fakultas Kesehatan Masyarakat. Universitas Sula-wesi Utara.
Mendoza-Sassi et al. (2003). Outpatient Health Service Utilization and Associated Factors: A Population-Based Study. Rev SaúdePública 2003;37(3):372-8.
Mwabu, Germanoet al.(2006). Quality of Medi-cal Care and Choice of MediMedi-cal Treatment in Kenya: An Empirical Analysis. The Journal of Human Resources, vol 28 no4 838 862.
Mwabu, Germano. (2008). Health Economics for Low Income Countries. Handbook of Development Economics.Vol. 4 .
O Donnel, Owen. (2007).Access to Health Care in Developing Countries: Breaking Down De-mand Side Barriers. Cad.SaúdePública, Rio de Janeiro, 23(12): 2820-2834.
Strausset al. (2004). The Third Wave of the In-donesia Family Life Survey: Overview and Field Report. Vol 1. RAND Labor and Population.
Strauss, John and Thomas, Duncan (2007). Health Over the Life Course. California Center for Population Research, Los Ange-les.
Stock, James H and Watson, Mark W. (2003).
Stata Tutorial. Introduction to Econometrics. Pearson Education Inc.
Susanto, Eko and Hasanbasri, M. (2006). Uti-lisasi Sarana Pelayanan Kesehatan. Studi Analisis Data Susenas 2004. Working Paper Series No.23,1stdraft.
Tawi, Mirzal (2008). Analisis Data dengan STATA .http://syehaceh.wordpress.com (visited September, 16 2009)
Tilden,et al(2006).The effect of decentralization on the health status and health care utilization patterns in Indonesia. Ministry of Health, Republic of Indonesia.
APPENDIX
Table 4. Choice of using medical or self treatment, linear probability model with fixed effect
Explanatory Variables Model1 Model2 Model3 Model4
Demographic Characteristics (D)
Spline of Adult: Adult1(15-24) 0.018*** 0.008 0.007 0.007
(0.002) (0.003) (0.003) (0.003)
Adult2(25-44) -0.010*** -0.005*** -0.005*** -0.004***
(0.001) (0.001) (0.001) (0.001)
Adult3(45-54) 0.002 0.002 0.002 0.002
(0.002) (0.002) (0.002) (0.002)
Adult4(55-74) 0.007*** 0.006 0.006 0.006
(0.001) (0.002) (0.002) (0.002)
Adult5(75+) 0.005 0.006 0.006 0.004
(0.005) (0.006) (0.006) (0.006)
Gender of person (female=1) 0.138*** 0.108*** 0.108*** 0.111***
(0.009) (0.011) (0.011) (0.011)
Gender of household head (female=1) -0.060*** -0.038** -0.039*** -0.040***
(0.013) (0.015) (0.015) (0.015)
Years of education 0.007 0.007 0.007 0.007
(0.001) (0.002) (0.002) (0.002)
Spline: Log of per capita expenditure (1) 11. 783 0.015 0.016 0.013 0.015
(0.028) (0.031) (0.031) (0.030)
Log of per capita expenditure (2) 4.884 0.036*** 0.028*** 0.027*** 0.028***
(0.008) (0.010) (0.010) (0.010)
Live in rural area (yes=1) 0.019 0.010 0.025 0.023
(0.018) (0.042) (0.043) (0.042)
Have vehicle (yes=1) -0.022** -0.002 -0.003 -0.002
(0.011) (0.013) (0.013) (0.013)
Have ASKES (yes=1) 0.087*** 0.086*** 0.086*** 0.087***
(0.017) (0.022) (0.022) (0.022)
Plus Distance to Health Service (T) NO YES YES YES
Plus Facility Characteristics (F) NO NO YES YES
Plus Types of Illness (I) NO NO NO YES
F - Test: 1. Demographic Characteristic 87.75*** 15.77*** 15.47*** 15.68***
(p-value) (0.000) (0.000) (0.000) (0.000)
2. Distance to Health Service
-1.52 1.40 1.22
(0.19) ( 0.232) (0.302)
3. Facility Characteristic
-
-1.94** 1.93**
(0.019) (0.019) 4. Types of Illness
- -
-15.08*** (0.000)
R-Squared 0.149 0.146 0.148 0.158
Number of Observation 12249 8566 8566 8566
Table 5. Choice of using public or private facility, linear probability model with fixed effect
Explanatory Variables Model1 Model2 Model3 Model4
Demographic Characteristics (D)
Spline of Adult: Adult1(15-24) -0.010*** -0.006 -0.006 -0.006 (0.003) (0.004) (0.004) (0.004)
Adult2(25-44) 0.002** 0.001 0.001 0.001
(0.001) (0.002) (0.002) (0.002)
Adult3(45-54) -0.002 -0.002 -0.001 -0.001
(0.003) (0.003) (0.003) (0.003)
Adult4(55-74) -0.004* -0.004 -0.004 -0.004
(0.002) (0.002) (0.002) (0.002)
Adult5(75+) -0.002 0.002 0.002 0.003
(0.005) (0.006) (0.006) (0.006)
Gender of person (female=1) 0.009 0.005 0.005 0.006
(0.012) (0.015) (0.015) (0.015) Gender of household head (female=1) -0.023 -0.010 -0.012 -0.012
(0.016) (0.020) (0.020) (0.020)
Years of education -0.011 -0.010 -0.010 -0.010
(0.002) (0.002) (0.002) (0.002) Spline: Log of per capita expenditure (1) 11. 783 -0.033 -0.022 -0.021 -0.022
(0.040) (0.046) (0.045) (0.046) Log of per capita expenditure (2) 4.884 -0.093*** -0.089*** -0.090*** -0.090***
(0.010) (0.013) (0.013) (0.013)
Live in rural area (yes=1) -0.022 -0.008 -0.019 -0.016
(0.022) (0.052) (0.053) (0.053)
Have vehicle (yes=1) 0.001 0.004 0.001 0.001
( 0.015) (0.017) (0.018) (0.018)
Have ASKES (yes=1) 0.190*** 0.192*** 0.193*** 0.192***
(0.020) (0.025) (0.025) (0.025)
Plus Distance to Health Service (T) NO YES YES YES
Plus Facility Characteristics (F) NO NO YES YES
Plus Types of Illness (I) NO NO NO YES
F - Test: 1. Demographic Characteristic 20.58*** 10.77*** 10.75*** 10.66***
(p-value) (0.000) (0.000) (0.000) 0.000
2. Distance to Health Service
-0.69 0.88 0.90
(0.598) (0.474) (0.464) 3. Facility Characteristic
-
-1.98** 1.98** (0.016) (0.016) 4. Types of Illness
- -
-6.40*** (0.000)
R-Squared 0.111 0.190 0.195 0.201
Number of Observation 7485 4766 4766 4766