Successes and Failures Integrating American
Schools since
Brown versus Board of
Education
Sarah J. Reber
A B S T R A C T
This paper uses a new methodology to assess the effects of court-ordered desegregation plans on segregation and white enrollment. I then assess what characteristics of districts are predictive of having more or less white flight when desegregation plans are implemented. I exploit the wide variation in the timing of implementation of desegregation plans to identify their effects. I find strong evidence that segregation fell when districts implemented deseg-regation plans; plans were also associated with significant white enrollment losses that offset about one-third of the within-district reductions in segrega-tion. White flight was particularly severe in districts with more public school districts in the same metropolitan area.
I. Introduction
The Supreme Court’s 1954 decision in Brown versus Board of Education,declaring segregated schools to be “inherently unequal,” was a momen-tous piece of educational policy. As a result of Brown and subsequent decisions, courts ordered districts around the country to desegregate their schools. But were these plans successful in integrating the schools? Was reduced segregation within these districts offset by white flight to suburban districts? What factors were associ-ated with more and less effective plans?
I address these questions using a unique data set that tracks enrollment by race at the school level for 108 school districts that implemented court-ordered desegregation
Sarah J. Reber is Assistant Professor of Public Policy at the University of California, Los Angeles. The author is grateful to David Cutler, Amy Finkelstein, Claudia Goldin, Caroline Hoxby, Larry Katz, Anna Maria Mayda, Nora Gordon, Kiki Pop-Eleches, Dean Yang, Tara Watson and two anonymous referees for helpful comments and discussions and to Eanswythe Grabowski and Mohan Romanujan for resurrecting the data. Margo Schlanger provided invaluable assistance in understanding the legal history. Financial Support from the National Science Foundation, the American Educational Research Association, and the Spencer Foundation is gratefully acknowledged. The data used in this article can be obtained beginning October 2005 through September 2008 from Sarah J. Reber, UCLA School of Public Affairs, Department of Public Policy, Los Angeles, CA 90095, sreber@ucla.edu.
[Submitted June 2004; accepted December 2004]
ISSN 022-166X E-ISSN 1548-8004 © 2005 by the Board of Regents of the University of Wisconsin System
plans. For a single district or time series, it is difficult to tell whether changes in white enrollment and segregation measures are related to desegregation plans or simply reflect underlying trends. To separate the effects of the plans from trends due to other factors, I rely on the fact that there was substantial variation in the timing of desegre-gation plan implementation—due largely to the peculiarities of the legal process. I also investigate the role of interjurisdictional competition in explaining the variation across districts in white flight and long-run success in reducing segregation.1
I present systematic evidence showing that these court-ordered desegregation plans were actually enforced. Desegregation plans substantially reduced segregation within affected districts, and these reductions were maintained during the eight to ten years following implementation. However, I also find that white families responded by leav-ing districts that had desegregation plans. Within a decade after plan implementation, these plan-induced reductions in white enrollment offset about one-third of the initial reductions in segregation.
The evidence suggests that the decision to exclude suburban districts from these plans limited their success: White flight was particularly severe for districts sur-rounded by many alternative public school districts that were not affected by the pol-icy. The tradeoff between the benefits of competition and the limits it places on the ability to redistribute is well-known in local public finance, although it is usually dis-cussed in the context of redistributing income. When local jurisdictions compete for households, redistributing from higher-income to lower-income households is diffi-cult; high-income households will leave jurisdictions that redistribute, potentially causing a “race to the bottom” in services for low-income households. Redistribution will be more successful if it is conducted by state or federal governments, as mobil-ity cannot as easily “undo” it. The results point to a similar tradeoff in desegregating schools: On the one hand, more competition among school districts may increase pro-ductive and allocative efficiency, as households can choose a district that more closely matches its tastes for local public goods, and districts have incentives to produce effi-ciently. On the other hand, this competition makes redistribution—in this case, redis-tribution of peers—more difficult. Still, substantial increases in nonwhites’ exposure to whites were maintained in many districts despite mobility.
The paper proceeds as follows: Section II discusses the legal background, previous literature, and the data used in the analysis. In Section III, I describe the measures of segregation and enrollment I use. Section IV presents evidence on the average effects of desegregation plans on trends in segregation and enrollment by race. In Section V, I present evidence that the effects of desegregation plans were heterogeneous, discuss several hypotheses that may explain this heterogeneity, and evaluate these hypotheses The Journal of Human Resources
560
empirically; in particular, I consider what factors are associated with a larger white enrollment response to the policy. Section VI concludes.
II. Background
A. Legal History in Brief
In 1954, the landmark Brown versus Board of Education decision overturned the “separate but equal” doctrine, declaring separate schools to be “inherently unequal.” But for a decade or more, little progress was made. The first generation of desegre-gation plans of the late 1950s and early 1960s typically moved just a handful of blacks to the white schools or allowed for “voluntary transfers” to different schools, produc-ing only small reductions in segregation.
The large-scale, court-orderedplans that I consider here were mostly imposed fol-lowing a series of Supreme Court rulings between 1968 and 1971. Finally, the 1974 decision in Milliken versus Bradleymade it difficult to include suburban districts in a desegregation plan. This decision made it much more likely that plans could be under-mined by white flight as white families could move to nearby districts to avoid the plan. The results in Section V suggest this was an important limitation.
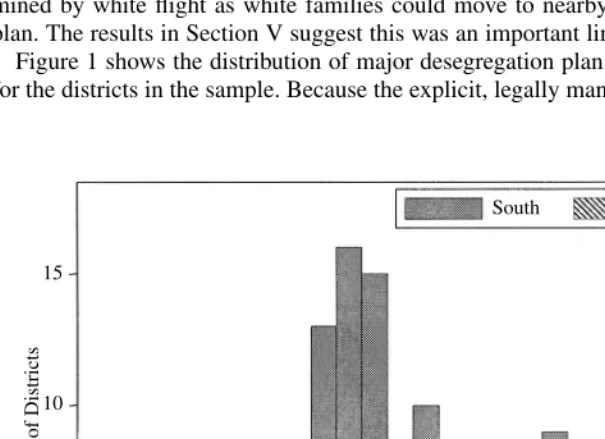
Figure 1 shows the distribution of major desegregation plan implementation dates for the districts in the sample. Because the explicit, legally mandated segregation that
South Non-South
15
10
5
0
60 65 70 75 80 85
Number of Districts
Implementation Year
Figure 1
was historically practiced in the South was the first to be declared illegal, southern districts had earlier plans on average, although there is significant overlap in the tim-ing of implementation in Southern and non-Southern districts. Districts used a variety of strategies to integrate their schools. All the plans studied here were court-ordered and therefore mandatory from the perspective of the districts. Busing was often, but not always, required to implement the new school assignments, especially after the Supreme Court specifically sanctioned its use in 1971.
B. Previous Literature
The question of whether desegregation plans caused white flight has been hotly debated since shortly after the first major desegregation plans were implemented in the late 1960s. Coleman, Kelly, and Moore (1975) was the first entry in a long litera-ture on desegregation and white flight. The authors related annual percentage changes in white enrollment to annual changes in segregation, controlling for other district characteristics, for a sample of large city school districts. They found a significant relationship between reductions in segregation and declining white enrollments, concluding that desegregation plans might be counterproductive in increasing minor-ity exposure to whites. Subsequent studies used similar approaches, but employed alternative measures of segregation, included additional controls, and analyzed dif-ferent samples of districts, or included district fixed effects (for example, Clotfelter 1979; Farley, Wurdock, and Richards 1980). These studies tend to confirm the basic finding that reductions in segregation were associated with reductions in white enrollment, although the magnitude of the effects varies. These studies do not distin-guish between the effects of changes in segregation due to demographic changes or mobility for other reasons from changes in segregation due to desegregation policy changes. Nor does this method allow for an examination of the dynamic effects of desegregation, such as white flight in anticipation of or phased in after a desegrega-tion plan.2
Other studies relate long-term changes in white enrollment to long-term changes in segregation or compare long-term changes in white enrollment for districts that implemented a desegregation plan to those that did not. These studies tend to find smaller or no effects of desegregation on white enrollment (for example, Farley 1976 and Pettigrew and Green 1976). These results should be interpreted with caution, however, as districts that were never required to implement a plan are likely to be dif-ferent from those that did.3
Welch and Light (1987)—who collected some of the data used in this analysis— also document reductions in segregation and the white share of enrollment in the year or two following plan implementation. This early research establishes a correlation The Journal of Human Resources
562
2. Wilson (1985) does look for anticipatory and lagged effects of desegregation plan implementation, However, that study—which attempts to distinguish between the effects of plans separate from the change in segregation they cause—employs a measure of the change in segregation (white exposure to nonwhites) that is simultaneously determined with white enrollment (when white enrollment declines, white exposure to nonwhites rises), making the interpretation of the results difficult.
between falling segregation and falling white enrollment during the period when many desegregation plans were implemented.
In this paper, I expand on earlier studies of desegregation using a more complete data set—spanning from the late 1960s to 1998—to study the long-term effects of desegregation plans. This expanded dataset allows the examination of districts imple-menting plans after the early 1970s (most early studies examine data through 1976 or earlier). Most previous studies have examined responses to observed changes in seg-regation from all sources, rather than changes in segseg-regation policyor implementation of desegregation plans. I take advantage of substantial variation in when districts implemented major court-ordered desegregation plans, controlling for calendar year, to better identify the effects of desegregation plan implementation on segregation and white flight.
Most existing studies examining the variation in plans’ effects on segregation employ a case-study approach or consider a relatively small number of districts with few controls. Rossell and Armor (1996)—which studies a sample of about 600 dis-tricts—is an exception; that study focuses on the effects of different types of desegre-gation plans—in particular, whether the plan involved mandatory reassignment of students. The authors relate the percent change in white enrollment between 1968 and 1991 to desegregation plan characteristics. They conclude that plans involving mandatory reassignment of students had larger negative effects on white enrollment. I expand on this research by examining the determinants of plan success in increas-ing long-run integration for districts implementincreas-ing court-ordered plans systematically, taking advantage of the variation in timing of plan implementation and considering a variety of factors, especially the availability of alternative public school districts in the metropolitan area.
C. Data: Enrollment by Race and Plan Implementation Dates
I use school-level data on enrollment by race and information about when desegrega-tion plans were implemented for a sample of 108 large districts that had at least one court-ordered desegregation plan some time between 1961 and 1986. The sample of districts was chosen and the data collected for a report of the U.S. Commission on Civil Rights. Although the sample included a small fraction of school districts, it cov-ered 20 percent of enrollment and about 45 percent of minority enrollment nationally in 1968.4
The report includes information about all court-ordered desegregation plans in each of the districts sampled. I use the year of the first major plan as the implementation date. While the scope of major plans varied considerably, the enrollment data show sharp changes in the racial composition of schools in the year identified as a major plan for nearly all districts; in other words, it appears that many students were, in fact, reassigned in the year of major plans as identified by Welch and Light. More infor-mation about the sample, implementation years, and data can be found in the Appendix and in Welch and Light (1987).
The Journal of Human Resources 564
III. Measures of Segregation and Enrollment
For all of the segregation measures, I consider two mutually exclusive categories: whites (non-Hispanic whites) and nonwhites (including Hispanics).5I con-sider two measures of segregation that have been used extensively in the literature on residential and school segregation and capture different aspects of segregation. The
dissimilarity indexcaptures the extent of integration given the fraction white in the dis-trictand can be interpreted as the fraction of students that would have to change schools so that all schools in the district would have the same racial composition. The dissimilarity index ranges from zero (each school has the same racial composition) to one (complete segregation).6The dissimilarity index captures “compliance” or “within-district” segregation; it indicates how closely the racial composition of individual schools matches the racial composition of the entire district. This measure, however, does not fully capture the extent to which nonwhites attended the same schools as whites since the fraction white varied across districts and over time. For example, a district could be well-integrated according to the dissimilarity index, but have a low white share of enrollment; in this case, nonwhites in the district would not be very exposed to whites.
The exposure indextakes this variation in white share of enrollment into account, providing a better measure of the potential for nonwhite students to have contact with whites in schools. The exposure index for nonwhites measures the fraction white in the “average” nonwhite’s school; it is simply the weighted average of per-cent white in schools, where the weight is the school’s nonwhite enrollment.7 Ultimately, one important goal of these policies was to increase the extent to which minority students have contact with whites in schools; this was part of the logic of the Browndecision. Many of the channels through which desegregation plans might have improved education for minorities hinged on the notion that the plans would actually increase minority students’ exposure to whites. I therefore consider non-white exposure to non-whites an important summary measure of the success of these plans.
5. It would be interesting to consider the effects of desegregation plans on blacks and Hispanics separately; for much of the sample period, however, Hispanics are not a large enough share of enrollment to get precise estimates. I therefore consider all nonwhites together. All of the results are similar if only blacks and whites are considered.
6. The index is calculated for each district as follows:
% ( % ) total enrollment in the district, and % NWis the fraction of the district that is nonwhite.
7. Exposure of nonwhites to whites is calculated as follows:
I consider the log of total white enrollment in the district to assess whether deseg-regation plans led to losses in white enrollment or “white flight.” Ultimately, it is the fraction of enrollment that is white that influences the exposure of nonwhite students to white students. However, desegregation plans were likely to have influenced white and nonwhite enrollments differently. Therefore, I consider the effects of the plans on white and nonwhite enrollment directly.
Because these data are for public school enrollment—rather than residence—in the district, I cannot distinguish between white enrollment changes due to exit from the district as opposed to private school entrance. Consistent data on private school enrollment in these districts are not available for this period. I therefore consider only the decision of whether to attend the public school in the affected district or not.
Table 1 presents the means of the outcome variables for 1968, 1970, 1980, and 1995 for the whole sample and by region for 1968.8In 1968, these districts were highly segregated according to all the measures: The dissimilarity index averaged 0.71, and the average nonwhite’s school was only 28 percent white even though the average district was nearly 70 percent white. In 1968, schools in the Midwestern and Southern districts that had not yet implemented a major plan were significantly more segregated than Northern and Western districts, while the fraction white was similar in all regions. Southern districts that had not yet implemented a major plan in 1968 were not perfectly segregated as they were before Brown. This suggests that the removal of laws mandating segregation and some of the smaller early plans did reduce segregation somewhat before the major plans I consider here were implemented.9In fact, in 1968 Southern districts look quite similar to Midwestern districts in terms of segregation.
Between 1968 and 1970, segregation (by all measures) began to fall, as the first dis-tricts began to adopt major plans; white enrollment was steady. During the 1970s, the average dissimilarity index fell substantially, indicating increasing integration. However, as measured by the exposure of nonwhites to whites, integration rose only slightly—from 37 to 43 percent—between 1970 and 1980. By 1995, nonwhite expo-sure in these districts had fallen below its 1970 level to 34 percent. White enrollment and the average fraction white in districts fell steadily after 1970. The regression analy-sis below shows that desegregation plans played an important role in explaining these trends—reducing within-district segregation, but also white enrollment, substantially.
IV. Average Effects of Desegregation Plans
A. Identification
I use variation in the timing of plan implementation across districts to identify the effect of court-ordered desegregation plans as distinct from trends due to other fac-tors. Figure 1 shows the substantial variation in the timing of desegregation plan
8. To maintain a consistent sample of districts across years, I include only the 95 districts that had not yet implemented a plan in 1968 and have data available for each of the years shown.
The Journal of Human Resources
566
Table 1
Summary Statistics for Selected Years and by Region; Districts in Sample with Desegregation Plansa
1968 1970 1980 1995 West Midwest Northeast South
Enrollment measures
Ln(white enrollment) 10.6 10.6 10.1 9.8 10.7 10.9 10.4 10.5 Ln(nonwhite enrollment) 9.8 9.8 9.9 10.2 9.9 10.2 9.7 9.6 Percent white 67.7 65.7 53.0 40.9 68.6 65.3 64.5 68.8 Total enrollment 85,107 84,866 66,942 72,130 107,367 119,690 75,199 69,460 Segregation measures
Dissimilarity index 0.71 0.60 0.38 0.38 0.53 0.74 0.59 0.76 Nonwhite exposure to whites 0.28 0.37 0.43 0.34 0.44 0.27 0.38 0.23 White exposure to nonwhites 0.12 0.17 0.37 0.48 0.20 0.12 0.18 0.90
Number of districts 95 95 95 95 14 18 9 54
implementation. I use an approach similar to the standard difference-in-differences estimator, but instead of a simple “after treatment” indicator, I use a series of dummy variables indicating time relative to implementation to estimate the dynamic effects of desegregation plans: indicator variable equal to one if district iis kyears relative to its implementation year in year tand 0 otherwise. εitis an error term.10The time-since-implementation dummy variables (δk,it) are capped at k= −6 years and k= 15 years: All years less than −6 are included in the −6 category and all years greater than 15 years are included in the 15 category.11The omitted category is the last year prior to plan implementation.12
The pattern of the λk’s describes the change in the trend in the left-hand-side vari-able associated with plan implementation. For example, λ1 − λ0 is the expected change in the dependent variable associated with moving from time zero to time one (the first year of plan implementation), controlling for calendar year.
This approach allows for a partial test of the identifying assumption that, absent plan implementation, the outcome variables of interest would have trended similarly in districts implementing plans at different times. If the timing of implementation is unrelated to underlying trends and individuals do not respond before implementation, there should be no trend in the λk’s for k≤0.13
However, not all districts have data available for each year relative to implementa-tion (k). Districts that implemented earlier in the period necessarily have fewer years of data before implementation, and districts implementing later have fewer years of data after implementation. Thus, the composition of districts identifying the λk coef-ficients varies with k. If treatment effects are heterogeneous, the pattern of λk’s could reflect changes in the composition of districts identifying the coefficients in addition to the dynamics of the average treatment effect.14I therefore estimate Equation 1 sep-arately for a balanced panel of 51 districts with data available for at least four years before and 15 years after implementation.
Intuitively, this empirical approach captures the extent to which districts that implemented desegregation plans earlier experienced earlier declines in segregation
10. In some specifications, I control for calendar year (t) parametrically rather than with year fixed effects; the results from both specifications are nearly identical in most cases. I also report results excluding any con-trols for calendar time in Tables A2–A5.
11. Results are similar when alternative upper and lower caps are used.
12. I drop data for years before 1966 since few districts have data available for these early years. 13. Because families could have responded in anticipation of plan implementation, this may not be expected to hold for all outcomes. I discuss this further below.
and white enrollment, compared with those implementing later plans. A variety of factors other than desegregation plans can influence the outcome variables consid-ered here, for example, changes in housing policy, crime rates, employment oppor-tunities, or district policies. As long as these factors are not systematicallyrelated to implementation year, they will be picked up in the year effects and the time-since-implementation coefficients will reflect the causal effect of desegregation plans.
B. Results: Average Effects on Segregation and Enrollment
The results of estimating Equation 1 for measures of segregation provide strong evi-dence that plans reduced segregation substantially in the short run. The estimates indi-cate that plans reduced segregation in the long run as well; however, the magnitude of the estimated effects depends on the particular measure of segregation considered. I report the results graphically. Coefficients and standard errors, as well as results with alternative specifications of the calendar year effects, are presented in Appendix Tables A2–A4.
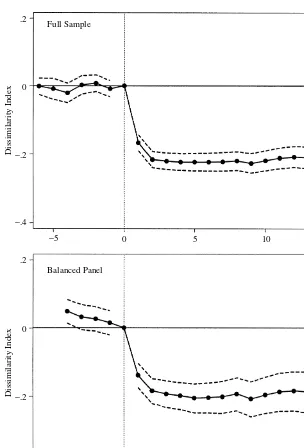
Figure 2 shows the results for the dissimilarity index, separately for the full sam-ple and balanced panel. I plot the coefficients on the time-since-imsam-plementation indicators. The last year before implementation is the omitted category, so the con-fidence intervals are for the difference relative to that year. Year fixed effects are included for both samples, although the coefficients are not significantly affected by their inclusion.
For the full sample (top panel), the dissimilarity index was unchanged in the years leading up to implementation. Dissimilarity then fell substantially—by about 0.22— in the first two years after plan implementation. Estimates for the balanced panel show a small decline in the dissimilarity index in the years leading up to implementation. In both cases, the sharp drop in the implementation year is substantial and statistically significant.15On average, plans caused large reductions in within-district segregation, and the implementation dates identified by Welch and Light clearly correspond to an important policy change.
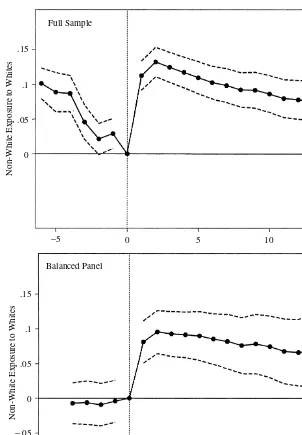
For the full sample, nonwhite exposure declined in the several years leading up to plan implementation (Figure 3, top panel), but estimates for the balanced panel show no decline in the preimplementation years, suggesting that compositional changes may be biasing the coefficient estimates for the full sample.16Many districts in the full sam-ple have only one or two years of pretreatment data. Thus, although they are less pre-cisely estimated, the estimates for the balanced panel may be more reliable, especially for the preimplementation years.
For both samples, there is a clear rise in exposure when the policy was imple-mented—increasing by 10.3 to 13.2 percentage points by two years after implementa-The Journal of Human Resources
568
.2
0
−.4
−5
−.2
Dissimilarity Index
.2
0
−.4
−.2
Dissimilarity Index
0 5 10 15
−5 0 5 10 15
Year Relative to Implementation Full Sample
Balanced Panel
Figure 2
Average Effects of Desegregation Plans on Dissimilarity Index
The Journal of Human Resources 570
.15
.1
.05
0
Non-White Exposure to Whites
Full Sample
−5 0 5 10 15
.15
.1
.05
0
−.05
Non-White Exposure to Whites
−5 0 5 10 15
Balanced Panel
Year Relative to Implementation
Figure 3
Average Effects of Desegregation Plans on Nonwhite Exposure to Whites
tion. But the long-term effect of the plans on nonwhite exposure appears to have been reduced due to white flight. The estimates for the ten-year change in nonwhite expo-sure to whites range from 6.5 to 8.6 percentage points. In other words, up to one-third of the initial increase in nonwhite exposure was subsequently offset by white flight. Further, I show below that white enrollment declined quickly in response to desegre-gation, so nonwhite exposure did not rise as much as it would have absent this behav-ioral response of whites. I explore the causes of white enrollment declines in greater detail in the next section.
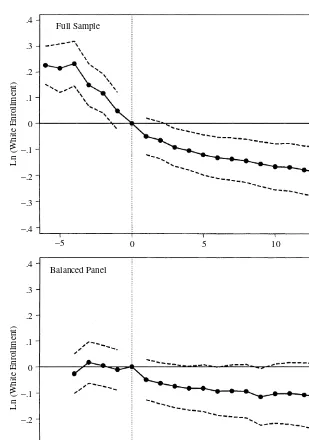
Figure 4 shows the results of estimating Equation 1 for the log of white enrollment. Plan implementation is associated with a reduction in white enrollment of about ten log points in the first two years, rising to about 16 points after ten years.17Consistent with previous research showing an association between declines in segregation and white enrollment, the coefficients on the time-since-implementation variables are sta-tistically different from the coefficient for time 0 at conventional levels by two years after the policy.18
As for nonwhite exposure, the estimates for the full sample indicate that white enrollment started to decline about three to four years before plans went into effect, while the estimated decline in the four years before implementation for the balanced panel is small and statistically insignificant. Whites might have expected the plan and moved away (or failed to move into the district) in anticipation, as plans took time to be developed and approved by the courts and were therefore often not a surprise in the implementation year. Most likely, this difference arises from compositional changes in the sample of districts identifying the coefficients.
The magnitude of the estimated reduction in white enrollment following plan implementation is substantial, suggesting that desegregation plans reduced white enrollment by 10 to 18 log points during the ten to 15 years following implementa-tion.19Still, desegregation plans do not appear to have been the primary cause of white flight. For comparison, average white enrollment fell by about 50 log points between 1970 and 1980, and by another 30 points between 1980 and 1995 (Table 1); the esti-mated reduction in white enrollment after ten years is about one-quarter the average reduction for these districts over the 1970s.
The result presented in this section are consistent with the existing research on desegregation reviewed in Section II, which has generally found reductions in white flight associated with desegregation. The approach taken here uses a different source
17. Coefficients and standard errors are presented in Table A5. Results are qualitatively similar if percent white, instead of log of white enrollment, is considered as the dependent variable.
18. In results not reported here, I estimate Equation 1 with the log of nonwhite enrollment as the dependent variable. The point estimates indicate that log of nonwhite enrollment generally trended up before plans were implemented and continued to do so at a similar rate. This may be due to improvements in school quality for nonwhites in these districts or falling housing prices due to the departure of whites. However, the estimated coefficients on the time-since-implementation indicators are quite noisy; the trend is not statistically differ-ent from zero (t-statistics are generally less than 1).
The Journal of Human Resources 572
.4
.3
.2
.1
−.1
−.2
−.3
−.4
−5 0
Ln (White Enrollment)
0 5 10 15
Full Sample
.4
.3
.2
.1
−.1
−.2
−.3
−.4
−5 0
Ln (White Enrollment)
0 5 10 15
Balanced Panel
Year Relative to Implementation
Figure 4
Average Effects of Desegregation Plans on White Enrollment
of variation in desegregation—exploiting variation in the timing of implementation of plans—which allows me to estimate the dynamics of the effects of desegrega-tion plans as well. Reducdesegrega-tions in the dissimilarity index were sharp, reaching their full effect within the first couple years after implementation of a desegregation plan. The negative effect of desegregation plans on white enrollment was also imme-diate, but white enrollment continued to decline over time. As a result, exposure of nonwhites to whites increased sharply on implementation, but then declined over time.
V. Determinants of White Flight and Long-Term Plan
Effectiveness
The results presented thus far reflect the average effects of desegrega-tion plans for the sample. However, the success of plans varied considerably across districts. For example, nonwhite exposure to whites increased on average by about 6 percentage points in the ten years following plan implementation, with a standard deviation of 14 percentage points. Changes in white enrollment also varied consider-ably: The average ten-year loss was 24 log points, with a standard deviation of 31 points.20
Why were some districts more effective in increasing nonwhite exposure to whites? Understanding why some had more white flight than others is critical to answering this question. To empirically evaluate the contribution of different factors to white flight, I examine the relationship between long-term changes in white enrollment fol-lowing plan implementation and preexisting district characteristics, as well as features of the desegregation plans.
How whites responded to a court-ordered desegregation plan is expected to depend on both the demand for and supply of alternatives—that is, how much district resi-dents disliked the plan and their ease of finding a more-preferred alternative public school district or paying for private schools. From the perspective of white families, a desegregation plan affected the quality of the schools along a number of dimensions. The plans increased contact of white students to nonwhite students. Desegregation plans often required children to travel to schools outside their neighborhoods or to attend schools with inferior facilities. These factors all work to increase demand for alternative schools among whites.
For historical reasons, some metropolitan areas already had many public school districts, and suburban districts were generally not part of desegregation plans. Therefore, the availability of alternative nearby public school districts varied con-siderably. When more alternative school districts are available, the cost of leaving a desegregating district is lower, so we expect to see more white flight in districts in metropolitan areas with many school districts. The extent of flight to private schools is expected to depend on the availability and cost of private schooling.
To assess the importance of these factors in explaining the variation in white flight, I relate residual changesin white enrollment, following plan implementation, to pre-existing characteristics of districts. I consider the effects of region and initial school segregation as proxies for attitudes or the “demand” for segregation,21the availability of other public school districts in the metropolitan area, and the extent of the private school system (as a proxy for the availability of private schooling) before plan imple-mentation.
To estimate how much white enrollment changed in a district during the decade after implementing a plan relative to the ten-year change for the average district as estimated above,I use the residuals from estimating Equation 1 with the log of white enrollment at the dependent variable.22
The dependent variable is
where εˆi,k is the residual for district i in year k relative to plan implementation.23 Because Equation 1 includes calendar year fixed effects, ∆WhiteEnroll reflects the change in white enrollment compared to what would have been expected given the change in calendar year and the average ten-year change for all districts following implementation. Negative values indicate that a district had more white flight than average and vice-versa. I estimate the following equation for the 89 districts that have all the necessary data:
(2) ∆White Enrolli= β0+ β1×PublicDistrictsi+ β2×%PrivateSchooli+ β3
×InitialSegregationi+ β4×NEi+ β5×MWi+ β6×WESTi
+Xiβ7+ εi,
where PublicDistrictsis the log of the number of public school districts in the metro-politan area surrounding district i, %PrivateSchool is the percent of students in the district’s city that were enrolled in private schools in 1960, and InitialSegregationis the dissimilarity index for the district before it implemented its plan. NE, MW,and WESTare dummy variables for the Northeast, Midwest, or West; South is the omit-ted category. Xis a vector of control variables, including the initial white share of enrollment, log of initial enrollment, district area, district density, the manufacturing share of employment in the district’s city in 1960, and the percent change in popula-tion from 1960 to 1970 for the district’s city.24
The Journal of Human Resources 574
21. Direct measures of attitudes are not available. The General Social Survey asks a variety of questions relating to attitudes towards blacks and busing in particular; however, this survey did not start until the 1970s, and the samples at the metropolitan level are very small.
22. Alternatively, I estimate regressions similar to those presented in Section IV with interactions of an “after desegregation” indicator with the preexisting district characteristics; the results are very similar to those presented in Table 3.
23. Results are qualitatively similar if a shorter-term change is used, for example, the change from three years before to three years after implementation.
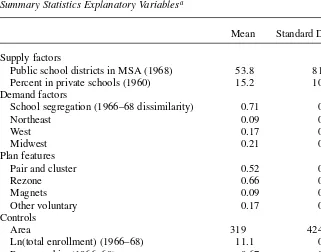
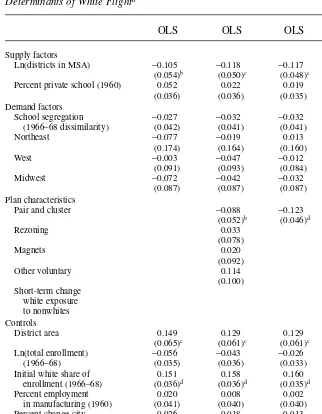
Summary statistics for the explanatory variables are in Table 2. The continuous explanatory variables are divided by their sample standard deviation, so the coeffi-cients represent the marginal effect of a one-standard-deviation change. The results of estimating Equation 2 are presented in Table 3. The availability of other public school districts in the same metropolitan area is an important predictor of white flight in all specifications; an increase of one standard deviation in the number of public school districts is associated with an additional reduction in white enrollment of about 9 to 12 log points over the following decade—equal to about half the average ten-year change associated with desegregation plan implementation.25
25. This is likely an underestimate of the effect of the availability of nearby public school districts. Geographically large districts might be expected to experience morewhite flight, as these plans would involve moving students longer distances and be more disruptive. However, the coefficient on district area is positive and significant. The positive coefficient on district area is most likely also picking up some of the effects of outside options, as metropolitan areas with large numbers of districts also tend to have smaller dis-tricts. If this variable is excluded from the regression, the coefficient on PublicDistrictsincreases by about 50 percent, while the other coefficients are largely unaffected.
Table 2
Summary Statistics Explanatory Variablesa
Mean Standard Deviation Supply factors
Public school districts in MSA (1968) 53.8 81.1
Percent in private schools (1960) 15.2 10.0
Demand factors
School segregation (1966–68 dissimilarity) 0.71 0.16
Northeast 0.09 0.29
West 0.17 0.38
Midwest 0.21 0.41
Plan features
Pair and cluster 0.52 0.50
Rezone 0.66 0.48
Magnets 0.09 0.29
Other voluntary 0.17 0.38
Controls
Area 319 424
Ln(total enrollment) (1966–68) 11.1 0.73
Percent white (1966–68) 0.67 0.14
Percent change in population (1960–70) 0.10 0.19
Percent employment in manufacturing (1960) 22.0 9.6
The Journal of Human Resources
Percent private school (1960) 0.052 0.022 0.019 0.007
(0.036) (0.036) (0.035) (0.036)
Demand factors
School segregation −0.027 −0.032 −0.032 0.059
(1966–68 dissimilarity) (0.042) (0.041) (0.041) (0.052)
Northeast −0.077 −0.019 0.013 −0.022
(0.174) (0.164) (0.160) (0.137)
Pair and cluster −0.088 −0.123
(0.052)b (0.046)d
white exposure (0.050)d
to nonwhites Controls
District area 0.149 0.129 0.129 0.129
(0.065)c (0.061)c (0.061)c (0.053)c
Ln(total enrollment) −0.056 −0.043 −0.026 −0.077
(1966–68) (0.035) (0.036) (0.033) (0.031)c
Initial white share of 0.151 0.158 0.160 0.100
enrollment (1966–68) (0.036)d (0.036)d (0.035)d (0.040)c
Percent employment 0.020 0.008 0.002 0.026
in manufacturing (1960) (0.041) (0.040) (0.040) (0.038)
Percent change city 0.026 0.018 0.013 0.011
population (1960–70) (0.022) (0.021) (0.021) (0.019)
Constant 0.035 0.027 0.073 0.002
(0.055) (0.084) (0.053) (0.051)
Observations 89 89 89 89
R-squared 0.57 0.60 0.60 0.64
a. Heteroskedasticity-adjusted Huber-White robust standard errors in parentheses. Dependent variable is constructed using the residuals from Equation 2 reported in Column 2 of Table A4 as described in Section V. Continuous dependent variables are normalized by the sample standard deviation. In the fourth column, the short-term change in white exposure to nonwhites is instrumented with four plan features: pair and cluster, rezoning, magnets, and other voluntary.
One might be concerned that the declining industrial metropolitan areas of the Midwest tended to have large numbers of school districts and that court-ordered districts in these cities would have experienced more white flight even without a desegregation plan. However, Equation 2 includes region fixed effects,26the percent of employment in manufacturing in 1960, and the population decline between 1960 and 1970.27None of these coefficients is statistically significant or large in magnitude, nor does including these variables change the coefficient on the number of nearby school districts. This suggests that it was the availability of alternative school districts, rather than these other factors, that increased white flight.28
There is little evidence that variation in the extent of the existing private school sys-tem explains the variation in white enrollment losses from public districts under court order. While cities with a more extensive private school system may have been better able to absorb students leaving districts under court order, the coefficient on percent in private schools is positivein the main specification, indicating that areas with a more extensive existing private school system experienced lessflight from the public schools upon plan implementation. This coefficient is insignificant and small in mag-nitude, however. These results suggest that other public school districts, not private schools, are the most important outside option in explaining the variation in white enrollment losses.29
Region and initial school segregation are not important predictors of white flight, controlling for other factors. None of the region dummies is independently statisti-cally significant or large, nor are the West, Midwest, and Northeast jointly signifi-cantly different from the South. High initial segregation may reflect strong tastes for segregation, so districts with high starting segregation might be expected to have experienced more white flight, controlling for other factors. Surprisingly, however, the coefficient on the initial level of segregation in the schools (measured by the dissimi-larity index) is small and insignificant.30 Consistent with previous work, the initial white share of enrollment was an important predictor of flight, the coefficient is large
26. Largely for historical reasons, the fragmentation of school districts varies substantially by region; there is, however, significant variation in the number of nearby districts within region. Many Southern states have county-wide districts (although in many Southern states, not only counties but also cities are school districts). The average Southern district in the sample is in a metropolitan area with 11 districts, the means for Midwestern, Western, and Northeastern districts are 67, 81, and 193, respectively. Even when region fixed effects are included, substantial variation in the number of districts remains.
27. Each district is assigned the percent of employment in manufacturing and population decline for its city (not metropolitan area). See the Appendix for more information about these variables.
28. As an alternative measure of the availability of alternative school districts, I experimented with using the 1968 share of MSA enrollment in the court-ordered district. This measure was not statistically significantly related to changes in white enrollment.
29. Although the extent of the existing private school system does not explain the variationin white flight, private schools may still be important on average. This is what we would expect if the elasticity of supply of private schools is similar across districts. In an analysis of desegregation in Louisiana (Reber 2004a), where data on private enrollment are available, I find evidence that desegregation did increase private school enroll-ment substantially, although shifts to districts where blacks made up a smaller share of enrollenroll-ment were larger.
and statistically significant in all specifications. White enrollment fell more after implementation if the white share was already low.31
Features of desegregation plans also might have influenced white flight, both because different types of plans produced different changes in segregation and because some methods, such as busing, may have led to more white flight independent of the change in segregation. Further, plan features could be correlated with the explanatory variables in Equation 3. Therefore, I add a series of variables describing features of the district’s desegregation plan. The four “Plan Features” dummy variables indicate whether the major plan implemented in the district employed each of four techniques: rezoning, pair and cluster, magnet schools, and “other voluntary;”32 many districts employed more than one method. The results are reported in Column 2. None of the plan type variables is significant, nor are they jointly significant. These four variables are highly correlated with each other; for example, districts that used pair and cluster rarely had other volun-tary as well. When only the pair and cluster variable is included (Column 3), the coef-ficient is negative and statistically significant. This method seems to be the most important of the plan features in predicting white flight. In both specifications, the coef-ficients on the other variables are largely unchanged, although the negative effect of the number of nearby school districts is slightly stronger in this specification.
Plan features are expected to influence white flight in large part because of differ-ences in how much they change whites’ exposure to nonwhites (because whites are more likely to leave if the racial composition of their schools changes more). In the-ory, one could disentangle the effects of the change in segregation and the methods used to achieve it by adding the change in white exposure caused by the plan to the regressions in Columns 2 and 3. However, the observed change in white exposure to nonwhites reflects not only the effects of the policy, but also whites’ response to it, and is therefore endogenous.33
Instead, I instrument for the observed short-term change in white exposure34— around the time of implementation—with the plan-feature variables. As described above, the plan features may affect white flight not only through the change in white exposure to nonwhites, but also directly.35The plan-feature variables may therefore The Journal of Human Resources
578
31. This is consistent with preferences that are nonlinear in the nonwhite share of enrollment. In theory, one could assess whether white enrollment was nonlinear in the nonwhite share of enrollment at the school level (for example, there may be tipping points). Such analysis is outside the scope of this paper.
32. Voluntary plans were mandatory from the perspective of the district, but parents were allowed some choice of school.
33. Ideally, I would include the change in white exposure that would have resulted based on the rules of the plan, assuming no behavioral response. Such detailed information is unavailable, however.
34. The short-term change in white exposure to nonwhites (ST∆WhiteExposure) is constructed using the residuals from estimating Equation 1 for white exposure to nonwhites. It is the difference in the average of the residuals for the three years before implementation and the residuals for the three years after plan imple-mentation:
The results are similar if the actual change is used or if the change for a shorter period around implementa-tion is considered.
not be valid instruments, so the coefficient on the change in white exposure to non-whites cannot necessarily be interpreted as causal. Rather, the change in white expo-sure can be interpreted as a particular parameterization of the plan features—a summary of how “onerous” the plan was. I estimate this specification using 2SLS; the results are reported in Column 4.36In the first stage, the plan features are strong predictors of the short-term change in whites’ exposure to nonwhites.37
As predicted, white flight was more severe in districts implementing plans using methods that produced larger increases in whites’ exposure to nonwhites. The coeffi-cient is negative, statistically significant, and similar in magnitude to the effect of the number of nearby public school districts. A one standard deviation change is associ-ated with a reduction in white enrollment of 11 log points.
These results are consistent with Rossell and Armor (1996), who focus on differ-ences between plans that required mandatory reassignment of students to those that allowed parents some choice—such as magnet programs. They conclude that districts with mandatory plans had more white flight. However, only 20 percent of districts had plans with no mandatory components, and districts that expected to achieve sufficient reductions in segregation through voluntary means alone (or could convince the courts that they would) may well have been different from those that did not. I exploit somewhat more variation in plan characteristics among mandatory plans, but these results should be interpreted with some caution, as the type of plan required may depend in part on the expected reaction to its implementation.
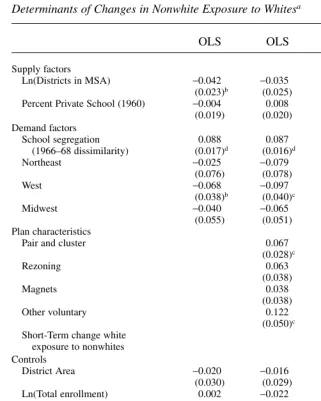
Ultimately, increasing contact between whites and nonwhites in schools was an important goal of desegregation plans, so the effect of plans on nonwhite exposure to whites—that is, the percent white in the average nonwhite’s school—is of interest for policy. The results for changes in nonwhite exposure to whites are presented in Table 4. As the results for white enrollment above would suggest, starting with a higher white share of enrollment is predictive of a plan that is more successful at increasing nonwhite exposure to whites, and districts with few nearby alternatives sustained larger increases in nonwhite exposure.
VI. Conclusions
Using the variation in the timing of the implementation of court-ordered desegregation plans, this paper estimates the effects of these plans on trends in segrega-tion and white flight. In addisegrega-tion, I examine the role of the availability of nearby school districts and other factors in explaining the variation in white flight across districts. The evidence indicates that plans were enforced and produced large, short-term reductions in segregation; but the behavioral response of whites mediated the long-run success of plans in many districts. White enrollment fell substantially following plan implementa-tion, offsetting about a third of the initial gains in nonwhites’ exposure to whites.
The weight of the evidence suggests that desegregation plans contributed sub-stantially to white enrollment losses in these districts. The estimates of the average
36. Results are similar if only the Pair and Cluster indicator is used as an instrument.
The Journal of Human Resources 580
Table 4
Determinants of Changes in Nonwhite Exposure to Whitesa
OLS OLS OLS 2SLS
Supply factors
Ln(Districts in MSA) −0.042 −0.035 −0.038 −0.046
(0.023)b (0.025) (0.023) (0.026)b
Percent Private School (1960) −0.004 0.008 0.005 0.009
(0.019) (0.020) (0.020) (0.020)
Demand factors
School segregation 0.088 0.087 0.089 0.065
(1966–68 dissimilarity) (0.017)d (0.016)d (0.017)d (0.029)c
Northeast −0.025 −0.079 −0.049 −0.039
Ln(Total enrollment) 0.002 −0.022 −0.005 0.008
(1966–68) (0.014) (0.016) (0.014) (0.017)
Initial white share of 0.076 0.071 0.073 0.089
enrollment (1966–68) (0.016)d (0.016)d (0.015)d (0.018)d
Percent employment in 0.027 0.039 0.032 0.025
manufacturing (1960) (0.018) (0.018)c (0.019) (0.017)
Percent change city −0.009 0.000 −0.005 −0.005
population (1960–70) (0.012) (0.014) (0.012) (0.012)
Constant 0.008 −0.069 −0.002 0.017
(0.029) (0.042) (0.028) (0.028)
Observations 89 89 89 89
R-squared 0.59 0.63 0.60 0.60
a. Heteroskedasticity-adjusted Huber-White robust standard errors in parentheses. Dependent variable is constructed using the residuals from Equation 2 reported in Column 2 of Table A3 as reported in Section V. Continuous dependent variables are normalized by the sample standard deviation. In the fourth column, the short-term change in white exposure to nonwhites is instrumented with four plan features: pair and cluster, rezoning, magnets, and other voluntary.
effects of desegregation plans on white enrollment presented in Section IV suggest that white enrollment losses related to desegregation plans were large—about 15 to 20 log points after ten years. In addition, desegregation plans that increased whites’ exposure to nonwhites more and the number of nearby school districts were impor-tant predictors of white flight. This relationship holds even controlling for other fac-tors predictive of declining population during this period—the manufacturing share of enrollment in 1960 and the change in population between 1960 and 1970. If desegregation plans did not affect white enrollment, we would not expect charac-teristics of desegregation plans and the number of districts to be related to white flight.
Court-ordered desegregation plans increased racial integration in schools, dramati-cally in many cases. However, in many districts, desegregation plans’ ability to reduce segregation effectively in the long run was limited by the decision to exclude the much-whiter suburban districts. The policies were generally enforced and were suc-cessful in many districts, but for districts that were surrounded by many other public school districts, short-term reductions in segregation were largely undone by the behavioral response of white families.
Although we would ultimately like to know the effect of desegregation plans on the educational and labor market outcomes of the minority students they were designed to help, changes in minorities’ exposure to whites is an important intermediate meas-ure of the success of these plans. In addition, the white enrollment losses documented here may have implications for other aspects of desegregation plans’ success. For example, possible negative effects of desegregation plans on property values would make it more difficult for districts to raise revenue.
Appendix
Data
A. Enrollment Data
Enrollment by race at the school level for years before 1987 was obtained from Unicon Research Corporation. The data were originally collected for a report of the U.S. Commission on Civil Rights (Welch and Light, 1987). Most of these data were collected from the following sources: the Office of Civil Rights of the U.S. Department of Education, Tauber-Wilson tapes, and individual school districts. Welch and Light indicate the district-years for which there is adequate data by race at the school level to calculate segregation indexes; I include these district-years in the sam-ple. Data for 1987 to 1998 were taken from the National Center for Education Statistics (NCES) Common Core of Data (CCD) Public School Universe (PSU), which includes enrollment by race at the school level.
per-cent of the reported total enrollment. (In general, entire states were missing racial breakdowns, so the precise cutoffs used are not important.)
B. Year of Major Plan Implementation
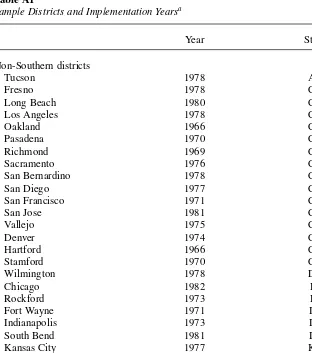
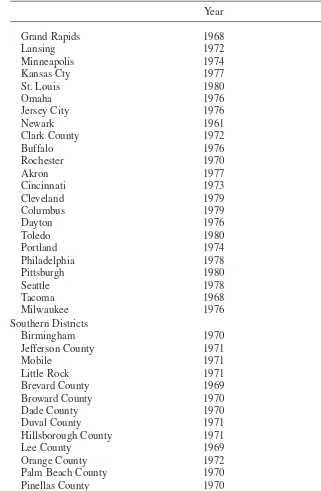
Welch and Light list all of the plans they identified for each district (their Appendix Table A3). I use the year of the first plan they classify as “major” with one exception. Conversations with officials familiar with the San Jose school districts’ desegregation plans indicate that the district implemented a major plan in 1986 after the Welch and Light report; I therefore use 1986 as the implementation date for San Jose. The trends for the dissimilarity index show large breaks in segregation around the time of major plan implementation for most districts, suggesting that this is a reasonable measure of when the policy was implemented. The districts and implementation year are listed in Table A1.
C. Number of School Districts in Metropolitan Area
I use the 1990 Census Metropolitan Statistical Area (MSA) definitions for areas out-side New England and New England County Metropolitan Areas (NECMA) for New England. For each district in the sample, I count the number of school districts in the same metropolitan area in 1968, based on the Elementary and Secondary School Civil Rights Survey, conducted by the Department of Health, Education, and Welfare (HEW). Some areas have separate elementary and secondary school districts as well as special or administrative districts. I only county districts that have positive enroll-ment for eleenroll-mentary school (districts that include high school only are not counted separately from the elementary school districts covering the same territory).
D. District Area
I use GIS software to calculate the area of districts in the sample. Ideally, I would cal-culate the area before plan implementation. However, this is essentially equivalent to calculating the area for 1990 since these districts’ boundaries changed little if at all.
E. Percent in Private Schools and Percent in Manufacturing
Percent in private schools and percent in manufacturing were taken from the 1960 City Data Book (based on Census data). Each district is assigned a value for its city. Percent in private schools is total private school enrollment through secondary school divided by total enrollment. Percent in manufacturing is manufacturing employment divided by total employment.
F. Percent Change in City Population
Percent change in city population is the log change in population taken from the 1960 and 1970 City Data Books (based on Census data). Each district is assigned a value for its city. Initial Segregation, Enrollment, White Share of Enrollment, and Density.
G. Preplan Segregation, Enrollment, and Density
Ideally, I would measure segregation (dissimilarity index), total enrollment, and the white share of enrollment in a single year, before any districts implemented a plan, to indicate the initial conditions. Because not all districts have data available for all years, I do not use a single year as the initial conditions year. I used the latest year between 1966 and 1968 for which a district both had data and had not yet imple-mented a plan. Districts that did not have data satisfying these criteria were dropped from the analysis. Limiting the sample to districts that implemented after 1968 (so their initial conditions variables are measured consistently in 1968) does not affect the results. Density is the total students (in 1966–68) divided by district area.
Table A1
Sample Districts and Implementation Yearsa
Year State
Non-Southern districts
Tucson 1978 AZ
Fresno 1978 CA
Long Beach 1980 CA
Los Angeles 1978 CA
Oakland 1966 CA
Pasadena 1970 CA
Richmond 1969 CA
Sacramento 1976 CA
San Bernardino 1978 CA
San Diego 1977 CA
San Francisco 1971 CA
San Jose 1981 CA
Vallejo 1975 CA
Denver 1974 CO
Hartford 1966 CT
Stamford 1970 CT
Wilmington 1978 DE
Chicago 1982 IL
Rockford 1973 IL
Fort Wayne 1971 IN
Indianapolis 1973 IN
South Bend 1981 IN
Kansas City 1977 KS
Wichita 1971 KS
Boston 1974 MA
New Bedford 1976 MA
Springfield 1974 MA
Table A1 (continued)
Year State
Grand Rapids 1968 MI
Lansing 1972 MI
Minneapolis 1974 MN
Kansas Cty 1977 MO
St. Louis 1980 MO
Omaha 1976 NE
Jersey City 1976 NJ
Newark 1961 NJ
Clark County 1972 NV
Buffalo 1976 NY
Rochester 1970 NY
Akron 1977 OH
Cincinnati 1973 OH
Cleveland 1979 OH
Columbus 1979 OH
Dayton 1976 OH
Toledo 1980 OH
Portland 1974 OR
Philadelphia 1978 PA
Pittsburgh 1980 PA
Seattle 1978 WA
Tacoma 1968 WA
Milwaukee 1976 WI
Southern Districts
Birmingham 1970 AL
Jefferson County 1971 AL
Mobile 1971 AL
Little Rock 1971 AR
Brevard County 1969 FL
Broward County 1970 FL
Dade County 1970 FL
Duval County 1971 FL
Hillsborough County 1971 FL
Lee County 1969 FL
Orange County 1972 FL
Palm Beach County 1970 FL
Pinellas County 1970 FL
Polk County 1969 FL
Volusia County 1969 FL
Atlanta 1973 GA
Dougherty County 1980 GA
Muskogee County 1971 GA
Fayette County 1972 KY
Table A1 (continued)
Year State
Jefferson County 1975 KY
Caddo Parish 1969 LA
Calcasieu Parish 1969 LA
E. Baton Rouge Parish 1970 LA
Jefferson Parish 1971 LA
New Orleans Parish 1961 LA
Rapides Parish 1969 LA
Terrebonne Parish 1969 LA
Baltimore 1974 MD
Harford County 1965 MD
Prince Georges County 1973 MD
Cumberland County 1969 NC
Gaston County 1970 NC
Mecklenburg County 1970 NC
New Hanover County 1969 NC
Lawton 1973 OK
Oklahoma City 1972 OK
Tulsa 1971 OK
Charleston County 1970 SC
Greeneville County 1970 SC
Richland County 1970 SC
Memphis 1973 TN
Nashville 1971 TN
Amarillo 1972 TX
Austin 1980 TX
Dallas 1971 TX
Ector County 1982 TX
El Paso 1978 TX
Fort Worth 1973 TX
Houston 1971 TX
Lubbock 1978 TX
San Antonio 1969 TX
Waco 1973 TX
Norfolk 1970 VA
Pittsylvania County 1969 VA
Roanoke 1970 VA
Raleigh County 1973 WV
The Journal of Human Resources 586
Table A2
Average Effects of Desegregation Plans on Dissimilarity Indexa
Full Sample Balanced Panel
Years since Plan Implementation
−6 years 0.042 −0.002 −0.003
(0.011)d (0.012) (0.012)
−5 years −0.000 −0.009 −0.013
(0.016) (0.016) (0.016)
−4 years −0.011 −0.021 −0.023 0.077 0.049 0.044
(0.015) (0.015) (0.014) (0.014)d (0.018)d (0.018)c
−3 years 0.010 0.003 0.002 0.045 0.032 0.031
(0.014) (0.014) (0.014) (0.018)c (0.019)b (0.019)b
−2 years 0.022 0.008 0.010 0.032 0.026 0.025
(0.013)b (0.013) (0.013) (0.018)b (0.019) (0.018)
−1 year −0.003 −0.009 −0.008 0.018 0.015 0.015
(0.012) (0.012) (0.012) (0.018) (0.018) (0.018)
0 years — — — — — —
— — — — — —
1 year −0.183 −0.167 −0.169 −0.140 −0.139 −0.137
(0.012)d (0.012)d (0.012)d (0.018)d (0.018)d (0.018)d
2 years −0.241 −0.216 −0.219 −0.185 −0.184 −0.180
(0.012)d (0.012)d (0.012)d (0.018)d (0.019)d (0.018)d
3 years −0.255 −0.220 −0.225 −0.197 −0.193 −0.192
(0.012)d (0.012)d (0.012)d (0.018)d (0.020)d (0.019)d
4 years −0.262 −0.223 −0.226 −0.205 −0.198 −0.198
(0.012)d (0.012)d (0.012)d (0.018)d (0.020)d (0.019)d
5 years −0.264 −0.223 −0.223 −0.212 −0.205 −0.205
(0.012)d (0.013)d (0.013)d (0.019)d (0.021)d (0.021)d
6 years −0.267 −0.223 −0.222 −0.210 −0.204 −0.202
(0.012)d (0.013)d (0.013)d (0.019)d (0.022)d (0.022)d
7 years −0.269 −0.222 −0.221 −0.212 −0.202 −0.204
(0.013)d (0.014)d (0.014)d (0.019)d (0.024)d (0.023)d
8 years −0.269 −0.220 −0.219 −0.207 −0.193 −0.197
(0.012)d (0.014)d (0.014)d (0.019)d (0.024)d (0.024)d
9 years −0.277 −0.226 −0.225 −0.223 −0.208 −0.212
(0.013)d (0.014)d (0.014)d (0.020)d (0.026)d (0.025)d
10 years −0.273 −0.219 −0.219 −0.213 −0.196 −0.201
(0.013)d (0.015)d (0.015)d (0.019)d (0.027)d (0.026)d
11 years −0.270 −0.212 −0.215 −0.206 −0.187 −0.192
(0.013)d (0.015)d (0.015)d (0.020)d (0.028)d (0.028)d
12 years −0.269 −0.208 −0.214 −0.204 −0.184 −0.189
(0.012)d (0.016)d (0.015)d (0.019)d (0.029)d (0.028)d
13 years −0.272 −0.210 −0.216 −0.206 −0.187 −0.190
Table A2 (continued)
Full Sample Balanced Panel
14 years −0.277 −0.214 −0.220 −0.207 −0.188 −0.191
(0.013)d (0.017)d (0.016)d (0.019)d (0.032)d (0.031)d
15 years −0.265 −0.206 −0.210 −0.184 −0.178 −0.178
(0.009)d (0.017)d (0.017)d (0.014)d (0.033)d (0.032)d Year controls
Fixed effects No Yes No No Yes No
Quartic No No Yes No No Yes
Number of 3,003 3,003 3,003 1,462 1,462 1,462
observations
R-squared 0.82 0.84 0.83 0.81 0.82 0.82
Number of 108 108 108 51 51 51
districts
a. Huber-White standard errors in parentheses. Coefficients from Columns 2 and 5 are plotted in Figure 2. The full sample includes all districts that implemented a court-ordered plan at some time; the balanced panel includes only districts that had data available for at least four years before and 15 years after implementation. b. Significant at 10 percent level.
c. Significant at 5 percent level. d. Significant at 1 percent level.
Table A3
Average Effects of Desegregation Plans on Nonwhite Exposure to Whitesa
Full Sample Balanced Panel
Years since Plan Implementation
−6 years 0.075 0.101 0.100
(0.011)d (0.011)d (0.011)d
−5 years 0.092 0.089 0.090
(0.015)d (0.014)d (0.014)d
−4 years 0.086 0.087 0.086 −0.002 −0.007 −0.004
(0.014)d (0.013)d (0.013)d (0.012) (0.015) (0.015)
−3 years 0.048 0.046 0.048 −0.004 −0.006 −0.007
(0.013)d (0.013)d (0.012)d (0.015) (0.016) (0.016)
−2 years 0.012 0.021 0.020 −0.004 −0.009 −0.007
(0.012) (0.011)b (0.011)b (0.015) (0.016) (0.015)
−1 year 0.025 0.029 0.028 −0.002 −0.004 −0.004
(0.012)c (0.011)d (0.011)d (0.015) (0.015) (0.015)
0 years — — — — — —
— — — — — —
1 year 0.127 0.112 0.114 0.075 0.081 0.078
The Journal of Human Resources 588
Table A3 (continued)
Full Sample Balanced Panel
2 years 0.156 0.132 0.136 0.086 0.095 0.093
(0.011)d (0.011)d (0.011)d (0.015)d (0.016)d (0.015)d
3 years 0.154 0.125 0.128 0.078 0.092 0.091
(0.011)d (0.011)d (0.011)d (0.016)d (0.016)d (0.016)d
4 years 0.149 0.117 0.120 0.073 0.091 0.090
(0.011)d (0.011)d (0.011)d (0.015)d (0.017)d (0.016)d
5 years 0.142 0.110 0.110 0.065 0.090 0.088
(0.012)d (0.012)d (0.012)d (0.016)d (0.018)d (0.017)d
6 years 0.136 0.103 0.103 0.055 0.085 0.084
(0.012)d (0.012)d (0.012)d (0.016)d (0.018)d (0.018)d
7 years 0.132 0.098 0.099 0.049 0.082 0.082
(0.012)d (0.012)d (0.012)d (0.016)d (0.020)d (0.019)d
8 years 0.123 0.092 0.092 0.038 0.076 0.077
(0.012)d (0.013)d (0.012)d (0.016)c (0.020)d (0.020)d
9 years 0.120 0.092 0.092 0.036 0.078 0.080
(0.012)d (0.013)d (0.013)d (0.016)c (0.022)d (0.021)d
10 years 0.112 0.086 0.086 0.029 0.074 0.078
(0.012)d (0.013)d (0.013)d (0.016)b (0.023)d (0.022)d
11 years 0.103 0.080 0.081 0.018 0.068 0.072
(0.012)d (0.014)d (0.014)d (0.016) (0.024)d (0.023)d
12 years 0.099 0.078 0.081 0.012 0.066 0.071
(0.012)d (0.014)d (0.014)d (0.016) (0.024)d (0.024)d
13 years 0.093 0.076 0.080 0.006 0.067 0.071
(0.012)d (0.015)d (0.014)d (0.016) (0.026)d (0.025)d
14 years 0.090 0.076 0.080 −0.001 0.065 0.069
(0.012)d (0.015)d (0.015)d (0.016) (0.027)c (0.026)d
15 years 0.048 0.066 0.071 −0.045 0.056 0.057
(0.008)d (0.016)d (0.015)d (0.012)d (0.028)c (0.027)c Year controls
Fixed effects No Yes No No Yes No
Quartic No No Yes No No Yes
Number of 3,003 3,003 3,003 1,462 1,462 1,462
observations
R-squared 0.86 0.88 0.88 0.84 0.85 0.85
Number of 108 108 108 51 51 51
districts
a. Huber-White standard errors in parentheses. Coefficients from Columns 2 and 5 are plotted in Figure 3. The full sample includes all districts that implemented a court-ordered plan at some time; the balanced panel includes only districts that had data available for at least four years before and 15 years after implementation. b. Significant at 10 percent level.