Vegetation Diversity 137 Vol. 17, No. 2: 137 – 146, Maret 2017
VEGETATION DIVERSITY AND INTENSITY OF PLANT
PESTS AND DISEASES IN TWO POLYCULTURE SYSTEMS
IN TANGGAMUS DISTRICT
Sudiono1,3, Surjono Hadi Sutjahyo2, Nurheni Wijayanto2, Purnama Hidayat2, & Rachman Kurniawan2
1Doctoral Program of Natural Resource and Environment Management, Institut Pertanian Bogor
Jl. R. Pajajaran Baranangsiang, Bogor 16151
2Postgraduate Program, Institut Pertanian Bogor
Jl. Kamper Kampus IPB Dramaga, Bogor 16680
3Plant Protection Department, Faculty of Agriculture, Lampung University
Jl. Prof. Dr. Sumantri Brodjonegoro No 1, Bandar Lampung 35145 E-mail: [email protected]
ABSTRACT
Vegetation diversity and intensity of plant pests and diseases in two polyculture systems in Tanggamus District. The
vegetable crop management cannot be separated from infestation of plant pest and disease which influences the quality and quantity of crop yield. The pest organism development is influenced by agroecosystem. The objective of this research was to analyze vegetation diversity and intensity of pest and disease in Tanggamus District. Methods used in this research were analysis of vegetation diversity based on Shannon index, percentage of pests damage and diseases incidence. The results showed that the vegetation diversity in polyculture of agriculture typology were 11 plant species with diversity index of 0.64; while in polyculture of agroforestry typology there were 11 plant species with diversity index of 0.74 and both of these indices were less than 1 (H’ < 1). The percentage of pests damage in the polyculture of agriculture larger than polyculture of agroforestry typology ranging from 7.20% to 81.67% and 3.04% to 26.67% respectively. While the incidence of disease in polyculture of agriculture ranging from 0.65% up to 100% and polyculture of agroforestry typology 0.65% up to 68.00%.
Key words: polyculture of agriculture, polyculture of agroforestry, Shannon Index
ABSTRAK
Keanekaragaman vegetasi dan intensitas hama dan penyakit tanaman sayuran pada dua sistem polikultur di
Kabupaten Tanggamus. Pengelolaan tanaman sayuran tidak terlepas dari adanya gangguan oleh organisme pengganggu
tanaman yang berdampak terhadap kualitas dan kuantitas produksi sayuran yang dalam perkembangan organisme tersebut dipengaruhi oleh agroekosistem. Tujuan penelitian ini adalah menganalisis keanekaragaman vegetasi tumbuhan dan besarnya serangan hama dan penyakit tanaman pada tanaman sayuran di Kabupaten Tanggamus. Metode penelitian yang digunakan yaitu analisis keanekaragaman vegetasi berdasarkan indek Shannon, persentase serangan hama dan kejadian penyakit. Hasil penelitian menunjukkan keanekaragam vegetasi di tipologi polikultur pertanian tercatat 11 species tumbuhan dengan indek keanekaragaman vegetasi sebesar 0,64; sedangkan pada tipologi polikultur agroforestri tercatat 11 species tumbuhan dengan indek keanekaragaman sebesar sebesar 0,74 yang keduanya lebih kecil dari 1 (H’ < 1). Intensitas serangan hama dan kejadian penyakit tanaman pada tipologi polikultur pertanian lebih besar dibandingkan polikultur agroforestri dengan kisaran hama sebesar 7,20% sampai 81,67% berbanding 3,04% sampai 26,67% dan penyakit antara 0,65% sampai 100% berbanding 0,65% sampai 68,00%.
Kata kunci: indeks Shanon, polikultur pertanian, polikultur agroforestri
INTRODUCTION
An agricultural typology or landscape has different aesthetical qualities from one to another. This depends on diversity of plant types to cultivate. Polyculture of agriculture and agroforestry are examples
very influential in determining agriculture productivity level. Diversity in an agricultural landscape attracts attentions from many experts, because it contributes significantly to the agriculture productivity, food sustainability, financial profit, and conservation of nature (Liu et al., 2013).
Plant diversity in an agroecosystem can reduce the effects of pest and diseases through some ways both individually and in combinations, including some effects of pest oppression in visual and pest smelling ways, disorders in pest life cycles, reducing inoculums because there is no host plant, antagonist mechanism, the plant physiology resistance because sufficiency of plant nutrients, natural predator conservation, and agricultural landscape effects such as physical barriers and micro climate changes (Ratnadass et al., 2012). Global practices of diversity are familiar to agriculture people, because the agriculture activity covering 25-30% areas in the world is an important activity influencing diversity.
There is a correlation between agroecosystem diversity and pest disease incidence with indicators such as level of pests/disease incidence, low productivity, and pesticide residue. Some research results showed that agrochemical treatments (especially pesticide an fertilizer) had caused problem social and environmental changes (Altieri et al., 1984; Altieri, 1999; Scherret al., 2008). Agricultura l and forestry environment managements are keys for conservation of diversity which significantly improve richness and abundances of species, while tree able to reduce able to improve pest, pathogen incidence, and also to provide ecology services in strengthening beneficial insects (Batary et al., 2011; Tomback et al., 2016; Aluja et al., 2014).
Agriculture systems in developing countries with relatively small sizes of land provide opportunities to reduce effects of pest and disease through practices of increase diversity. This method is very important in conducting sustainable agriculture system (Simon et al., 2010, Muniappan & Heinrichs, 2014). The objective of pest management is to cont ribute agriculture sustainability with some different aspects such as food sustainability, balanced relationship between human and ecosystem, and ecosystem conser vation. The agroecosystem diversification efforts often reduce negative effects of modern agriculture or agricultural industry (Timprasert et al., 2014; Gurr et al., 2013; Savary et al., 2012). Agriculture landscape is representation of habitat including plants, forests, wet lands, and grass land. The diversity of vegetation can serve the dynamics of pest and natural enemy (Philpott, 2013).
The objective of this research was to analyze the vegetation diversity and the damage of pests and the incidence of disease vegetable crop in Tanggamus District Lampung Province.
MATERIALS AND METHODS
Study Site. This research was conducted in Gisting and Sumberejo Subdistrict, Tanggamus District Lampung Province and Laboratory of Plant Pests and Disease of Faculty of Agriculture, Lampung University, from March to November 2015.
Research Procedure. Data in this research were vegetation diversity, damage of pests and the disease of incidence in some vegetable crops in polyculture of agriculture and polyculture of agroforestry typologies.
This research used quadrant sampling technique. The research locations were taken purposively to represent typology of the regions i.e. the polyculture with crop (polyculture of agriculture) and polyculture with forest tree (polyculture of agroforestry). From each typology, five were selected where plot 400 m2. From
each plot the following variable were observed 1) plant species and numbers, 2) vegetation diversity, 3) intensity of pests damage, and 4) incidence of disease. The vegetation diversity was determined using Shannon’s index (Shannon and Wienner in Ludwig & Reynolds, 1988) as follows:
With:
H’ = Shannon’s diversity index of vegetatiton in
sampled plot
ni = Number of species in plot
n = Total number of plant in plot
s = Total number of plant species observed in the
plot
The value of diversity index is defined as folow (1) H’ > 3, indicates high diversity high; (2) H’ 1 < H’ < 3 indicates moderate diversity, and (3) H’ < 1 indicates low diversity (Mason & McDonald, 1986).
P = Intensity of pest damage or disease incidence n = Numbers of plants damaged by pests or disease in
plot
N = Total numbers of plants observed in plot
RESULTS AND DISCUSSION
The research was conducted in Gisting Atas Village, Gisting Bawah Village of Gisting Subdistrict, and Wonoharjo Village, Sumber Muyo Village, Simpang Kanan Village of Sumberejo Subdistrict in Tanggamus District, Lampung Province. The site can be reached in ± 2-3 hours by car from the Province capital Bandar Lampung. This site at 600-1000 m above the sea level (asl) with air temperature ranges of 18-28 oC.
Geographically Tanggamus District is located at 104°18’-105°12’ east longitude and 5°05’-5°56’ south latitude, with flat to wavy topographies. The most common
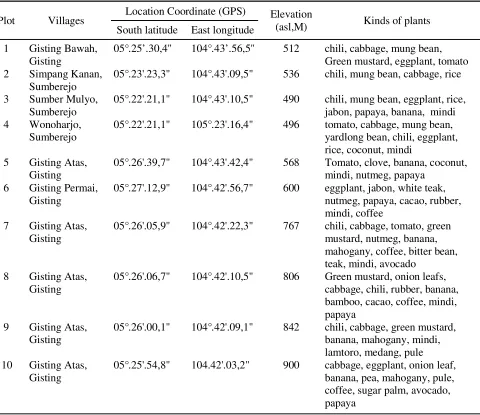
vegetation types in these regions area annual plants such as rice and horticultures and perennial plants such as cacao and coffee. There is a conservational forest in the Tanggamus mountain slopes and this is integrated to Conservational Forest Management Unit (or KPHL) of North Kota Agung area, Lampung Province. The forest site is located in the vicinity of local state crop area and the site is managed jointly by the local community and local goverment ini form community forest or public forest (or Hkm). This public forest has poor road acces. It only footpaths where farmers can walk along or drive their motorcyle. Meanwhile the agricultural fields in the sitewith relatively flat topography were owned and cultivated by local farmers. Infrastructures like roads, drainages, irrigation, and electricity are available in this agricultural part of the site. The summary of research site presented in Table 1.
Table 1. Summary of information abaout research site
Plot Villages Location Coordinate (GPS) Elevation
(asl,M) Kinds of plants
South latitude East longitude
1 Gisting Bawah,
Gisting
05°.25’.30,4" 104°.43’.56,5" 512 chili, cabbage, mung bean,
Green mustard, eggplant, tomato
2 Simpang Kanan,
Sumberejo
05°.23'.23,3" 104°.43'.09,5" 536 chili, mung bean, cabbage, rice
3 Sumber Mulyo,
Sumberejo
05°.22'.21,1" 104°.43'.10,5" 490 chili, mung bean, eggplant, rice,
jabon, papaya, banana, mindi
4 Wonoharjo,
Sumberejo
05°.22'.21,1" 105°.23'.16,4" 496 tomato, cabbage, mung bean,
yardlong bean, chili, eggplant, rice, coconut, mindi
5 Gisting Atas,
Gisting
05°.26'.39,7" 104°.43'.42,4" 568 Tomato, clove, banana, coconut,
mindi, nutmeg, papaya
6 Gisting Permai,
Gisting
05°.27'.12,9" 104°.42'.56,7" 600 eggplant, jabon, white teak,
nutmeg, papaya, cacao, rubber, mindi, coffee
7 Gisting Atas,
Gisting
05°.26'.05,9" 104°.42'.22,3" 767 chili, cabbage, tomato, green
mustard, nutmeg, banana, mahogany, coffee, bitter bean, teak, mindi, avocado
8 Gisting Atas,
Gisting
05°.26'.06,7" 104°.42'.10,5" 806 Green mustard, onion leafs,
cabbage, chili, rubber, banana, bamboo, cacao, coffee, mindi, papaya
9 Gisting Atas,
Gisting
05°.26'.00,1" 104°.42'.09,1" 842 chili, cabbage, green mustard,
banana, mahogany, mindi, lamtoro, medang, pule
10 Gisting Atas,
Gisting
05°.25'.54,8" 104.42'.03,2" 900 cabbage, eggplant, onion leaf,
The average air temperature were 24.8 oC and
22 oC for polyculture of agriculture typology and for
polyculture of agroforestry typology with relative humidity of 88.4% and 90.6% respectively.
Vegetation Diversity. There were 11 species in polyculture of agriculture typology with 13,564 individual plants (Table 2). Shannon’s diversity index showed the polyculture of agriculture was H’ < 0.1. Only in Gisting Bawah Village that H’ > 1. Shannon’s diversity index in all polyculture of agriculture plot was 0.64. This value indicated that the diversity in these regions was low. The lower the diversity index is in a particular location, then the lower the productivity.
There were 11 species with 5,373 individual plants in polyculture of agroforestry field; they were vegetables such as mung bean, nutmeg, and green mustard, and plants such as khailendra, mindi, and mahogany. Shannon’s diversity index in all polyculture of agriculture plot was 0,74. In addition, in the polyculture of agroforestry locations there were other plant types such as bitter bean, coffee, nutmeg, ranti, and papaya (Table 3). The diversity index in this polyculture of agroforestry typology was under 1 (H < 1), and this indicated that these locations had low diversity (Mason & McDonald, 1986). However, the diversity index of polyculture of agroforestry site was higher than
polyculture of agriculture site (0.74 > 0.64) (Table 2). At least, these low diversity index need serious attention, not only both in ecology and economy considerations, but aslo for their existences and management of sustainability.
The vegetation diversity index in the research locations varies but under 1 (H’ < 1) and this indicates a low diversity. This low diversity makes it susceptible to pest intensity or disease incidence. Increasing habitat diversity can increase abundance of natural enemies and their effectiveness to overcome the pest. Higherplant diversity provide alternative hosts, nectars and pollens for adult parasitoids and predators, protect nests and maintain pest population in lower number (Altieri, 1993).
Pests Damage Charateristic and Vegetation Diversity Index. The pests damage rate in vegetables with polyculture of agroforestry typology was averagely lower than polyculture of agriculture typology. The pests found were diamondback moth (Plutella sp.), aphids (Aphis sp.), whitefly (Bemisia sp.), cabbage cluster caterpillar (Crocidolomia sp.), fruit fly (Bactrocera
sp.), corn earworm (Helicoverpa sp.), and armyworms
(Spodoptera sp.) in cabbage has highest pests damage intensity of 47.2%, while white mustard only had one type of pest, diamond back moth (Plutella sp.), with 7.2% pests damage (Table 4).
Location code Village, Sub district Individual
numbers
Plant species numbers
Plant diversity Index (H')
Polyculture of agricultureplot
A1 Gisting Bawah, Gisting 2,045 5 1.04
A2 Simpang Kanan, Sumberejo 1,565 4 0.71
A3 Sumber Mulyo, Sumberejo 3,187 2 0.59
A4 Wonoharjo, Sumberejo 5,363 3 0.16
A5 Gisting Atas, Gisting 1,804 5 0.70
Total 13,964 11 0.64
Polyculture of agroforestry plot
F1 Gisting Permai, Gisting 215 5 1.09
F2 Gisting Atas, Gisting 1,160 6 0.91
F3 Gisting Atas, Gisting 2,308 3 0.73
F4 Gisting Atas, Gisting 182 4 0.91
F5 Gisting Atas, Gisting 1,508 2 0.06
Total 5,373 11 0.74
T
a
bl
e
3.
V
ege
ta
ti
o
n
in
v
a
ri
o
us
po
lyc
ul
tur
e
o
f
a
g
ri
cul
tur
e
a
n
d
a
g
ro
fo
re
st
ry
t
y
po
lo
g
ie
s
in
T
a
n
g
g
a
m
us
D
is
tr
ic
Pests dama ge intensity on polyculture of agroforestry typology was lower than that polyculture of agriculture typology. Chili and tomato had highest pests damage intensity (13.6% and 11.8%), while green mustard and currant tomato (rampai) had no pests damage. A possible reason for the lower pests damage on polyculture of agroforestry was that agroecosystem
might be stable so that it was able to facilitate better activities of natural enemies which in enable them control and maintain pest population at low number.
The differences of seasons and population dynamics influence insects in different habitats which change over time and according to development stages (Teodore et al., 2008). Natural vegetation is able to Table 4.Crop pest damage in polyculture of agriculture and agroforestry typologies in Tanggamus District
Location code Type of plant Kinds of pests Species Pests damage (%)
Polyculture of agriculture
A1 White mustard Diamond back moth Plutella sp. 7.2
Mung bean - -
Chili - -
Currant tomato - -
A2 Yardlong bean Aphids Aphis sp. 81.7
Pod borer Lepidoptera sp. 10.6
Chili Whitefly Bemisia sp. 32.9
A3 Eggplant - - -
Mung bean Diamond back moth Plutella sp. 67.0
Leaf caterpillar Crocidolomia sp. 18.7
A4 Cabbage Diamond back moth Plutella sp 63.0
Leaf caterpillar Crocidolomia sp. 63.0
Green mustard - -
Chili Aphids Aphis sp. 31.4
Whitefly Bemisia sp. 31.4
A5 Tomato Fruit flies Bactrocera sp. 12.6
Corn earwarm Helicoverpa sp. 10.3
Whitefly Bemisia sp. 12.6
Leek - - -
Polyculture of agaroforestry
F1 Mung bean Diamond back moth Plutella sp. 8.8
F2 Currant tomato - - -
Green mustard - - -
F3 Tomato Whitefly Bemisia sp. 9.0
Corn earwarm Helicoverpa sp. 5.0
Fruit flies Bactrocera sp. 20.0
F4 Currant tomato Armyworm Spodoptera sp. 6.0
Corn earwarm Helicoverpa sp. 3.0
F5 Chili Trips Trips sp. 3.0
Armyworm Spodoptera sp. 11.0
Table 5. Vegetation diversity index (H’) and pests damage percentage for vegetable crop in Tanggamus District
Location code Village, Sub district Vegetation diversity index
(H')
Ranges of pest damage (%)
Polyculture of agriculture
A1 Gisting Bawah, Gisting 1.26 0.00-7.20
A2 Simpang Kanan, Sumberejo 0.71 10.64-81.67
A3 Sumber Mulyo, Sumberejo 0.59 18.74-66.99
A4 Wonoharjo, Sumberejo 0.83 31.36-62.99
A5 Gisting Atas, Gisting 0.70 10.32-12.59
Polyculture of agroforestry
F1 Gisting Permai, Gisting 1.09 0.00-8.83
F2 Gisting Atas, Gisting 0.91 0.00-0.00
F3 Gisting Atas, Gisting 0.73 5.08-19.92
F4 Gisting Atas, Gisting 1.01 2.50-6.41
F5 Gisting Atas, Gisting 0.75 3.04-26.67
promote natural enemy diversity with varying effects; the same agroecosystem can explain some pests which are more influential than others in a more complex landscape (Henri et al., 2015).
The agroforestry landscape perspective enables knowledge transfer between farmers on agronomy and ecology in participative approach to help driving a management which balances economy and ecology needs (Tscharntke et al., 2011). Polyculture of agriculture reduces ecological sustainability of land use system, while environment change and extreme climate require higher quality responses than ever. Adaptation strategies to environment changes such as cultivating shady trees and field conversion type are common practices to improve sustainability against environment changes. Polyculture of agriculture pattern in a wide overlay is a good for plant growth and development as well as for pest migration from one place to another. A uniformed cultivar in a wide field creates the same situations with effects of interactions of pest, pathogen, and plant growth (Altieri & Nichollas, 2004).
The vegetation diversity index in polyculture of agriculture system ranged 0.59-1.26; while in polyculture of agroforestry system the vegetatiaon diversity index ranged 0.73-1.09 (Table 5). The diversity index value is lower than criteria to use; under 1 (H’< 1). Lower diversity index value means lower productivity as indications of severe ecology pressure and unstable ecosystem. Mason & McDonald (1986) suggests that in diversity index value is lower than 1, it means low diversity. If it is around 1-3, it means moderate diversity, and more than 3 means high diversity. The low diversity index in the locations are caused by the facts that the field is continually planted, with low supply of soil
nutrients, excessive sun rays, and few water supply, which make trees are difficult to grow in these areas.
Charateristic of Disease Incidence and Vegetation Diversity Index. The disease incidence rate in polyculture of agriculture typology varies between 1% to 100%, pathogen infection of Colletotrichum sp. and
Alternaria sp. caused 100% disease incidence especially in mung bean. The infections are was low in white mustard, cabbage, eggplant, chili, and their pathogens are Erwinia sp., Plasmidiophora sp., and Cersospora
sp. The only vegetable crop free from disease is leek, and the highest rate of disease occurred in tomato.
The disease incidence in vegetable crop in polyculture of agroforestry typology is lower than in polyculture of agriculture typology range 0.65% to 100% versus 0.67% to 68.00%. The highest disease incidence is in tomato and chili, while the lowest is in currant tomato vegetable (Table 6).
Each typology has different diversity index and disease incidence rate and polyculture of agroforestry have higher diversity index than polyculture of agriculture (Table 7). The polyculture of agriculture typology is potentially more susceptible to disease than the polyculture of agroforestry. The agroforestry pattern influences on pest and disease are not only depending on the types of plants, but also depending on other factors including kinds of pests, pest preferences, and micro climate (Tomlinson et al., 2015; Pumarino et al.,
Table 6. Types diseases and incidence in some vegetable crops in polyculture of agriculture and agroforestry typologies in Tanggamus District
Location
code Kinds of plant Disease Pathogen
Disease incidence
(%) Polyculture of agriculture
A1 White mustard Leaf blight Erwinia sp. 6.24
Clubroot Plasmodiophora sp. 0.65
Leaf spots Xanthomonas sp. 1.91
Mung bean Anthracnose Colletotrichum sp. 100.00
Black spot leaf Alternaria sp. 100.00
Chili Leaf curl Curly virus 5.33
Yellow leaf Gemini virus 1.34
Currant tomato - - -
A2 Yardlong bean Black spot leaf Uromyces sp. 10.90
Cowpea witches-broom Cowpea witches-broom virus 2.05
Chili Anthracnose Colletotrichum sp. 100.00
Leaf curl Curly virus 100.00
A3 Eggplant Leaf spot Cercospora sp. 3.70
Water molds Phytophthora sp. 1.00
Mung bean Anthracnose Colletotrichum sp. 20.00
Black spot leaf Uromyces sp. 80.00
A4 Cabbage Leaf spot Cercospora sp. 1.26
Clubroot Plasmodiophora sp. 1.51
Green mustard Clubroot Plasmodiophora sp. 0.50
Leaf blight Erwinia sp. 2.83
Chili Leaf curl Curly virus 33.90
Yellow leaf Gemini virus 16.95
A5 Tomato Anthracnose Colletotrichum sp. 78.00
Leaf spots Cercospora sp. 68.00
Soft rot Phytophthora sp. 100.00
Leek - Erwinia sp. -
Polyculture of agroforestry
F1 Mung bean Black spot leaf Uromyces sp. 5.00
F2 Currant tomato - - -
Green mustard Leaf blight Erwinia sp. 2.34
F3 Tomato Leaf spot Cercospora sp. 16.02
Black spot leaf Uromyces sp. 10.81
Anthracnose Colletotrichum sp. 40.00
F4 Currant tomato Leaf spot Cercospora sp. 14.06
Anthracnose Colletotrichum sp. 4.69
F5 Chili Anthracnose Colletotrichum sp. 68.00
Yellow leaf Gemini virus 0.67
Table 7. Vegetation diversity index (H’) and disease incidence in vegetable crop in Tanggamus District
Location code Village, sub district Vegetation diversity index
(H')
Ranges of disease incidence (%)
Polyculture of agriculture
A1 Gisting Bawah, Gisting 1.26 0.65-100
A2 Simpang Kanan, Sumberejo 0.71 2.05-100
A3 Sumber Mulyo, Sumberejo 0.59 1.00-80.00
A4 Wonoharjo, Sumberejo 0.83 0.50-33.90
A5 Gisting Atas, Gisting 0.70 68.00-100
Polyculture of agroforestry
F1 Gisting Permai, Gisting 1.09 0.65-8.83
F2 Gisting Atas, Gisting 0.91 0.00-0.00
F3 Gisting Atas, Gisting 0.73 5.08-19.92
F4 Gisting Atas, Gisting 1.01 2.50-6.41
F5 Gisting Atas, Gisting 0.75 3.04-26.67
CONCLUSION
The conclusions of this research are that the vegetation diversity in polyculture of agriculture typology were 11 plant species with diversity index of 0.64, while in polyculture of agroforestry typology there were 11 plant species with diversity index of 0.74, and both of these indices were less than 1 (H’ < 1). The percentage of pests damage in the polyculture of agriculture larger than polyculture of agroforestry typology the range of 7.20 to 81.67% and 3.04 to 26.67% and the incidence disease in polyculture of agriculture ranged from 0.65 up to 100% and polyculture of agroforestry typology 0.65 up to 68.00%.
ACKNOWLEDGMENT
We thank the majors of Plant Protection, Faculty of Agriculture, Lampung University for supporting this research and for providing facilities to do laboratorium analysis.
REFERENCES
Altieri MA, Letourneau DK, & Risch SJ. 1984. Vegetation diversity and insect pest outbreaks.
Critical Reviews in Plant Sciences. 2(2): 131– 169.
Altieri MA & Nicholls. 2004. Agroecology and the Search for a Truly Sustainable Agriculture.
United Nations Environment Progr amme. Mexico.
Altieri MA. 1993. Ethnoscience and biodiversity: key elements in the design of sustainable pest management systems for small farmers in
developing countries. Agr. Ecosyst. Environ. 46: 257–272.
Altieri MA. 1999. The ecological role of biodiversity in agroecosistems. Agr. Ecosyst. Environ. 74(1): 19–31.
Aluja M, Sivinski J, Driesche RV, Dadda AA, & Guillen L. 2014. Pest management through tropical tree conservation. Biodivers. Conserv. 23(4): 831– 853.
Batary P, Baldi A, Kleijn D, & Tscharntke T. 2011. Landscape-moderated biodiversity effects of agrienvironmental management: a meta-analysis.
Proc. Biol. Sci. 278(1713): 1894–1902.
Henri DC, Jones O, Tsiattalos A, Thebault E, Seymour CL, & Van Voen FJF. 2015. Natural vegetation benefits synergistic control of the three main insect and pathogen pests of a fruit crop in Southern Africa. J. Appl. Ecol. 52(4): 1092–1101.
Gurr GM, Wratten SD, & Luna JM. 2003. Multi-function agricultural biodiversity: pest management and other benefits. Basic Appl. Ecol. 4: 107–116.
Ludwig JA & JF Reynolds JF. 1988. Statistical Ecology: an Primer Methods and Computing. John Wiley and Sons Inc. New York.
Mason CF & McDonald SM. 1986. Otters: Ecology and Conservation. Cambridge University Press. Cambridge.
Muniappan R, Director P, & Heinrichs EA. 2014. Biodiversity and integrated pest management: working together for a sustainable future. Crop Prot. 61: 102–110.
Philpott SM. 2013. Biodiversity and pest control services.
Reference Module in L ife Sciences Encyclopedia of Biodiversity 1: 373–385.
Plantegenest M, May CL, & Fabre F. 2007. Landscape epidemiology of plant diseases. J. R. Soc. Interface. 4(16): 963–972.
Pumarinoa L, Sileshib GW, Gripenbergc S, Kaartinena R, Barriosb E, Muchaned MN, Midegae C, & Jonssona M. 2015. Effects of agroforestry on pest, disease and weed control: a meta-analysis. Basic Appl. Ecol. 16(7): 573–582.
Ratnadass A, Fernandes P, Avelino J, & Habib R. 2012. Plant species diversity for sustainable management of crop pests and diseases in
agroecosystems: a review. Agron. Sustain. Dev.
32(1): 273–303.
Savary S, Horgan F, Willocquet L, & Heong K.L. 2012. A review of principles for sustainable pest management in rice. Crop Prot. 32: 54–63.
Scherr SJ & McNeely JA. 2008. Biodiver sity conservation and agricultural sustainability: towards a new paradigm of ‘ecoagriculture’ landscapes. Philos Trans. R. Soc. Lond. B. Biol. Sci. 363: 477–494.
Simon S, Bouvier JC, Debras JF, &Sauphanor B. 2010. Diversity and pest management in orchard systems. A review. Agron. Sustain. Dev. 30: 139– 152.
Teodor o A, Klein AM, & Tscharntke T. 2008. Environmentally mediated coffee pest densities in relation to agroforestry management, using hierarchical partitioning analyses. Agr. Ecosyst. Environ. 125(1–4): 120–126.
Timprasert S, Datta A, & Ranamukhaarachchi SL. 2014. Factors determining adoption of integrated pest management by vegetable growers in Nakhon Ratchasima Province, Thailand. Crop Prot. 62: 32–39.
Tomback DF, Resler LM, Keane RE, Pansing ER,
Andrade AJ, & Wagner AC. 2016. Community
structure, biodiversity, and ecosystem services in treeline whitebark pine communities: potential impacts from a non-native pathogen. Forests 7: 1–22.
Tomlinson I, Potter C, & Bayliss H. 2015. Managing tree pests and diseases in urban settings: the case of oak processionary moth in London, 2006-2012.
Urban For. Urban Gree.14(2): 286–292.