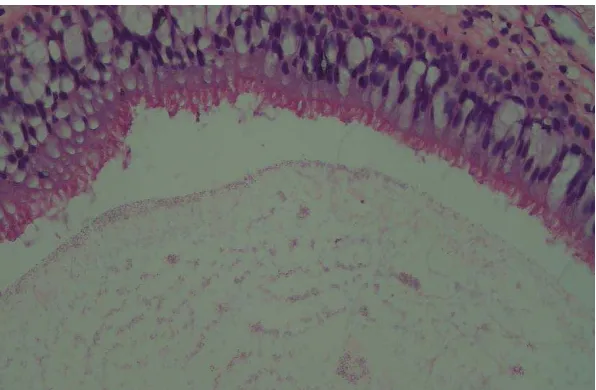
LAMPIRAN 2. Hasil Pemeriksaan Mukosa Sinus Dengan Pewarnaan Hematoxyline Eosin
Gambar 7.1. Pelapis Epitel Permukaan yang Terdiri dari Sel-sel Pseudostratified Bersilia (Pembesaran 100x)
LAMPIRAN 3. Data Sampel
Hidung tersumbat Sekret Hidung Nyeri Wajah Penciuman Berkurang Lama Gejala Polip Merokok Biofilm
ya ya ya tidak 24 tidak tidak tidak
tidak ya ya tidak 48 tidak tidak tidak
ya ya ya ya 3 tidak tidak tidak
ya tidak ya tidak 120 tidak tidak tidak
ya tidak tidak ya 6 tidak ya tidak
tidak ya ya tidak 24 tidak tidak ya
ya tidak tidak tidak 12 tidak tidak ya
ya ya tidak ya 60 tidak ya ya
ya ya ya tidak 3 tidak tidak ya
ya ya ya ya 6 tidak tidak tidak
ya ya ya tidak 24 tidak tidak ya
LAMPIRAN 4. Data Output Frequency Table
jk Frequenc
y Percent
Valid Percent
Cumulative Percent
Valid Lk 19 57,6 57,6 57,6 Percent
Cumulative Percent
Valid tidak 2 6,1 6,1 6,1 Percent
Cumulative Percent
Valid tidak 8 24,2 24,2 24,2 Percent
Cumulative Percent
ya 22 66,7 66,7 100,0 Percent
Cumulative Percent
Valid tidak 16 48,5 48,5 48,5 Percent
Cumulative Percent
Valid tidak 21 63,6 63,6 63,6 Percent
Cumulative Percent
Valid tidak 23 69,7 69,7 69,7 Percent
Cumulative Percent
ya 22 66,7 66,7 100,0 Percent
Cumulative Percent
Valid negatif 12 36,4 36,4 36,4 Percent
Cumulative Percent
Valid tidak 12 36,4 36,4 36,4 Percent
Cumulative Percent
Valid tidak 21 63,6 63,6 63,6 Percent
Cumulative Percent
e coli 2 6,1 6,1 9,1
kleb pneu 8 24,2 24,2 33,3
pseudo
ae 1 3,0 3,0 36,4
stap aur 5 15,2 15,2 51,5
stap epid 16 48,5 48,5 100,0
Total 33 100,0 100,0
Descriptives
Statistic
Std. Error
usia Mean 37,67 2,688
95% Confidence Interval for Mean
Lower
Interquartile Range 24
Skewness ,057 ,409
Descriptives
Statistic
Std. Error LamaGejal
a
Mean 27,91 5,865
95% Confidence Interval for Mean
Lower
Variance 1135,27
3
Std. Deviation 33,694
Minimum 3
Maximum 120
Range 117
Interquartile Range 26
Skewness 1,793 ,409
Kurtosis 2,325 ,798
Crosstabs
Case Processing Summary Cases
Valid Missing Total
N Percent N Percent N Percent
jk * Biofilm 33 100,0% 0 0,0% 33 100,0%
Hidung Tersumbat *
Seket Hidung *
Biofilm 33 100,0% 0 0,0% 33 100,0%
Nyeri Wajah * Biofilm 33 100,0% 0 0,0% 33 100,0%
Penciuman
Berkurang * Biofilm 33 100,0% 0 0,0% 33 100,0%
Polip * Biofilm 33 100,0% 0 0,0% 33 100,0%
jk * Biofilm
Crosstab
Biofilm
Total
+ -
jk laki-laki Count 13 6 19
Expected
Count 12,7 6,3 19,0
Expected
Count 9,3 4,7 14,0
% within jk 64,3% 35,7% 100,0%
% within
Biofilm 40,9% 45,5% 42,4%
Total Count 22 11 33
Expected
Count 22,0 11,0 33,0
% within jk 66,7% 33,3% 100,0%
% within
Chi-Square Tests
Value df
Asymp. Sig. (2-sided)
Exact Sig. (2-sided)
Exact Sig. (1-sided)
Pearson Chi-Square ,062a 1 ,803
Continuity
Correctionb ,000 1 1,000
Likelihood Ratio ,062 1 ,804
Fisher's Exact Test 1,000 ,547
Linear-by-Linear
Association ,060 1 ,806
N of Valid Cases 33
a. 1 cells (25,0%) have expected count less than 5. The minimum expected count is 4,67.
b. Computed only for a 2x2 table
Risk Estimate
Value
95% Confidence Interval
Lower Upper
Odds Ratio for jk (laki-laki /
perempuan)
1,204 ,280 5,182
For cohort Biofilm = + 1,064 ,648 1,747
For cohort Biofilm = - ,884 ,337 2,322
Hidung Tersumbat * Biofilm
Crosstab
Biofilm
Total
+ -
Hidung Tersumbat
ya Count 21 10 31
Expected Count 20,7 10,3 31,0
% within Hidung
Tersumbat 67,7% 32,3% 100,0%
% within Biofilm 95,5% 90,9% 93,9%
tidak Count 1 1 2
Expected Count 1,3 ,7 2,0
% within Hidung
Tersumbat 50,0% 50,0% 100,0%
% within Biofilm 4,5% 9,1% 6,1%
Total Count 22 11 33
Expected Count 22,0 11,0 33,0
% within Hidung
Tersumbat 66,7% 33,3% 100,0%
% within Biofilm 100,0% 100,0% 100,0%
Chi-Square Tests
Value df
Asymp. Sig. (2-sided)
Exact Sig. (2-sided)
Exact Sig. (1-sided)
Pearson Chi-Square ,266a 1 ,606
Continuity
Correctionb ,000 1 1,000
Likelihood Ratio ,252 1 ,616
Linear-by-Linear
Association ,258 1 ,611
N of Valid Cases 33
a. 2 cells (50,0%) have expected count less than 5. The minimum expected count is ,67.
b. Computed only for a 2x2 table
Risk Estimate
Value
95% Confidence Interval
Lower Upper
Odds Ratio for Hidung Tersumbat (ya / tidak)
2,100 ,119 37,122
For cohort Biofilm = + 1,355 ,332 5,533
For cohort Biofilm = - ,645 ,147 2,825
N of Valid Cases 33
Seket Hidung * Biofilm
Crosstab
Biofilm
Total
+ -
Seket Hidung
% within Seket
Chi-Square Tests
Value df
Asymp. Sig. (2-sided)
Exact Sig. (2-sided)
Exact Sig. (1-sided)
Pearson Chi-Square 1,320a 1 ,251
Continuity
Correctionb ,516 1 ,473
Likelihood Ratio 1,272 1 ,259
Fisher's Exact Test ,391 ,233
Linear-by-Linear
Association 1,280 1 ,258
N of Valid Cases 33
a. 1 cells (25,0%) have expected count less than 5. The minimum expected count is 2,67.
Risk Estimate
Value
95% Confidence Interval
Lower Upper
Odds Ratio for Seket
Hidung (ya / tidak) 2,571 ,500 13,229
For cohort Biofilm = + 1,440 ,691 3,003
For cohort Biofilm = - ,560 ,220 1,427
N of Valid Cases 33
Nyeri Wajah * Biofilm
Crosstab
Biofilm
Chi-Square Tests
Value df
Asymp. Sig. (2-sided)
Exact Sig. (2-sided)
Exact Sig. (1-sided)
Pearson Chi-Square ,273a 1 ,602
Continuity
Correctionb ,017 1 ,896
Likelihood Ratio ,278 1 ,598
Fisher's Exact Test ,709 ,454
Linear-by-Linear
Association ,264 1 ,607
N of Valid Cases 33
a. 1 cells (25,0%) have expected count less than 5. The minimum expected count is 3,67.
b. Computed only for a 2x2 table
Risk Estimate
Value
95% Confidence Interval
Lower Upper
Odds Ratio for Nyeri
Wajah (ya / tidak) ,656 ,134 3,205
For cohort Biofilm = + ,875 ,541 1,415
For cohort Biofilm = - 1,333 ,438 4,054
Penciuman Berkurang * Biofilm
Crosstab
Biofilm
Total
+ -
Penciuman Berkurang
ya Count 10 7 17
Expected Count 11,3 5,7 17,0
% within Penciuman
Berkurang 58,8% 41,2% 100,0%
% within Biofilm 45,5% 63,6% 51,5%
tidak Count 12 4 16
Expected Count 10,7 5,3 16,0
% within Penciuman
Berkurang 75,0% 25,0% 100,0%
% within Biofilm 54,5% 36,4% 48,5%
Total Count 22 11 33
Expected Count 22,0 11,0 33,0
% within Penciuman
Berkurang 66,7% 33,3% 100,0%
% within Biofilm 100,0% 100,0% 100,0%
Chi-Square Tests
Value df
Asymp. Sig. (2-sided)
Exact Sig. (2-sided)
Exact Sig. (1-sided)
Pearson Chi-Square ,971a 1 ,325
Continuity
Correctionb ,379 1 ,538
Likelihood Ratio ,980 1 ,322
Linear-by-Linear
Association ,941 1 ,332
N of Valid Cases 33
a. 0 cells (0,0%) have expected count less than 5. The minimum expected count is 5,33.
b. Computed only for a 2x2 table
Risk Estimate
Value
95% Confidence Interval
Lower Upper
Odds Ratio for Penciuman
Berkurang (ya / tidak)
,476 ,108 2,108
For cohort Biofilm = + ,784 ,481 1,278
For cohort Biofilm = - 1,647 ,593 4,574
N of Valid Cases 33
Polip * Biofilm
Crosstab
Biofilm
Total
+ -
Polip ya Count 10 2 12
Expected
Count 8,0 4,0 12,0
% within
Polip 83,3% 16,7% 100,0%
% within
tidak Count 12 9 21 Expected
Count 14,0 7,0 21,0
Expected
Count 22,0 11,0 33,0
% within
Polip 66,7% 33,3% 100,0%
% within
Biofilm 100,0% 100,0% 100,0%
Chi-Square Tests
Value df
Asymp. Sig. (2-sided)
Exact Sig. (2-sided)
Exact Sig. (1-sided)
Pearson Chi-Square 2,357a 1 ,125
Continuity
Correctionb 1,326 1 ,250
Likelihood Ratio 2,514 1 ,113
Fisher's Exact Test ,249 ,124
Linear-by-Linear
Association 2,286 1 ,131
N of Valid Cases 33
a. 1 cells (25,0%) have expected count less than 5. The minimum expected count is 4,00.
Risk Estimate
Value
95% Confidence Interval
Lower Upper
Odds Ratio for Polip
(ya / tidak) 3,750 ,654 21,514
For cohort Biofilm = + 1,458 ,931 2,284
For cohort Biofilm = - ,389 ,100 1,512
N of Valid Cases 33
Case Processing Summary
Biofilm
Cases
Biofilm Statistic
Std. Error
usia + Mean 38,95 3,471
95% Confidence Interval for Mean
Variance 265,093
Std. Deviation 16,282
Minimum 10
Maximum 70
Range 60
Interquartile Range 27
Skewness -,261 ,491
Kurtosis -,632 ,953
- Mean 35,09 4,214
95% Confidence Interval for Mean
Lower
Interquartile Range 11
Skewness ,963 ,661
Kurtosis ,468 1,279
LamaGejal a
+ Mean 25,05 5,834
95% Confidence Interval for Mean
Lower
Bound 12,91
Upper
5% Trimmed Mean 22,33
Interquartile Range 23
Skewness 1,781 ,491
Kurtosis 2,621 ,953
- Mean 33,64 13,504
95% Confidence Interval for Mean
Lower
Variance 2006,05
5
Std. Deviation 44,789
Minimum 3
Maximum 120
Range 117
Interquartile Range 44
Skewness 1,569 ,661
Tests of Normality
Biofilm
Kolmogorov-Smirnova Shapiro-Wilk
Statistic df Sig. Statistic df Sig.
*. This is a lower bound of the true significance. a. Lilliefors Significance Correction
T-Test
Notes
Output Created 14-AUG-2016 13:35:23
Comments
Input Data D:\aaPROJECT\aSTATISTIK\TH
T\SYLVI\Agustus 2016\DATA DR sYLVI tht.sav
Active Dataset DataSet1
Filter <none>
Weight <none>
Split File <none>
N of Rows in Working
Data File 33
Missing Value Handling
Definition of Missing User defined missing values are treated as missing.
Syntax T-TEST GROUPS=biofilm(1 2) /MISSING=ANALYSIS
/VARIABLES=usia /CRITERIA=CI(.95).
Resources Processor Time 00:00:00,02
Elapsed Time 00:00:00,01
Group Statistics
Biofilm N Mean
Std. Deviation
Std. Error Mean
usia + 22 38,95 16,282 3,471
- 11 35,09 13,975 4,214
Independent Samples Test Levene's
Test for Equality
of Variance
s t-test for Equality of Means
F Sig. t df
95% Confidence Interval of the
Difference
Lower Upper
usia Equal variances assumed
Equal variances not assumed
,70
Mann-Whitney Test
Ranks
Test Statisticsa
LamaGejal a
Mann-Whitney U 120,000
Wilcoxon W 373,000
Z -,039
Asymp. Sig. (2-tailed) ,969 Exact Sig.
[2*(1-tailed Sig.)] ,985
b
Personalia Penelitian
I. Peneliti Utama
Nama : dr. Silvia
Jabatan : PPDS T.H.T.K.L
Fakultas : Kedokteran
Perguruan Tinggi : Universitas Sumatera Utara
Bidang Keahlian : T.H.T.K.L
Waktu Disediakan : 12 Jam / Minggu
II. Komisi Pembimbing
A. Nama : Prof. Dr. dr. Delfitri Munir, Sp.T.H.T.K.L (K)
NIP : 195401261984031001
Pangkat / Golongan : Pembina (IV/a)
Jabatan : Guru Besar
Fakultas : Kedokteran
Perguruan Tinggi : Universitas Sumatera Utara Bidang Keahlian : T.H.T.K.L
Waktu Disediakan : 6 Jam / Minggu
B. Nama : dr. Andrina YM. Rambe, Sp.T.H.T.K.L
(K)
NIP : 197106221997032001
Pangkat / Golongan : Penata (III/c)
Jabatan : Lektor Kepala
Fakultas : Kedokteran
Perguruan Tinggi : Universitas Sumatera Utara Bidang Keahlian : T.H.T.K.L
Daftar Riwayat Hidup
Data Pribadi
Nama : dr. Silvia
Tempat / Tanggal lahir : Jakarta / 28 April 1984
Jabatan : PPDS T.H.T.K.L
Agama : Islam
Alamat Rumah : Komplek Tasbih Blok C No. 5 Medan
No. HP : 081396666003
Alamat e-mail : silviahaykal28@gmail.com
Instansi : Fakultas Kedokteran Universitas Sumatera
Utara
Nama Orang Tua : 1. Ayah : Achmad Tasnimi
2. ibu : Alice
Pendidikan Formal
1990-1996 : SDI Al-Bayyinah Jakarta
1996-1999 : SMP Negeri 131 Jakarta
1999-2002 : SMU Negeri 49 Jakarta
2012- Sekarang : S-2 Magister Kedokteran Klinik dan Program Pendidikan Dokter Spesialis T.H.T.K.L Fakultas Kedokteran USU / RSUP H. Adam Malik Medan
Riwayat Pekerjaan
2009-2010 : PTT di Puskesmas IDI Rayeuk Aceh Timur
2010-2011 : Dokter Perusahaan PT. IKPP Perawang
Keanggotaan Organisasi Profesi Nasional / Internasional
2012 - sekarang : Anggota IDI Cabang Medan Sumatera Utara
2012 - sekarang : Anggota Muda PERHATI-KL Cabang
Sumatera Utara