Determine Teaching Quality of Lecturer
Based on Student Questioner Using
T
Statistics
Adi Setiawan and Hanna Arini Parhusip
Department of Mathematics, Faculty of Science and Mathematics, Satya Wacana Christian University Jl. Diponegoro 52-60 Salatiga 50711
adi setia [email protected]
Abstract
This paper proposes a method to measure teaching quality based on student ques-tioner. TheT statistics is proposed as a measurement of teaching quality. Based on the real questioner data, the statistical T value can be determined for every item and course. Using the proposed statistics, the course which has highest qual-ity among 15 courses can be determined.
Keywords: teaching quality,T statistics
Introduction
Several recent papers explained methods to model teaching quality. For exam-ple paper by Ahmed et al. (2010) and Barone et al. (2010). In this paper we propose the method to measure teaching quality based on student questioner by usingT statistics. The explained method will be described by using real data to find which courses have highest quality.
Theory
Every end of semester, students fill a questioner to measure student satisfy of teaching. The questioner consist of 16 items of question (e.g. utilizes content scope and sequence planning, clearness of assignments and evaluations, etc). The score of every item in a questioner fornstudent can be expressed as
Xi= (X1i, X2i, ..., Xpi) (1) where Xki = 0, 1, 2 or 3 for k = 1, 2, , p and i = 1,2, , n which means very bad, enough, satisfactory and good. In this case,pis the number of items in the questioner that is used to measure the teaching quality and n is the number of students. The teaching quality for every item and course can be determined by using the proposedT statistics :
Ti=
Xi
Si/√n
(2)
whereXi= Pn
k=1Xik/nis the arithmetic mean and Si standard deviation of the
fori= 1,2, ..., p. This following example gives description of the method by using data that contains 3 items and 2 courses. A good quality of teaching is determined by the average of statisticalTvalue for every items. Teaching quality is called good if the average of score of questioner is big and the standard deviation is small. Base on the data, the statisticalT value of course 1 : ¯X = (8.58,9.05,9.05) with the average 8.90 and the statistical T value of course 2 : ¯X = (6.24,5.80,5.72) with the average is 5.93. We can conclude that the teaching quality of Course 1 is better than Course 2.
Table 1. Example of data (15 students for Course 1 and 7 students Course 2)
C1 1 2 3 4 5 6 7 8 9 10 11 12 13 14 15
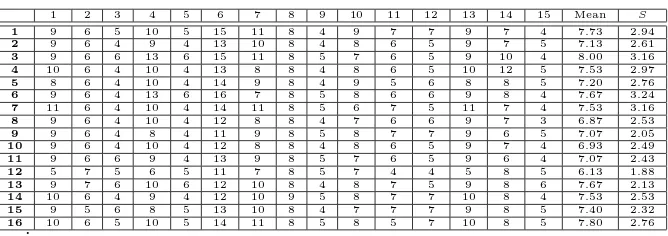
The used data are taken from student questioners. The data come from 15 courses and 203 questioner sheets. Every course has different the number of stu-dents who filled questioner sheets. Every course can be determined the statistical T value for every item and the teaching quality is determined by average of T value. The results are presented in Table 2. Based on Table 2, we can conclude that the third item has the highest average ofT value that means student is very satisfy with ’Systematical in Lecturing’. In other side, the twelfth item has the lowest average ofT value that means students does not satisfy with the twelfth item.
Table 2. The statisticalT value for every item and course
Table 3. Table of courses and the teaching quality (the average ofT statistics)
No. Course Name The number of studentsn X¯ T =p
10 Course 10 20 1.98 7.59 11 Course 11 11 2.20 6.28 12 Course 12 10 1.84 5.69 13 Course 13 15 2.67 9.05 14 Course 14 13 2.41 7.78 15 Course 15 5 2.01 4.33
.
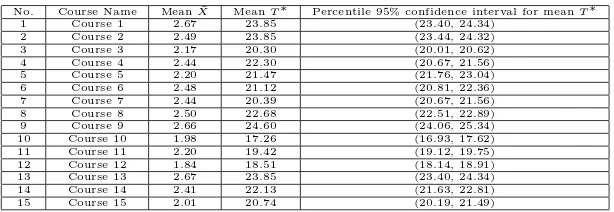
Simulation Study
Simulation study is done by sample (sizeN1) from the old sample. New sample is made by selection one by one score observation for every item with replacement until N1 times. The statistical T value is calculated based on the new sample. The procedure is done until a big number B times such that we have B new statistical T valuesT∗
1, T2∗, ...., TB∗. The histogram of B new statistical T values can be presented.
Table 4. The measure of teaching quality based on simulated sample
No. Course Name Mean ¯X MeanT∗ Percentile 95% confidence interval for meanT∗
1 Course 1 2.67 23.85 (23.40, 24.34)
2 Course 2 2.49 23.85 (23.44, 24.32)
3 Course 3 2.17 20.30 (20.01, 20.62)
4 Course 4 2.44 22.30 (20.67, 21.56)
5 Course 5 2.20 21.47 (21.76, 23.04)
6 Course 6 2.48 21.12 (20.81, 22.36)
7 Course 7 2.44 20.39 (20.67, 21.56)
8 Course 8 2.50 22.68 (22.51, 22.89)
9 Course 9 2.66 24.60 (24.06, 25.34)
10 Course 10 1.98 17.26 (16.93, 17.62)
11 Course 11 2.20 19.42 (19.12, 19.75)
12 Course 12 1.84 18.51 (18.14, 18.91)
13 Course 13 2.67 23.85 (23.40, 24.34)
14 Course 14 2.41 22.13 (21.63, 22.81)
15 Course 15 2.01 20.74 (20.19, 21.49)
Conclusion
This paper proposes a measurement method of teaching quality by usingT statis-tics. Statistics T is used to measure the teaching quality. Using the proposed statistics, the course which is has highest quality among 15 courses can be deter-mined.
Acknowledgement
This research is funded by Satya Wacana Christian University.
References
[1] Ahmed, I, M. M. Nawaz, Z. Ahmad, Zafar Ahmad, M. Z, Shaukat, A. Usman, Wasim-ul-Rehman, N. Ahmed, (2010), Does service quality affect student’s performance? Evidence from institutes of higher learing,Af rican Journal of Bussiness M anagementVol. 4 (12)
[2] Barone, S and E. L. Franco, 2010, TESF Methodology for Statistics Education Improvement,Journal of Statistics Education, Vol. 18 (3)
[3] Johnson ,R.A., and Wichern, D.W., 2007. Applied M ultivariate Statistical Analysis, 6th ed., Prentice Hall, New York.
[4] Tabachnick, B. G. and L. S. Fidell., 2007.U sing M ultivariate Statistics 5th edition, Pearson Education, Boston.
. Appendix
Question for students observation to measure the teaching quality : 1. Utilize content scope and sequence planning.
3. Systematical in Lecturing 4. Encourages Students attendance
5. Demonstrate accurate and current knowledge in subject field. 6. Creates and maintains an environment that supports learning. 7. Clearness of purpose on each assignment.
8. Attractiveness of the lecture.
9. Clearness of purpose on each assignment.
10. Lecture’s competence on stimulating students excitement. 11. Lecture’s competence on delivering idea.
12. Does teacher have available time to help students for the related topic outside the class ?
13. Effectiveness of time used in the class.