Qualifying Test
Evidence from School-Entry Laws
Elizabeth U. Cascio
Ethan G. Lewis
a b s t r a c t
How much can late schooling investments close racial and ethnic skill gaps? We investigate this question by exploiting the large differences in completed schooling that arise among teenagers with birthdays near school-entry cutoff dates. We estimate that an additional year of high school raises the Armed Forces Qualifying Test (AFQT) scores of minorities in the NLSY 79 by 0.31 to 0.32 standard deviations. These estimates imply that closing existing racial and ethnic gaps in schooling could close skill gaps by between 25 and 50 percent. Our approach also uncovers a significant direct effect of season of birth on test scores, suggesting that previous estimates using season of birth as an instrument for schooling are biased.
I.
Introduction
Racial and ethnic gaps in earnings remain a pervasive feature of American life. Skill differentials across groups—reflected in stark and persistent per-formance gaps on cognitive tests—are widely held to be the primary cause of this
phe-Elizabeth U. Cascio is an assistant professor in the Department of Economics at the University of California Davis, faculty research fellow at the National Bureau of Economic Research, and research fel-low at the Institute for the Study of Labor. Ethan G. Lewis is a research economist at the Federal Reserve Bank of Philadelphia. The authors thank two anonymous referees and seminar participants at the University of California Berkeley, the University of California Santa Cruz, and the 2004 Society of Labor Economists Annual Meeting for their helpful comments. Both authors gratefully acknowledge financial support from the Graduate Division and the Department of Economics at the University of California Berkeley. Cascio also gratefully acknowledges financial support from the Spencer Foundation. The views expressed herein are those of the authors and not necessarily those of these funders, the Federal Reserve Bank of Philadelphia, or the Federal Reserve System. The data used in this article can be obtained begin-ning October 2006 through September 2009 from Elizabeth U. Cascio, Department of Economics, UC Davis, eucascio@ucdavis.edu.
[Submitted March 2005; accepted September 2005]
nomenon (O’Neill 1990; Herrnstein and Murray 1994; Neal and Johnson 1996; Jencks and Phillips 1998; Carneiro, Heckman, and Masterov 2003). Test score gaps today are little different, if not larger, than they were in the late 1980s, with black and Hispanic children scoring 0.7 to 0.9 standard deviations below their white counterparts, depend-ing on subject and age at measurement. Extrapolatdepend-ing from current trends, racial skill gaps might well remain large through the end of this century (Neal 2005).
It is therefore not surprising that the process of skill formation and the attendant role of public policy are subjects of spirited inquiry and debate. An extreme view, taken by Herrnstein and Murray (1994), holds that genetic endowments are the pri-mary determinants of skill, in which case policy can do little to stimulate skill acqui-sition. A more widely accepted view, articulated by Jencks and Phillips (1998), among others, posits that investments in human capital can help to close skill differ-entials. However, the relative importance of public and private investments (for exam-ple, formal education versus being read to at home) and their optimal timing (earlier in life versus later) remains an open question. Attempts to examine these issues are complicated by the fact that investments in skill are related not only to innate abili-ties, but also to each other, making it difficult to separate the contributions of schools and families and therefore difficult to design policy.1
This paper uses a new strategy to identify the contribution of formal education to skill formation among teenagers. Our measure of skill is the widely used proxy avail-able in the 1979 National Longitudinal Survey of Youth (NLSY 79)—the Armed Forces Qualifying Test, or AFQT. We identify the effect of education by comparing the AFQT scores of teenagers with birthdays before their state’s school-entry cutoff date to those of teenagers with birthdays after, using same-aged individuals in other states as controls. Because of deferred school entry, teenagers with birthdays after entry cutoff dates tend to have completed less schooling than those with birthdays immediately prior, though the groups are close in age and arguably quite similar in terms of family background and innate abilities. While this assumption is compelling, variation across states in entry cutoff dates makes it possible for us to relax it by con-trolling for unrestricted functions of birth date.
This is not the first study to examine the relationship between schooling and test scores in general (see Ceci 1991 for a review) and between schooling and the AFQT in particular (Herrnstein and Murray 1994; Neal and Johnson 1996; Winship and Korenman 1997; Hansen, Heckman, and Mullen 2004).2However, this study moves the literature forward in several key ways. First, we identify the effect of education on test scores under less restrictive assumptions than previous studies. In particular, unlike Neal and Johnson (1996) and Hansen, Heckman, and Mullen (2004), we do not require that season of birth be excludable from the model. This makes our estimates more credible, because season of birth might reflect unobservable characteristics of
1. This identification problem is evidenced in literature on the black-white test score gap. Most studies in this literature are descriptive, assessing how the coefficient on a race indicator changes as more covariates are added to a model of test scores (for example, Phillips et al. 1998; Fryer and Levitt 2004). One notable exception is Krueger and Whitmore (2002), who estimate how an experimental class-size reduction in Tennessee affected the test scores of black and white children.
families (Bound, Jaeger, and Baker 1995; Bound and Jaeger 2000) and because small changes in age might have a direct effect on skill as a result of maturation and “life experience,” as long noted in the developmental psychology literature (Baltes and Reinert 1969; Cahan and Cohon 1989; Crone and Whitehurst 1999). We also estimate separate models by race, loosening another constraint in previous work on schooling and the AFQT. Analyzing a high-school-aged population, we are thus able to focus on subpopulations (minorities) and margins (high school dropout) that are highly rele-vant for policy.
We find that an additional year of formal education raises the AFQT scores of black teenagers by between 0.3 and 0.35 standard deviations, an effect size equivalent to about one-third of the black-white test score gap. We detect no evidence for blacks that the instrument is related to other observed determinants of AFQT performance, such as family background, supporting our interpretation of these estimates as causal inferences. For native-born Hispanics, the results are more sensitive to specification, but similar in magnitude, implying that another year of schooling increases test scores by between 0.35 and 0.4 standard deviations. The pooled minority sample yields more precisely estimated effects of between 0.31 and 0.32 standard deviations. For white teenagers, we cannot rule out similar effect sizes, but estimates are quite imprecise. We leave estimation of schooling effects for this population to future research.
Regardless of race, however, the data reject the exclusion restrictions on quarter of birth in Neal and Johnson (1996) and Hansen, Heckman, and Mullen (2004). This appears to be primarily due to a strong underlying seasonality in test scores, rather than a strong effect of age. Although we cannot separately identify age and cohort effects in this application, the birth-date effects are generally not consistent with the smooth monotonic evolution of test scores that aging implies. In fact, for minorities, we detect no evidence that aging raises test performance independently of formal edu-cation. Unless there are strong countervailing cohort effects—a possibility we cannot rule out—this finding suggests that informal investments do little to raise the test scores of minority teenagers.
Taken together, these findings suggest that schools can play an important role in building skill among minorities and in preventing test-score gaps from widening fur-ther into the teenage years. Thus, even though earlier policy interventions might be more cost effective (Cunha et al. 2005), policies devoted either to dropout prevention or to raising the productivity of public high schools might bestow valuable skills. Our estimates imply that closing existing racial and ethnic gaps in adult educational attainment alone could close skill gaps by between 25 and 50 percent.
The paper proceeds as follows. In the next section, we give further background and motivation, and in Section III, we formalize our identification strategy. In Section IV, we then briefly describe the AFQT and our estimation sample from the NSLY 79. Section V presents our findings, and Section VI discusses our results and concludes.
II. Background
administered at around the same time to all NSLY 79 respondents, and the test was intended to measure skill in an adult population, even though it also was administered to adolescents.
The model of interest is a production function for skill:
(1) Tis=as+iSis+blXi+}(Di)+wi+fis,
where Tis represents the AFQT score of individual iborn in state s; αs is a state-specific constant; Sisis schooling attainment at the time the test was administered; Xiis a vector of observed family background characteristics; and ψ(.) is some function of of birth date, Di. Because the data are essentially a cross-section, Direpresents age at the test date as well as cohort; as a result, age and cohort effects cannot be separately identified. The error term is then decomposed into two components: one due to unob-served abilities, ςi, and another due to random variation, εis. The term ςiincorporates not only the effects of genetic endowments, but also of variables that have been omit-ted from or incorrectly specified in the model. The parameter of interest is θ, which gives the effect of an additional year of completed education on AFQT performance.3 Because unobserved abilities jointly determine AFQT scores and grade level at the time of the test, ordinary least squares (OLS) estimates of θare likely to be biased. Past studies have dealt with this problem in one of two ways. The first approach attempts to control for ςiwith an early IQ or achievement test (Herrnstein and Murray 1994; Winship and Korenman 1997). This “value-added” approach will yield biased estimates of θif the early test score is not a perfect proxy for ability and unobserved “inputs” into the production of skill (Hansen, Heckman, and Mullen 2004; Todd and Wolpin 2003). There are also difficulties in implementing value-added specifications in the NLSY 79, where early tests are not necessarily comparable to the AFQT, or to each other, and where early tests are available only for a small subsample of respon-dents.4The value-added approach has moreover been rejected in other data where it is easier to implement (Todd and Wolpin 2004).
The alternative approach to identifying θemployed by existing studies is to con-struct an instrumental variable for Sis. One such instrument, used by Neal and Johnson (1996) and Hansen, Heckman, and Mullen (2004), is quarter of birth. The logic behind this instrument was first articulated by Angrist and Krueger (1991): Combined with compulsory schooling regulations, state minimum age regulations on school entry have historically generated within birth-year variation in educational attainment among adults in the United States. The relationship between season of birth and edu-cational attainment is even stronger in the school-aged population, so the instrument cannot be faulted as weak in this application. However, it may not be a valid instru-ment. For example, Bound and Jaeger (2000) show that quarter of birth is related to adult earnings in subpopulations not constrained by school-entry laws, and Bound, Jaeger, and Baker (1995) cite a collection of studies linking season of birth to school performance, as well as health and family background. Age in particular might be
3. Because age at school entry is not observed in the NLSY 79, schooling is measured as highest grade completed, rather than as the total number of years spent in school.
directly related to test scores—even among individuals in the same grade—because older students are more mature and might have accumulated more learning experi-ences outside of school. Though widely studied in the developmental psychology literature (see below), this possibility has also been disregarded in the value-added studies on the AFQT cited above, which like the quarter-of-birth based studies, control for birth date with only birth-year indicators.5
We use state minimum age requirements for school entry to construct an alternative instrument for Sis that allows us to address the weaknesses of previous research. Instead of using all season-of-birth variation in schooling, we identify the effect of education using only those differences in educational attainment that arise close to school-entry cutoff dates. A similar approach has been used by developmental psy-chologists attempting to separate schooling and age effects on test scores (Baltes and Reinert 1969; Cahan and Davis 1987; Cahan and Cohon 1989; Bentin, Hammer, and Cahan 1991; Ferreira and Morrison 1994; Varnhagen, Morrison, and Everall 1994; Bisanz, Morrison, and Dunn 1995; Morrison, Smith, and Dow-Ehrensberger 1995; Morrison, Griffith, and Alberts 1997; Crone and Whitehurst 1999) and recently in the
JHRto examine the effect of a year of early schooling (prekindergarten) on test per-formance (Gormley and Gayer 2005).6Like these studies, we allow small changes in birth date to have a direct effect on test scores, thus circumventing a potential bias of previous work.
However, our approach differs from even these studies in an important way. Given variation in school-entry dates across states, we can use individuals in other states (with different cutoffs) as controls. We need not force the birth-date effects to be smooth or monotonic. Our preferred specifications of ψ(.) are quite unrestrictive, including fixed effects for narrow cohorts defined by year and quarter or month of birth. Our approach therefore embeds previous instrumental variables approaches as a special (and testable) case. The smooth “age effects” of studies in the child-devel-opment literature also can be thought of as testable restrictions on ψ(.). We examine both hypotheses in Section V.
Compared with previous studies—both of schooling and the AFQT and schooling and test scores more generally—we thus take a less restrictive approach to identifica-tion. In practice, our approach appears to be more compelling: we almost always reject the assumptions on ψ(.) implicit in previous studies, but find considerable evi-dence in favor of our own identifying assumptions, which we lay out formally in the next section. This study also improves on existing research by estimating the model separately for blacks, whites, and Hispanics, who are likely to face different school-ing environments. Moreover, our sample, while still not large, is more than twice the size of those used in value-added studies on the effect of schooling on the AFQT.
5. These studies also omit state fixed effects and not all control for family background.
III. Identification Strategy
Our strategy is made possible by data on exact date of birth in the NLSY 79 and our knowledge of the school-entry regulations relevant for the cohorts in our estimation sample (see Appendix 1).7We begin by assigning each respondent to an “academic cohort”—the year in which he should have started school—given his exact birth date and the school-entry regulation in his birth state when he was age six. Absent large differences in grade progression rates across cohorts, academic cohort should be strongly related to completed education in a school-aged population.
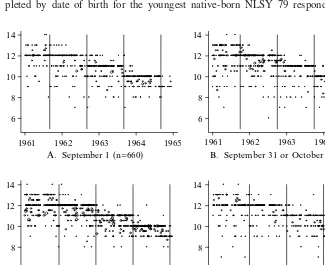
This relationship is suggested by Figure 1, which plots average highest grade com-pleted by date of birth for the youngest native-born NLSY 79 respondents, born
A. September 1 (n=660)
1961 1962 1963 1964 1965
1961 1962 1963 1964 1965 1961 1962 1963 1964 1965 6
8 10 12 14
6 8 10 12 14
6 8 10 12 14
B. September 31 or October 1 (n=815) 1961 1962 1963 1964 1965 6
8 10 12 14
C. December 1 (n=1,239) D. December 31 or January 1 (n=577)
Figure 1
Mean Schooling (Highest Grade) at the Test Date, by School Entry Cutoff and Exact Date of Birth
Notes: Samples are from the NLSY 79 and consist of all individuals for whom schooling at the test date, AFQT scores, and exact date of birth are observed. Individuals are assigned cutoff dates on the basis of state of birth. Point sizes represent the number of observations used to calculate the average. States are classified by cutoff dates in Appendix Table A1.
between 1961 and 1964.8Schooling is measured as of the summer of 1980, when the AFQT was administered to most respondents in the survey. The panels correspond to the modal cutoff dates for school entry among these cohorts and respondents with birthdays between any two adjacent vertical lines belong to the same academic cohort. The figure shows that there is considerable variation in schooling at the time the AFQT was administered, even among individuals born on the same day and in the same state. As noted above, this variation in educational attainment might be related to abilities or characteristics that cannot be observed.9Nonetheless, academic cohort does appear to be strong predictor of educational attainment. Consequently, large and arguably otherwise unpredictable differences in completed schooling occur among individuals with birthdays near the school-entry cutoff dates in their states of birth. This is particularly the case across the three youngest academic cohorts depicted in the figure (those predicted to have entered school between 1968 and 1970), who serve as the focus of our analysis.
We exploit these discrete differences in schooling through the following model:
(2) Sis s
冱
kC X D ,where Cisk; k= 69, 70 are indicator variables for academic cohort (with the 1968 cohort omitted to identify the model); and all other terms are analogous to those previously defined in Equation 1. With the effects of birth date specified in an unrestricted way (with a series of fixed effects), Equation 2 reduces to a generalized differences-in-differences model for schooling attainment. Although our sample size makes it infeasible to include fixed effects for date of birth in days, we are able to con-trol for fixed effects for birth date measured in quarters or months, as noted above.10 Coefficients on the academic cohort indicators in Equation 2, µk, give the average impact on schooling of being assigned to enter first grade in year k, relative to being assigned to enter in 1968, all else constant. Perfect compliance with school-entry laws would predict that µ68+j= −j, or that every one-year increase in academic cohort low-ers completed schooling at the test date by on average one year. More generally, if the marginal effect of academic cohort is constant across all cohorts under consideration,
µ68+j= µ.j, where µ< 0. We impose this restriction on Equation 2 to arrive at an alter-native model for schooling that is the focus of our analysis below.
We use Equation 2 and its restricted counterpart as first-stage models in estimating Equation 1 with two stage least squares (TSLS). Academic cohort is a valid instrument if it exhibits no relationship with ςi(or εis), conditional on the birth-date controls and other observable characteristics. The intuition is straightforward: There can be no sort-ing around school-entry cutoff dates, or no “gamsort-ing” of school-entry legislation
8. As mentioned above, respondents have been assigned school-entry dates on the basis of state of birth. In the few instances where state of birth is missing, we use state of residence at age 14 to assign cutoff dates, provided that a respondent reports having never moved.
9. For example, a substantial fraction of respondents are “below grade.” An individual may be below grade because of delayed school entry, grade repetition, or high school dropout. Each decision might be related to other factors (such as innate ability) that might directly influence test scores.
through birth timing. It is important to note here that delayed school entry or grade rep-etition does not represent a violation of this identification assumption; it is precisely this type of variation in schooling that suggests the need for an instrument. Rather, our identification strategy requires only that birthdaybe exogenous within a narrow win-dow of the cutoff date. Below we assess the credibility of this assumption by testing for a relationship between academic cohort and observed correlates of test scores, such as parental education, and by performing standard tests of over-identifying restrictions when TSLS estimates are based on Equation 2. As noted above, our approach also makes it possible to examine the identifying assumptions of past studies.
IV. Data
A. SampleOur data are drawn from the NLSY 79, a nationally representative, ongoing panel sur-vey of individuals born between 1957 and 1964. When first initiated in 1979, the survey had 12,686 participants between the ages of 14 and 22, more than 5,000 of whom constituted a supplemental sample of Hispanics, blacks, and economically dis-advantaged whites. In the summer and fall of 1980, the U.S. military’s Armed Services Vocational Aptitude Battery (ASVAB)—a ten-section written exam admin-istered to all entering military recruits—was given to 11,914 of the respondents, around 94 percent of the original sample. NLSY 79 participants were recruited to take the ASVAB through a Department of Defense project that sought a nationally repre-sentative sample of youths from which the Department could update the norms of the test from the previous World War II reference population. Because the ASVAB was designed to be appropriate only for individuals aged 17 and older, scores for the youngest respondents were not used for this purpose, though they were made avail-able to researchers (Center for Human Resource Research 2001).11
Each section of the ASVAB attempts to measure skills in a separate subject area. Some subject areas are academic, and some are vocational.12Four of the ten sections comprise the AFQT, used by the military as the primary criterion to determine eligi-bility for enlistment and “trainaeligi-bility” (Center for Human Resource Research 2001, p. 94). Originally, AFQT percentile scores were derived from a weighted sum of raw scores from two math and two verbal sections of the test. Beginning in 1989, the Department of Defense changed which math sections were in the AFQT, as well as the procedures for calculating the AFQT scores from the raw section scores.13In this paper, we use these revised AFQT scores, which we transform into standard deviation units so that our results can be more readily compared with previous studies.14
11. The average test score in our sample is therefore below the population average.
12. The subjects are general science, arithmetic reasoning, word knowledge, paragraph comprehension, numerical operations, coding speed, auto and shop information, math knowledge, mechanical comprehen-sion, and electronics information.
Our sample consists of respondents with nonmissing AFQT scores and nonmissing birth dates who should have entered first grade between 1968 and 1970 given state and year of birth.15We thereby focus on the youngest NLSY respondents, who would have been between the ages of 15 and 19 when the AFQT was administered. So that we have sample sizes sufficient to conduct the analysis separately by race, we use data on blacks and Hispanics from the supplemental sample. The resulting sample consists of 3,300 observations and is described in detail in Appendix Table A2. It is compara-ble to the sample used by Neal and Johnson (1996).
B. Summary Statistics
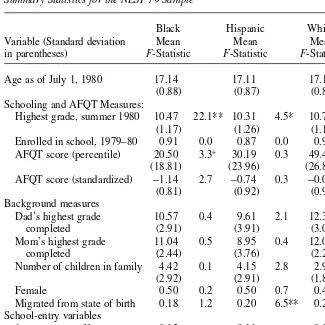
Table 1 presents summary statistics for key variables in our sample, stratified by race. Alongside the sample means are F-statistics that test for a zero coefficient on academic cohort (restricted to have a constant effect) in regressions that control for fixed effects for birth state and birth date measured in quarters.16Our sample reproduces the racial and ethnic differences in test scores, educational attainment, and family background charac-teristics that have been well-documented in the NLSY 79 and other survey data. For example, at age 17, minorities lag behind whites in completed schooling by between 0.23 and 0.39 years and in AFQT performance by between 0.7 and 1.1 standard deviations. Academic cohort appears to be a strong predictor of educational attainment, particularly for blacks (F-statistic = 22.1) and whites (F-statistic = 12.1). Given that quarter of birth enters the underlying model directly, this demonstrates that the instruments previously employed in the literature were at best crude attempts to capture variation in educational attainment induced by school-entry laws. The tabulations also show a marginally signif-icant relationship between academic cohort and AFQT scores for blacks, providing some preliminary evidence that schooling affects test performance in this population.
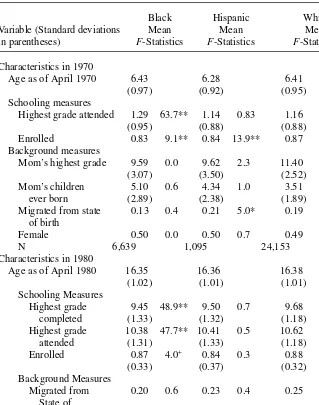
In support of the identifying assumptions of our model, we rarely find a significant relationship between academic cohort and observed correlates of test performance and where we do, the relationship is generally not found in auxiliary data on the same cohorts. For blacks, for example, F-statistics on academic cohort are around one or below for all background variables. For whites, maternal education and the probabil-ity that a test-taker is female are significantly related to academic cohort. However, the latter relationship makes it seem implausible that white families were gaming cut-off dates by timing births, because sex identification in utero was not likely to have been common in the early 1960s.17It seems more likely that the NLSY 79 contains a rare draw of whites. This conclusion is supported by the fact that we do not see the same relationships in the Census for the same cohorts, as shown in Table 2.18
Services (1992). The composite score contains more variation than the percentile rank; it is also closer to being normally distributed. However, we obtain comparable results using the revised AFQT percentile score, the original AFQT percentile score, and the first principle component from a factor analysis on all ASVAB tests. Some of these results are mentioned below; all are available from the authors upon request. 15. We drop the 1971 academic cohort since it cannot be fully observed.
16. Similar test results are obtained when we include fixed effects for birth date measured in months instead of quarters. (See Table 3 of Cascio and Lewis 2005.)
17. The ultrasound was not used to examine fetuses until the late 1950s. Even in more recent data, less than half of expectant mothers reporting having an ultrasound (Dahl and Moretti 2004).
Similarly, the 1970 Census, though not the 1980 Census, provides corroborating evi-dence of a significant relationship between academic cohort and migration observed for Hispanics in the NLSY 79.
would have entered school between 1968 and 1970 (as in our NLSY sample) and who were born in states with September 30, October 1, December 31, or January 1 cutoff dates (see Appendix 1). We thus limit the sample to a group of states for which we are able to define academic cohort precisely using quarter of birth and age on the census date.
Table 1
Summary Statistics for the NLSY 79 Sample
Black Hispanic Whitea Variable (Standard deviation Mean Mean Mean in parentheses) F-Statistic F-Statistic F-Statistic
Age as of July 1, 1980 17.14 17.11 17.14
(0.88) (0.87) (0.86)
Schooling and AFQT Measures:
Highest grade, summer 1980 10.47 22.1** 10.31 4.5* 10.70 12.1**
(1.17) (1.26) (1.10)
Enrolled in school, 1979–80 0.91 0.0 0.87 0.0 0.92 0.7 AFQT score (percentile) 20.50 3.3+ 30.19 0.3 49.42 0.1
(18.81) (23.96) (26.85) AFQT score (standardized) −1.14 2.7 −0.74 0.3 −0.04 0.6
(0.81) (0.92) (0.92)
Background measures
Dad’s highest grade 10.57 0.4 9.61 2.1 12.34 1.7
completed (2.91) (3.91) (3.08)
Mom’s highest grade 11.04 0.5 8.95 0.4 12.04 5.9*
completed (2.44) (3.76) (2.26)
Number of children in family 4.42 0.1 4.15 2.8 2.91 1.0
(2.92) (2.91) (1.85)
Female 0.50 0.2 0.50 0.7 0.49 5.7*
Migrated from state of birth 0.18 1.2 0.20 6.5** 0.22 0.0 School-entry variables
1st quarter cutoff 0.13 0.11 0.11
3rd quarter cutoff 0.21 0.37 0.24
4th quarter cutoff 0.64 0.64 0.66
N 128 547 125
Notes: See text and Appendix Table A2 for description of sample. F-statistics test the significance of aca-demic cohort in a regression also including fixed effects for state of birth and for year of birth by quarter of birth. All calculations are weighted by NLSY sampling weights, and regression standard errors are clustered on state.+, *, and ** significant at 0.10, 0.05, and 0.01 levels, respectively.
Table 2
Characteristics of the 1968–70 Academic Cohorts in the 1970 and 1980 Decennial Censuses
Black Hispanic Whitea
Variable (Standard deviations Mean Mean Mean in parentheses) F-Statistics F-Statistics F-Statistics
Characteristics in 1970
Age as of April 1970 6.43 6.28 6.41
(0.97) (0.92) (0.95)
Schooling measures
Highest grade attended 1.29 63.7** 1.14 0.83 1.16 10.5**
(0.95) (0.88) (0.88)
Enrolled 0.83 9.1** 0.84 13.9** 0.87 7.8* Background measures
Mom’s highest grade 9.59 0.0 9.62 2.3 11.40 1.1
(3.07) (3.50) (2.52)
Mom’s children 5.10 0.6 4.34 1.0 3.51 3.1+
ever born (2.89) (2.38) (1.89)
Migrated from state 0.13 0.4 0.21 5.0* 0.19 0.0 of birth
Female 0.50 0.0 0.50 0.7 0.49 0.0
N 6,639 1,095 24,153
Characteristics in 1980
Age as of April 1980 16.35 16.36 16.38
(1.02) (1.01) (1.01)
Schooling Measures
Highest grade 9.45 48.9** 9.50 0.7 9.68 15.0**
completed (1.33) (1.32) (1.18)
Highest grade 10.38 47.7** 10.41 0.5 10.62 16.5**
attended (1.31) (1.33) (1.18)
Enrolled 0.87 4.0+ 0.84 0.3 0.88 0.1
(0.33) (0.37) (0.32)
Background Measures
Migrated from 0.20 0.6 0.23 0.4 0.25 0.1 State of
Birth
Female 0.51 1.0 0.49 23.0** 0.49 0.1
N 32,257 6,138 119,729
Notes: Data are from the 1 percent 1970 Form 2 state file and the 5 percent 1980 state (A) file. See text for description of the samples. F-statistics test the significance of academic cohort in a regression also including fixed effects for state of birth and for year of birth by quarter of birth. Standard errors in the underlying regres-sion model are clustered on state of birth. +, *, and ** significant at 0.10, 0.05, and 0.01 levels, respectively.
Our finding that the instrument is in most cases uncorrelated with observable charac-teristics in multiple data sets is reassuring, as it suggests that the instrument also might be uncorrelated with unobservablecharacteristics. Table 2 provides additional support for the identification strategy. First, a strong relationship between academic cohort and highest grade completed appears in the 1980 Census in addition to the NLSY 79 sam-ple. Second, as discussed above, the mechanism that presumably links school-entry laws and schooling attainment in a school-aged population is deferred school entry. As shown in the upper panel of the table, significant differences in educational attainment and enrollment rates emerge when these cohorts are on average around six years old.
The second observation has implications for interpretation of our results. Relative to children with birthdays after cutoff dates, children with birthdays before cutoff dates both have more schooling andenter schooling earlier on average. They also tend to be relatively young within their academic cohorts. As a result, age at school entry and “relative age” also vary with our instrument, and our identification strategy cap-tures the reduced form effect of all three “treatments” on test scores. However, the existing literature, including several recent studies using variation associated with school-entry laws (Datar 2005; Bedard and Dhuey 2005), has generally found that being relatively young in one’s class and/or entering school at a younger age is asso-ciated with lower test scores.19Age at school entry and relative age therefore work
against finding relatively high test scores among teenagers with birthdays before cutoff dates. As a result, our TSLS estimates of the effect of schooling on AFQT performance are likely to be biased downward.20
V. Results
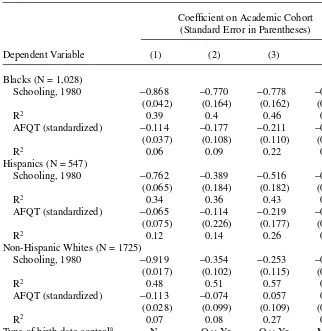
A. Regression ResultsTable 3 gives reduced-form coefficients on academic cohort from the restricted model of schooling (and its analog for AFQT scores), separately by race.21The specifications differ in which controls for birth date are employed and whether controls for family background (at age 14) and gender have been included in the model.22Table 4 presents
19. See, for example, Cahan and Davis (1987), Cahan and Cohon (1989), Varnhagen, Morrison, and Everall (1994), Bisanz, Morrison, and Dunn (1995), and Morrison, Griffith and Alberts (1995). (These citations are drawn from the subset of child-development studies attempting to separate age and schooling effects on test scores; see Bedard and Dhuey 2005 and Datar 2005 for a more thorough review of the literature.) As noted above, one problem with these studies in general is that samples consist of individuals who have already reached a particular grade. Because grade skipping and repetition and delay is more common among individuals with birthdays close to school-entry cutoff dates, making inferences about age effects using data on the oldest and youngest students in a particular class can be highly misleading. However, studies that use more sophisticated methods also find evidence of lower test scores among the relatively young. For exam-ple, Bedard and Dhuey (2005) use a sample defined on the basis of birth date, rather than on grade of enroll-ment, and find that relative age has an effect on test scores that lasts though at least age thirteen. 20. One might be concerned that relative age or age at school entry also biases toward zero the first stage coefficient on academic cohort, in which case our TSLS estimates might be too large. In this case, the reduced-form test score effect could be thought of as a lower bound on the effect of schooling on test per-formance.
21. All regressions are weighted by the NLSY 79 sampling weights designed for the AFQT-taking subsam-ple. Standard errors in all regressions are robust for clustering within state.
Table 3
Reduced-Form Estimates from the Just-Identified Model, by Race
Coefficient on Academic Cohort (Standard Error in Parentheses)
Dependent Variable (1) (2) (3) (4)
Blacks (N = 1,028)
Schooling, 1980 −0.868 −0.770 −0.778 −0.753 (0.042) (0.164) (0.162) (0.149)
R2 0.39 0.4 0.46 0.47
AFQT (standardized) −0.114 −0.177 −0.211 −0.268 (0.037) (0.108) (0.110) (0.143)
R2 0.06 0.09 0.22 0.24
Hispanics (N = 547)
Schooling, 1980 −0.762 −0.389 −0.516 −0.421 (0.065) (0.184) (0.182) (0.205)
R2 0.34 0.36 0.43 0.47
AFQT (standardized) −0.065 −0.114 −0.219 −0.147 (0.075) (0.226) (0.177) (0.096)
R2 0.12 0.14 0.26 0.31
Non-Hispanic Whites (N = 1725)
Schooling, 1980 −0.919 −0.354 −0.253 −0.210 (0.017) (0.102) (0.115) (0.140)
R2 0.48 0.51 0.57 0.58
AFQT (standardized) −0.113 −0.074 0.057 0.061 (0.028) (0.099) (0.109) (0.114)
R2 0.07 0.08 0.27 0.29
Type of birth-date controla N Q ×Yr Q ×Yr M ×Yr
Background controls N N Y Y
State-of-birth dummies Y Y Y Y
Notes: The dependent variable is either schooling completed as of the summer of 1980 or the revised AFQT score, standardized to have a mean of zero and a standard deviation of one. Background controls include mother’s highest grade completed, father’s highest grade completed, number of siblings as of age 14, and whether the respondent is female. Where background variables are missing, they have been imputed with subsample specific means. When background variables are included, we include a vector of dummies for imputed missing values. All regressions are weighted by NLSY sampling weights, and standard errors are clustered on state.
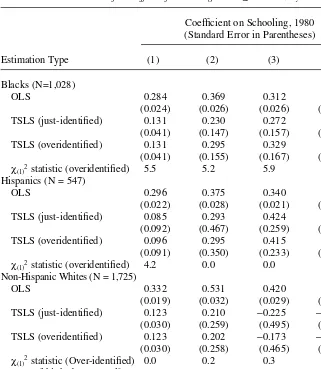
the TSLS estimates that correspond to these models and their overidentified counterparts (with first stage given in Equation 2). OLS estimates are presented in Table 4 for the purposes of comparison.
We begin with a simple specification, which includes state-of-birth fixed effects, but no controls for birth date or background. As shown in Column 1 of Table 3, the effect of school-entry laws on educational attainment is both strong statistically and large in magnitude, ranging between 0.76 and 0.92 fewer years of schooling com-pleted for every one-year increase in academic cohort, depending on race. Black and white teenagers in more recent academic cohorts also tend to have lower test scores. TSLS estimates are on the lower end of what has been found in past studies based on pooled samples, implying that an additional year of high school raises AFQT per-formance by 0.12 to 0.13 standard deviations. However, age or cohort may be con-founding these estimates, as no function of birth date has been included in the model. To account for this, the specification in Column 2 of Tables 3 and 4 controls for birth date with a series of fixed effects for birth date measured in quarters, as in Tables 1 and 2. As shown in Table 4, adding the birth-year—birth-quarter interactions to the model increases both OLS and TSLS estimates of the effect of schooling on test scores. The OLS estimates rise—for whites, by nearly 60 percent—likely because conditional on observed schooling at the test date, age is negatively related to test scores. However, the TSLS estimates rise by more (in percentage terms) for all sub-samples. In fact, even though TSLS estimates remain below their OLS counterparts in magnitude, the two sets of estimates cannot be statistically distinguished from one another. The TSLS estimates are quite noisy for the Hispanic and white subsamples, owing primarily to very weak reduced-form relationships between test scores and aca-demic cohort (see Column 2 of Table 3). On the other hand, for blacks the overiden-tified TSLS estimate is on the margin of significance, implying that a one-year increase in schooling raises test performance by 0.29 standard deviations.
The specification in Column 3 adds controls for family background and gender to this model. As expected from the lack of relationship between controls and the instru-ment docuinstru-mented in Table 1, the inclusion of these background controls has little impact on the results for blacks. TSLS estimates for blacks are a marginally signifi-cant 0.27 standard deviations in the just-identified model and a signifisignifi-cant 0.33 stan-dard deviations for an additional year of completed schooling in the overidentified specification. As in the second specification, the TSLS estimates are both close in magnitude to and cannot be statistically distinguished from OLS. For Hispanic teenagers, including background controls both increases the TSLS coefficient on schooling and lowers its standard error. The TSLS estimates imply that an additional year of schooling raises AFQT scores by a marginally significant 0.42 standard devi-ations. If anything, controlling for the migration of Hispanics appears to reinforce these findings. For example, when we restrict attention to nonmovers, TSLS coefficients on schooling for Hispanics are larger and statistically significant (0.572, with a robust standard error of 0.205).23
imputed with subsample specific means. We also control for indicators for whether background variables have been imputed.
Table 4
OLS and TSLS Estimates of the Effect of Schooling on AFQT Scores, by Race
Coefficient on Schooling, 1980 (Standard Error in Parentheses)
Estimation Type (1) (2) (3) (4)
Blacks (N=1,028)
OLS 0.284 0.369 0.312 0.310
(0.024) (0.026) (0.026) (0.026) TSLS (just-identified) 0.131 0.230 0.272 0.356
(0.041) (0.147) (0.157) (0.217) TSLS (overidentified) 0.131 0.295 0.329 0.391
(0.041) (0.155) (0.167) (0.224)
χ(1)2statistic (overidentified) 5.5 5.2 5.9 2.9 Hispanics (N = 547)
OLS 0.296 0.375 0.340 0.310
(0.022) (0.028) (0.021) (0.026) TSLS (just-identified) 0.085 0.293 0.424 0.349
(0.092) (0.467) (0.259) (0.229) TSLS (overidentified) 0.096 0.295 0.415 0.336
(0.091) (0.350) (0.233) (0.218)
χ(1)2statistic (overidentified) 4.2 0.0 0.0 0.0 Non-Hispanic Whites (N = 1,725)
OLS 0.332 0.531 0.420 0.416
(0.019) (0.032) (0.029) (0.031) TSLS (just-identified) 0.123 0.210 −0.225 −0.289
(0.030) (0.259) (0.495) (0.662) TSLS (overidentified) 0.123 0.202 −0.173 −0.147
(0.030) (0.258) (0.465) (0.565)
χ(1)2statistic (Over-identified) 0.0 0.2 0.3 0.5 Type of birth-date controla N Q ×Yr Q ×Yr M ×Yr
Background controls N N Y Y
State-of-birth dummies Y Y Y Y
For black and Hispanic teenagers alike, the finding of such large effects is not driven by the “inflation” of a small reduced-form test score coefficient by a small first-stage schooling coefficient. Table 3, Column 3 shows that both schooling and test score differences remain large among individuals with birthdays near school-entry cutoff dates, even once the direct effects of birth date and background are taken into account. For example, the reduced-form test score coefficient for blacks is a margin-ally significant −0.22 standard deviations. Moreover, the finding of such large gaps in completed schooling near the cutoff dates (0.78 years for blacks and 0.52 years for Hispanics) shows that the education of large fractions of black and Hispanic teenagers are in fact constrained by entry regulations. The local average treatment effect identi-fied by our strategy (Imbens and Angrist 1994) might therefore be representative of the average effect of schooling on test scores in the population at large.
Similar, albeit less precise, estimates are found for blacks and Hispanics when even more detailed controls for birth date—a series of fixed effects for birth date measured in months—are included in the model (Column 4 of Tables 3 and 4). For white teenagers, however, both this specification and the one in Column 3 are uninforma-tive. Controlling for background alone weakens the first stage for whites, and adding the birth-year -birth-month interactions makes it insignificant. Moreover, the reduced-form test score coefficients with background controls switch sign and are very impre-cise. These estimates generate large, negative, and very imprecise TSLS estimates, making it impossible to rule out large positive or large negative effects of schooling on test scores for white teenagers. However, it is not surprising that the research design is not informative for this subpopulation: As described above, the NSLY 79 appears to contain a rare (and unfortunate) draw of whites for the purposes of imple-menting our research design.24
In contrast to the uninformative results for whites, our TSLS estimates imply that an additional year of high school can raise the test performance of black teenagers by around 0.30 to 0.35 standard deviations and of Hispanic teenagers by between 0.35 and 0.4 standard deviations. Although some of these estimates are somewhat impre-cise, that we find similar results for the independent black and Hispanic samples is reassuring. Indeed, when we pool the black and Hispanic subsamples, we obtain more precise estimates of a similar magnitude. For example, the just-identified specification in Column 3 yields a TSLS schooling coefficient of 0.308 with a robust standard error of 0.137 in the pooled sample; the overidentified version on the same underlying model yields a TSLS schooling coefficient of 0.319 with a robust standard error of 0.140. When we consider different linear combinations of the ASVAB as dependent variables, we also find similar effects that are more precisely estimated.25
24. We have found no evidence that “ceiling effects” are biasing our results. Tobit estimates of the reduced-form test score model are quite similar to OLS. This may not be surprising, however, given that most respon-dents in our sample (even in the white subsample) score well below the maximum.
B. Does Season of Birth Belong in the Model?
One way this study improves upon previous work is that we do not require season of birth to be excluded from the model of test scores. But does this generalization make a difference? The answer appears to be “yes.”
The identifying assumptions employed in Neal and Johnson (1996) and Hansen, Heckman, and Mullen (2004) are not supported by the data. Adding the birth-year– birth-quarter interactions (moving from Column 1 to Column 2 of Table 3) signifi-cantly improves the explanatory power of The Reduced-form test score model for all subsamples. It is not the inclusion of year-of-birth dummies that drives this result: Regardless of race, we soundly reject the hypothesis that the quarter-of-birth inter-actions can be omitted from the model. It is possible to argue that the birth-quarter effects partly reflect residual correlation with schooling due to the assignment of some individuals to the wrong school-entry cutoff date (for example, due to migra-tion since birth). However, the reduced-form quarter-of-birth effect is present even for blacks, for whom the first-stage coefficient on Academic cohort remains large and highly significant even in the presence of the birth-quarter controls. Moreover, quarter of birth is not simply standing in for observable family background charac-teristics, because a similar series of statistics is obtained in Column 3, which also includes controls for family background.26These tests suggest that the true model is one where quarter of birth has a direct effect on test scores. Below, we investigate why this might be the case.
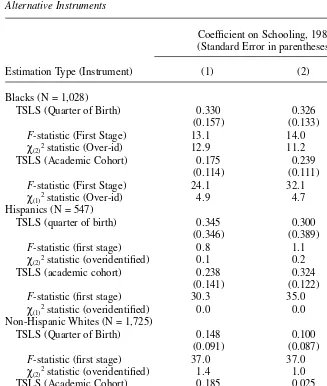
We have also compared TSLS estimates based on our approach to those based on the quarter-of-birth instrument. If quarter of birth belongs in the model of test scores, we might expect these estimates to diverge. Table 5 presents this comparison. All models control only for birth-year fixed effects, the control for age/cohort used in the existing literature. The first specification includes no controls for family background and therefore corresponds closely to that of Neal and Johnson (1996).27For blacks, TSLS estimates based on the quarter-of-birth instrument are statistically significant and similar in magnitude to those presented above. However, TSLS estimates based on academic cohort are about half the magnitude in the same specification. The overi-dentifying restrictions of the quarter-of-birth model are also soundly rejected for blacks.28For Hispanic teenagers, the quarter-of-birth based estimates are very impre-cise due to a weak first stage. Similar conclusions emerge when background variables
26. Table 6, Column 5 presents the p-value on the test of significance of the quarter-of-birth interactions in the model in Column 3 of Table 3. Similar results are obtained on the month of birth interactions for the spec-ification in Column 4 of Table 3 and for the quarter-of-birth interactions for the specspec-ification without back-ground controls (Column 2 of Table 3). Test statistics are available from the authors upon request. 27. Neal and Johnson (1996) do not appear to include controls for family background or state and do not report separate estimates by race. Using an NLSY 79 sample of respondents born 1962 to 1964, they report an effect of schooling on the AFQT of 0.22 standard deviations for men and of 0.25 standard deviations for women. For the quarter-of-birth specification in Column 1 of Table 5, but without state fixed effects, we esti-mate that an additional year of schooling raises test scores of males by 0.22 standard deviations and of females by 0.29 standard deviations when the sample is limited to respondents born after 1961 (n = 3,126). (Regressions include race fixed effects.)
28. Test statistics for the over-identification tests are calculated by multiplying the number of observa-tions by the R-squared from a regression of the TSLS residuals on the instruments and other observable char-acteristics. The test statistic is drawn from a χ2distribution with qdegrees of freedom, where qdenotes the
Table 5
TSLS Estimates of the Effect of Schooling on AFQT Scores: A Comparison of Alternative Instruments
Coefficient on Schooling, 1980 (Standard Error in parentheses)
Estimation Type (Instrument) (1) (2)
Blacks (N = 1,028)
TSLS (Quarter of Birth) 0.330 0.326 (0.157) (0.133) F-statistic (First Stage) 13.1 14.0
χ(2)2statistic (Over-id) 12.9 11.2
TSLS (Academic Cohort) 0.175 0.239
(0.114) (0.111) F-statistic (First Stage) 24.1 32.1
χ(1)2statistic (Over-id) 4.9 4.7 Hispanics (N = 547)
TSLS (quarter of birth) 0.345 0.300 (0.346) (0.389) F-statistic (first stage) 0.8 1.1
χ(2)2statistic (overidentified) 0.1 0.2
TSLS (academic cohort) 0.238 0.324
(0.141) (0.122) F-statistic (first stage) 30.3 35.0
χ(1)2statistic (overidentified) 0.0 0.0 Non-Hispanic Whites (N = 1,725)
TSLS (Quarter of Birth) 0.148 0.100 (0.091) (0.087) F-statistic (first stage) 37.0 37.0
χ(2)2statistic (overidentified) 1.4 1.0
TSLS (Academic Cohort) 0.185 0.025
(0.104) (0.144) F-statistic (First Stage) 27.2 21.0
χ2
(1)statistic (Over-id) 0.0 0.2
Background Controls N Y
are added to the model. Thus, controlling for detailed date of birth in a model of test scores might not only be appropriate, but also important for conclusions about how formal education contributes to skills.
C. Age or Cohort Effects?
Why might season of birth be an important determinant of skill acquisition? In Section II, we discussed two broad reasons that season of birth might matter—age (developmental maturation or the cumulative effects of learning experiences outside of school) and cohort (unobserved family background). While age and cohort effects are not separately identifiable, it is possible to learn something about their relative importance by testing a few restrictions on the birth-date parameters in the reduced-form test score model.
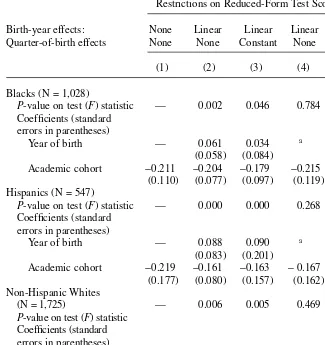
The first row of each panel in Table 6 presents p-values from several such tests.29 The underlying model is that in Column 3 of Table 3, which includes state-of-birth fixed effects, background controls, and fixed effects for birth date in quarters. The first column of the table presents the coefficient on academic cohort from this model for the purposes of comparison. We first test the hypothesis that the birth-date effects from this model lie along a line negatively sloped in birth date, but positively sloped in age (Column 2). The idea of this test is that aging should have a smooth, monoton-ically increasing effect on test scores. The data reject this hypothesis. This does not necessarily mean that age does notmatter; for example, age effects might be nonlin-ear (though still monotonic and smooth) or season of birth might matter in addition to age. However, in Column 3, we test an alternative set of restrictions where birth-quarter fixed effects are the same across birth years, but birth-year effects are linear, and this hypothesis is rejected as well. Though insignificant, the positive birth-year effects for blacks and Hispanics (shown in the second row of each panel) also seem inconsistent with the aging hypothesis, implying that aging has an implausible nega-tiveeffect on test scores.30While the data do not reject the restriction of linearity in birth year when quarter-of-birth interactions are permitted to vary (Column 4), the corresponding coefficients on birth year also tend to imply negative age effects.
These tests are necessarily suggestive, as birth-year (cohort) effects might be cancel-ing out reasonable age effects. However, it seems safe to conclude that if there are age effects for blacks and Hispanics, they are likely to be small. Given this, these estimates imply skill acquisition by adolescent minorities occurs primarily in schools. More gen-erally, Table 6 shows that the data reject the assumption of smooth, monotonic birth-date effects. The data point to common unobservables among narrowly defined cohorts: We even reject models where quarter-of-birth effects are constant across years and birth-year effects are unconstrained (Column 5). This suggests that it might be more difficult than previously thought to make inferences about age effects in cross-sectional test score data, even though this has been a common practice in the child-development literature.
Table 6
Tests for Age Effects on AFQT Scores
Restrictions on Reduced-Form Test Score Model
Birth-year effects: None Linear Linear Linear None Quarter-of-birth effects None None Constant None Constant
(1) (2) (3) (4) (5)
Blacks (N = 1,028)
P-value on test (F) statistic — 0.002 0.046 0.784 0.024 Coefficients (standard
errors in parentheses)
Year of birth — 0.061 0.034 a —
(0.058) (0.084)
Academic cohort −0.211 −0.204 −0.179 −0.215 −0.176 (0.110) (0.077) (0.097) (0.119) (0.110) Hispanics (N = 547)
P-value on test (F) statistic — 0.000 0.000 0.268 0.000 Coefficients (standard
errors in parentheses)
Year of birth — 0.088 0.090 a —
(0.083) (0.201)
Academic cohort −0.219 −0.161 −0.163 −0.167 −0.163 (0.177) (0.080) (0.157) (0.162) (0.148) Non-Hispanic Whites
(N = 1,725) — 0.006 0.005 0.469 0.016
P-value on test (F) statistic Coefficients (standard errors in parentheses)
Year of birth — −0.151 −0.227 a —
(0.062) (0.100)
Academic cohort 0.057 0.033 0.107 0.070 0.062 (0.109) (0.071) (0.104) (0.107) (0.113)
Notes: The baseline reduced form test score model is given in Column 3 of Table 3. As in Table 3, the under-lying model is weighted by NLSY sampling weights, and standard errors are clustered on state of birth. a. The restricted model includes four linear year-of-birth effects, one for each birth quarter. These are avail-able from the authors upon request.
VI. Discussion
We have improved on previous work by identifying the effect of education under less restrictive assumptions. We have estimated separate models by race, and even within race, the assumptions implicit in previous studies—that season of birth is either excludable from the model or matters only because of its relation to age—are rejected by the data. By contrast, the identifying assumption in our model—that birthday be randomly assigned within a narrow window of the school-entry cutoff date—receives support in both the NLSY 79 and the Census.
This research complements a large literature on school quality, which has tested whether variation in school resources matters for how students perform on standard-ized tests. Most of this literature has focused on interventions that affect only younger students, such as changes in class size, and on tests that have not been directly linked to labor market outcomes.31This is particularly the case for studies that are relatively convincing in their use of experimental variation in resources (Krueger and Whitmore 2002). By contrast, we have abstracted from the question of how school resources per se affect skill acquisition, focusing instead on the reduced-form impact of a year of successfully completed high school education on test performance. We have focused on the role of education for teenagers, and using the AFQT as a dependent variable, we have been able to examine whether schools play an important role in building skills demonstrated to predict adult earnings. We have found that schools might matter quite a bit, at least for minorities. How and why schools matter are ques-tions that we have not been able to address with our research design, though the rela-tively small variation in traditional school resource measures for these cohorts suggests that other aspects of schools might be worthy of investigation (Cook and Evans 2000). By the same token, it is quite possible that application of our research design to more recent cohorts might yield very different conclusions.
This caveat aside, what do our results imply about the importance of schools in racial and ethnic test score gaps? Given our uninformative results for whites, it is impossible for us to claim that schools can close such gaps. This also would be implausible because significant test score gaps emerge even before children enter school (Fryer and Levitt 2004). However, we can say that formal education has the capacity to raise the absoluteskills of racial and ethnic minorities, and in doing so, prevent test score gaps from widening further as children age. Taking our estimates as given, we calculate that raising the educational attainment of blacks and Hispanics to that of whites would cut the black-white test score gap by around 25 percent and the native Hispanic-white test score gap by more than half.32
These results compare favorably to those associated with earlier schooling ex-periences. For example, using a similar identification strategy, Gormley and Gayer (2005) find that a year of full-day public prekindergarten raises language and cognitive/knowledge test scores by 0.38 to 0.4 standard deviations. It is theoretically
31. For recent reviews of this literature, see Krueger (2003) and Hanushek (2003).
possible that such early test score gains propagate as children progress through school (Cunha et al. 2005), but even more intensive targeted early childhood interventions have not been conclusively demonstrated to have a lasting effect on test scores, or more specifically, on the types of skills that are measured by a test like the AFQT (for reviews, see Barnett 1995 and Currie 2001). Similarly, as shown in Krueger and Whitmore (2002), small class sizes have a larger impact on the black-white test score gap in the short run (reducing the gap by 38 percent) than in the long run (reducing the gap by 15 percent). Although we cannot definitively say that the same dollar spent later is more effective, our findings suggest that programs targeted toward teenagers do have the capacity to bestow valuable skills and should not be discounted.
Appendix 1
Coding of School-Entry Ages
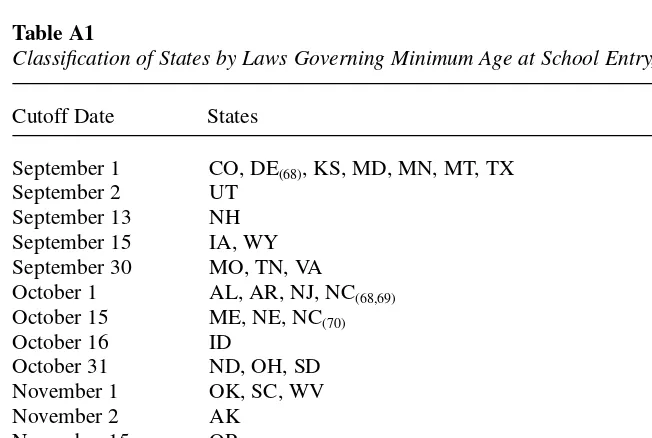
Implementation of our identification strategy required knowledge of exact school-entry cutoff dates facing several cohorts in the NLSY. These dates are given in Appendix Table A1. We derived dates listed from archival work based on the histo-ries of current age-at-school-entry statutes and our knowledge of the first grade entry ages in 1955, given in Angrist and Krueger (1992). If the statute’s history indicated a change in the language of the statute between 1955 and 1970, we investigated
Table A1
Classification of States by Laws Governing Minimum Age at School Entry, 1968–70
Cutoff Date States
September 1 CO, DE(68), KS, MD, MN, MT, TX September 2 UT
September 13 NH September 15 IA, WY September 30 MO, TN, VA October 1 AL, AR, NJ, NC(68,69) October 15 ME, NE, NC(70) October 16 ID
October 31 ND, OH, SD November 1 OK, SC, WV November 2 AK
November 15 OR
December 1 CA, IL, MI, NY December 31 KY, LA, HI, NV, RI, WI
January 1 AZ, CT, DE(69,70), FL, MS, NM, VT February 1 PA
Local discretion GA, IN, MA, WA
relevant state session laws to determine the date in effect over 1968 to 1970. Otherwise, the date recorded is that from 1955. Dates are consistent with those in the
Digest of Education Statisticsfor 1965 and 1972.
References
Angrist, Joshua D., and Alan B. Krueger. 1991. “Does Compulsory School Attendance Affect Schooling and Earnings?” Quarterly Journal of Economics106(4):979–1014.
———. 1992. “The Effect of Age at School Entry on Educational Attainment: An Application on Instrumental Variables with Moments from Two Samples.” Journal of the American Statistical Association87(418):328–36.
Baltes, Paul B., and Guenther Reinert. 1969. “Cohort Effects in Cognitive Development as Revealed by Cross-Sectional Sequences.” Developmental Psychology1(2):169–77. Bedard, Kelly, and Elizabeth Dhuey. 2005. “The Persistence of Early Maturity: International
Evidence of Long-Run Age Effects.” University of California, Santa Barbara. Unpublished. Barnett, W. Steven. 1995. “Long-Term Effects of Early Childhood Programs on Cognitive and
School Outcomes.” The Future of Children5(3):25–50.
Bentin, Shlomo, Ronen Hammer, and Sorel Cahan. 1991. “The Effects of Aging and First Grade Schooling on the Development of Phonological Awareness.” Psychological Science 2(4):271–74.
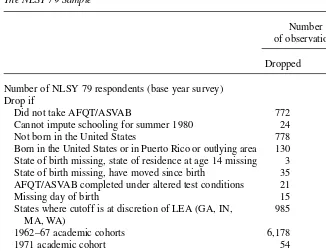
Table A2
The NLSY 79 Sample
Number of observations
Dropped Total
Number of NLSY 79 respondents (base year survey) 12,686 Drop if
Did not take AFQT/ASVAB 772 11,914
Cannot impute schooling for summer 1980 24 11,890
Not born in the United States 778 11,112
Born in the United States or in Puerto Rico or outlying area 130 10,982 State of birth missing, state of residence at age 14 missing 3 10,979 State of birth missing, have moved since birth 35 10,944 AFQT/ASVAB completed under altered test conditions 21 10,923
Missing day of birth 15 10,908
States where cutoff is at discretion of LEA (GA, IN, 985 9,923 MA, WA)
1962–67 academic cohorts 6,178 3,745
1971 academic cohort 54 3,691
Supplemental sample, white 391 3,300
Bisanz, Jeffrey, Frederick J. Morrison, and Maria Dunn. 1995. “Effects of Age and Schooling on the Acquisition of Elementary Quantitative Skills.” Developmental Psychology 31(2):221–36.
Bound, John, and David A. Jaeger. 2000. “Do Compulsory School Attendance Laws Alone Explain the Association Between Quarter of Birth and Earnings?” In Research in Labor Economics, Vol. 19, ed. Solomon Polachek, 83–108. Amsterdam: Elsevier.
Bound, John, David Jaeger, and Regina Baker. 1995. “Problems with Instrumental Variables Estimation when the Correlation Between and Instruments and the Endogenous
Explanatory Variable is Weak.” Journal of the American Statistical Association90(430): 443–50.
Cahan, Sorel, and Nora Cohon. 1989. “Age versus Schooling Effects on Intelligence Development.” Child-development60(5):1239–49.
Cahan, Sorel, and Daniel Davis. 1987. “A Between-Grade-Levels Approach to the
Investigation of the Absolute Effects of Schooling on Achievement.” American Educational Research Journal24(1):1–12.
Carneiro, Pedro, James J. Heckman, and Dimitriy V. Masterov. 2003. “Labor Market Discrimination and Racial Differences in Premarket Factors.” NBER Working Paper 10068. Cambridge, Mass.: National Bureau of Economic Research.
Cascio, Elizabeth U., and Ethan G. Lewis. “Schooling and the AFQT: Evidence from School Entry Laws.” NBER Working Paper 11113. Cambridge, Mass.: National Bureau of Economic Research.
Ceci, Stephen J. 1991. “How Much Does Schooling Influence General Intelligence and its Cognitive Components? A Reassessment of the Evidence.” Developmental Psychology 27(5):703–22.
Center for Human Resource Research. 2001. NLSY79 User’s Guide: A Guide to the 1979–2000 National Longitudinal Survey of Youth Data. Columbus: Ohio State University. Cook, Michael D., and William M. Evans. 2000. “Families or Schools? Explaining the
Convergence in White and Black Academic Performance.” Journal of Labor Economics 18(4):729–54.
Crone, Deanne A., and Grover J. Whitehurst. 1999. “Age and Schooling Effects on Emergent Literacy and Early Reading Skills.” Journal of Educational Psychology91(4):604–14. Cunha, Flavio, James J. Heckman, Lance Lochner, and Dimitriy V. Masterov. 2005.
“Interpreting the Evidence on Life Cycle Skill Formation.” IZA Discussion Paper 1675. Bonn: Institute for the Study of Labor.
Currie, Janet. 2001. “Early Childhood Education Programs.” Journal of Economic Perspectives15(2):213–38.
Dahl, Gordon, and Enrico Moretti. 2004. “The Demand for Sons: Evidence from Divorce, Fertility, and Shotgun Marriage.” NBER Working Paper 10281. Cambridge, Mass.: National Bureau of Economic Research.
Datar, Ashlesha. 2005. “Does Delaying Kindergarten Entrance Give Children a Head Start?” Economics of Education Review. Forthcoming.
Ferreira, Fernanda, and Frederick J. Morrison. 1994. “Children’s Metalinguistic Knowledge of Syntactic Constituents: Effects of Age and Schooling.” Developmental Psychology 30(5):663–78.
Fischer, Claude S., Michael Hout, Martin Sanchez Jankowski, Samuel R. Lucas, Ann Swidler, and Kim Voss. 1996. Inequality by Design: Cracking the Bell Curve Myth. Princeton: Princeton University Press.
Fryer, Roland G., and Steven D. Levitt. 2004. “Understanding the Black-White Test Score Gap in the First Two Years of School.” Review of Economics and Statistics86(2):447–64. Gormley, William T., and Ted Gayer. 2005. “Promoting School Readiness in Oklahoma: An
Hansen, Karsten, James J. Heckman, and Kathleen J. Mullen. 2004. “The Effect of Schooling and Ability on Achievement Test Scores.” Journal of Econometrics121(1–2):39–98. Hanushek, Eric A. 2003. “The Failure of Input-Based Schooling Policies.” Economic Journal
113 (February): F64–F98.
Herrnstein, Richard, and Charles Murray. 1994. The Bell Curve: Intelligence and Class Structure in American Life. New York: Simon and Schuster.
Imbens, Guido, and Joshua Angrist. 1994. “Identification and Estimation of Local Average Treatment Effects.” Econometrica62(2):467–75.
Jencks, Christopher, and Meredith Phillips. 1998. “The Black-White Test Score Gap: An Introduction.” In The Black-White Test Score Gap, ed. Christopher Jencks and Meredith Phillips, 1–51. Washington, D.C.: The Brookings Institution.
Krueger, Alan B., and Diane M. Whitmore. 2002. “Would Smaller Classes Help Close the Black-White Achievement Gap?” In Bridging the Achievement Gap, ed. John E. Chubb and Tom Loveless, 11–46. Washington, D.C.: The Brookings Institution.
Krueger, Alan B. 2003. “Economic Considerations and Class Size.” The Economic Journal 113(February): F34–F63.
Morrison, Frederick, Lisa Smith, and Maureen Dow-Ehrensberger. 1995. “Education and Cognitive Development: A Natural Experiment.” Developmental Psychology31(5):789–99. Morrison, Frederick J., Elizabeth M. Griffith, and Denise Alberts. 1997. “Nature-Nurture in
the Classroom: Entrance Age, School Readiness, and Learning in Children.” Developmental Psychology33(2):254–63.
Neal, Derek. 2005. “Why Has Black-White Skill Convergence Stopped?” University of Chicago. Unpublished.
Neal, Derek, and William R. Johnson. 1996. “The Role of Premarket Factors in Black-White Wage Differences.” Journal of Political Economy104(5):869–95.
NLS User Services. 1992. NLSY79 Profiles of American Youth: Addendum to Attachment 106. Columbus: Ohio State University.
O’Neill, June. 1990. “The Role of Human Capital in Earnings Differences Between Black and White Men.” The Journal of Economic Perspectives4(4):25–45.
Phillips, Meredith, Jeanne Brooks-Gunn, Greg J. Duncan, and Pamela K. Klebanov. 1998. “Family Background, Parenting Practices, and the Black-White Test Score Gap.” In The Black-White Test Score Gap, ed. Christopher Jencks and Meredith Phillips, 103–145. Washington, D.C.: The Brookings Institution.
Todd, Petra E., and Kenneth I. Wolpin. 2003. “On the Specification and Estimation of the Production Function for Cognitive Achievement.” The Economic Journal113(February): F3–F33.
———. 2004. “The Production of Cognitive Achievement in Children: Home, School and Racial Test Score Gaps.” University of Pennsylvania. Unpublished.
Varnhagen, Connie K., Frederick J. Morrison, and Robin Everall. 1994. “Age and Schooling Effects in Story Recall and Story Production.” Developmental Psychology30(6):969–79. Winship, Christopher, and Sanders Korenman. 1997. “Does Staying in School Make You