Full Terms & Conditions of access and use can be found at
http://www.tandfonline.com/action/journalInformation?journalCode=cbie20
Bulletin of Indonesian Economic Studies
ISSN: 0007-4918 (Print) 1472-7234 (Online) Journal homepage: http://www.tandfonline.com/loi/cbie20
Survey of recent developments
Daniel Suryadarma & Sudarno Sumarto
To cite this article: Daniel Suryadarma & Sudarno Sumarto (2011) Survey of recent developments, Bulletin of Indonesian Economic Studies, 47:2, 155-181, DOI: 10.1080/00074918.2011.585945
To link to this article: http://dx.doi.org/10.1080/00074918.2011.585945
Published online: 25 Jul 2011.
Submit your article to this journal
Article views: 388
View related articles
ISSN 0007-4918 print/ISSN 1472-7234 online/11/020155-27 © 2011 Indonesia Project ANU DOI: 10.1080/00074918.2011.585945
* [email protected]; [email protected].
SURVEY OF RECENT DEVELOPMENTS
Daniel Suryadarma* Sudarno Sumarto*
Australian National University SMERU Research Institute, Jakarta
SUMMARY
Considerable media criticism has been directed recently at parliamentarians’ enthusiasm for costly overseas ‘working visits’ with little obvious beneit to the nation, and at their plans for a new parliamentary building. The criticism may not be fully justiied, especially in relation to the latter, but is symptomatic of a high level of cynicism towards the parlia-ment. Many of its members have been embroiled in corruption, and it is performing poorly in terms of the number of bills passed. Indonesia experienced two bomb explosions in the period covered here, while at least eight other bombs were defused. In contrast with pre-vious patterns, the recent bombings are the work of small, mainly localised groups with only tenuous links to established terrorist organisations. This suggests that terrorism will remain a problem for many years.
Economic growth remains quite healthy, albeit not as strong as had been indicated by the data for the December quarter of 2010. Of greater concern is disequilibrium in the bal-ance of payments, manifested in rapid accumulation of reserves. The current account is strong, and capital inlow is soaring in response to relatively high domestic interest rates, now combined with signiicant appreciation of the rupiah and the unlikelihood of any depreciation in the near future. The consequence is a rapidly increasing cost to Bank Indo-nesia (BI), because losses resulting from the negative interest margin between its assets and liabilities are now being exacerbated by the declining value of its foreign assets. On current trends the central bank’s capital will be quickly exhausted. There is renewed concern about the fuel subsidy as world oil prices continue to rise, pushing the budget further into deicit and wasting vast sums that could be used for vital investments in infrastructure, education and health. Given that it is not possible to avoid these opportunity costs except by tak-ing the politically dificult decision to raise petrol prices, the government has postponed indeinitely any action to reduce the subsidy.
POLITICAL DEVELOPMENTS1 Criticism of the national parliament
The previous survey highlighted the waning of support for President Susilo Bam-bang Yudhoyono (SBY) in response to a widening gap between the government’s words and actions (McLeod 2011: 8–11). More recently the focus of public dis-content has shifted to the national parliament (Dewan Perwakilan Rakyat,DPR), consistently considered one of Indonesia’s most corrupt institutions (DPR 2010: 27). There has been much discussion of the DPR’s low productivity in terms of bills passed, both in an absolute sense and relative to its own targets.2
The parliament has been embroiled in two major controversies in recent months. The irst relates to the plan to construct a large and expensive new ofice build -ing for itself. The original design involved a 37-loor build-ing, but after sustained public criticism the projected cost was revised down, irst by a third and then by another third (Jakarta Post, 13/5/2011). This required drastic changes to the design, which now includes only 26 loors (Jakarta Post, 9/5/2011). The second controversy concerns DPR members’ business trips abroad, typically referred to as ‘working visits’. There is little evidence that these provide any signiicant beneit to the Indo -nesian public; the beneits are seen as lowing overwhelmingly to the members in the form of travel allowances and opportunities to visit famous tourist spots.
The strong popular and media interest in these issues is perhaps somewhat misplaced. A well functioning parliament comprises not only the elected mem-bers but numerous support staff, all of whom need to be adequately accommo-dated. The present parliament buildings are too small and, as the DPR strives to become a more effective institution – partly by way of increased stafing – the accommodation shortage will become more acute. The concern about parliamen-tary overseas visits seems out of proportion to the relatively minor costs involved in this kind of abuse of the public purse (though this is not intended to excuse such behaviour). The heated criticism these issues have generated appears to be symptomatic of a high level of public cynicism about DPR members in general. Several members have been found guilty of corruption, and there is a widespread perception that many more often receive monetary beneits in return for favours (Jakarta Post, 9/8/2010). The long-running saga of the distribution of private pay-ments to members in relation to the 2004 appointment of a senior deputy gover-nor to the central bank is a case in point (Jakarta Globe, 31/1/2011). The real issues are the DPR’s lack of productivity and the evident focus of many of its members on enriching themselves and their parties at the expense of the general public.
The latter concern has been reinforced by recent scandals, the most dramatic involving DPR member Muhammad Nazaruddin, the treasurer of the presi-dent’s Democratic Party (Partai Demokrat, PD) (Gatra, 1/6/2011: 12–20; Tempo, 29/5/2011: 26–30). In early May, investigations by the Corruption Eradication Commission led to allegations that Nazaruddin was involved in a corrupt effort to secure the contract to construct the athletes’ dormitories for the November 2011 Southeast Asian Games in Palembang, Sumatra. This was followed by revelations that Nazaruddin had attempted to give nearly $100,000 to the secretary-general of the Constitutional Court late last year. Nazaruddin denied the allegations but
PD nonetheless dismissed him as treasurer. He led to Singapore a day before a ban was imposed on his leaving the country. Nazaruddin has reportedly warned senior PD igures that he will expose malfeasance by their colleagues, includ -ing Edhie Baskoro, the president’s son and the party’s secretary-general. The Nazaruddin scandal has exposed deep rifts in the party, particularly between the faction of chairman Anas Urbaningrum on the one hand and supporters of SBY and of Anas’s rival, the Minister for Youth and Sport, Andi Mallarangeng, on the other. If Nazaruddin does produce evidence of serious misdeeds by senior PD igures, the popularity of the party and SBY could be heavily undermined.
Terrorism and ‘brainwashing’
Indonesia was unsettled by a number of terrorist incidents between March and May 2011. The irst was the explosion of a bomb planted in a book sent to a liberal Islamic movement leader, Ulil Abshar-Abdalla, in mid-March. The explosion did not injure Ulil, but severely wounded a police oficer who attempted to defuse the bomb; ive others were also injured. Similar bombs were also sent to the national anti-drug agency chief, Gories Mere, the leader of the Patriot Party, Yapto Suryo-sumarno, and a musician, Ahmad Dhani. The police bomb squad detonated all these bombs safely. A suicide bomber set off a larger bomb on 15 April during Friday prayers at a mosque located inside the police headquarters in Cirebon, to the east of Jakarta.In a third incident, ive bombs were placed near a natural gas installation adjacent to a church in Serpong, Tangerang, just west of Jakarta. The bombs were found on 21 April, immediately before Easter.
Police investigations found that both the book bombings and the attempted Ser-pong bombing had been master-minded by one Pepi Fernando, who had taught himself to make bombs using information obtained from the internet and from books, and had contacted several television stations to offer exclusive rights to ilm the bombings (Jakarta Post, 30/4/2011). Fernando was arrested in Aceh on the day the bombs in Serpong were found, and seven of his accomplices were arrested a few days later. The Cirebon bomb, by contrast, was organised by a group called Tauhid wal Jihad (Kompas, 15/5/2011), which is linked to a group in Solo then led by Sigit Qurdowi.3Tempo (20/4/2011) reported that the suicide bomber, Muham-mad Syarif, was an associate of Jama’ah Ansharut Tauhid (JAT), an organisation linked to terrorism (ICG 2011), though JAT has denied any association with Syarif. All these recent terrorist activities were carried out by groups about which the police had no previous knowledge. The International Crisis Group (ICG 2011) argues that these small, mainly localised groups complement the larger jihad-ist organisations, such as Jemaah Islamiyah and JAT. The larger groups support their smaller counterparts through outreach activities, including the translation of Arab extremist websites, so as to reach potential recruits. While the larger groups are currently focused on rebuilding their ranks after suffering many arrests by the police, the small groups are independently engaging in attacks. ICG asserts that there is as yet no information on the number of these small terrorist groups, and argues that prevention strategies beyond law enforcement are therefore critical to discouraging young people from joining them. Given that these groups are spreading almost organically, with only tenuous connection to the larger groups, it appears that terrorism will remain a problem for many years to come.
The Pepi Fernando case also helped to trigger media and public scrutiny of the underground Islamist movement Negara Islam Indonesia (NII), which has its origins in the long-standing Darul Islam organisation (Detik.com, 12/5/2011; Jakarta Globe, 2/5/2011; Kompas, 4/5/2011). Pepi had been a local leader of NII in the Bekasi region, but left the movement because its leaders opposed the immedi-ate resort to violent jihad. Attention to NII was heightened by news of a series of kidnappings and the ‘brainwashing’ of victims, allegedly undertaken by NII cad-res in various campuses across Java. This led to widespread condemnation of NII, and to calls by the president and senior ministers for resolute action to counter subversive and violent Islamic radicalism. Whether these calls are rendered into concrete policies remains to be seen.
MACROECONOMIC DEVELOPMENTS Growth
The unexpected surge in year-on-year GDP growth that occurred in the last quarter of 2010 has not been sustained, although growth recorded in Q1 2011 remained a little higher than the budget assumption of 6.3% (table 1a). Private consumption
TABLE 1a Components of GDP Growth (2000 prices; % year on year)
Dec-09 Mar-10 Jun-10 Sep-10 Dec-10 Mar-11
Gross domestic product (GDP) 5.4 5.6 6.1 5.8 6.9 6.5 By expenditure
Private consumption 4.0 3.9 5.0 5.2 4.4 4.5
Government consumption 18.0 –7.6 –7.3 4.8 7.3 3.0
Investment 4.1 8.0 8.0 9.2 8.7 7.3
Construction 8.1 7.3 7.2 6.8 6.7 5.3
Machinery & equipment –3.7 7.2 14.0 23.8 22.5 19.8
Transport –16.3 22.3 9.4 8.5 1.7 5.5
Exports 3.7 20.0 14.6 9.6 16.1 12.3
Imports 1.6 22.6 18.4 12.2 16.9 15.6
By sector
Tradables 4.4 3.5 4.0 3.3 4.7 4.5
Agriculture, livestock, forestry
& isheries 4.1 3.0 3.1 1.8 3.8 3.4
Mining & quarrying 5.3 3.1 3.9 2.7 4.2 4.6
Manufacturing 4.3 3.9 4.5 4.3 5.3 5.0
Non-tradables 6.2 7.6 8.1 8.2 8.8 8.3
Electricity, gas & water supply 14.9 8.8 5.1 3.4 4.3 4.2
Construction 8.1 7.3 7.2 6.8 6.7 5.3
Trade, hotels & restaurants 3.7 8.6 9.1 8.7 8.4 7.9
Transport 6.8 5.1 6.2 6.6 9.3 9.8
Communication 16.6 16.9 17.8 17.8 19.8 16.4
Financial, rental & business services 3.8 4.8 5.6 5.9 6.3 7.3
Services 5.8 4.7 5.3 6.4 7.5 7.0
accelerated very slightly, while government consumption growth continued to be highly volatile, falling signiicantly in the March quarter. Investment spend -ing growth has now declined for two successive quarters, although this category – especially the machinery and equipment component – is still providing a positive stimulus to growth overall. The contribution of net exports to growth has remained slightly negative, with imports growing faster (or falling more slowly) than exports. On the supply side, the growth of the non-tradables sectors continues to outstrip that of tradables by a factor of almost two. Manufacturing sector growth was a lit-tle higher in the last two quarters than in the preceding four although, as with total GDP, the relatively strong performance in Q4 2010 could not be sustained. Most of the non-tradables sectors continued to perform better than GDP as a whole.
The seasonally adjusted quarter-on-quarter growth rates present a somewhat less optimistic picture for the irst quarter of 2011 (table 1b). None of the demand (expenditure) categories, and only one of the supply (sector) categories (inancial, rental and business services) grew as fast as the year-on-year GDP igure for this quarter shown in table 1a. Moreover, nearly all the growth rates were lower in
TABLE 1b Components of GDP Growth
(2000 prices; seasonally adjusted;a % quarter on quarter, annualised rates)
Dec-09 Mar-10 Jun-10 Sep-10 Dec-10 Mar-11
By expenditure
Private consumption 4.3 5.0 5.7 4.8 2.8 4.8
Government consumption 13.4 –17.2 –0.4 22.1 12.4 –9.3
Not seasonally adjusted 232.3 –90.5 135.6 61.6 265.0 –91.9
Investment
Construction 6.8 7.5 6.2 5.6 6.7 5.0
Machinery & equipment 27.1 10.8 18.7 45.5 17.2 –0.4
Transport –8.4 36.2 –7.8 24.7 –13.8 4.7
Exports 28.5 –14.5 11.2 18.3 61.7 –25.3
Imports 22.3 –9.0 24.8 14.0 44.4 –13.0
By sector Tradables
Agriculture, livestock, forestry
& isheries 1.9 2.7 3.4 2.2 4.0 3.0
Mining & quarrying 1.6 1.6 6.6 3.3 3.1 –0.8
Manufacturing 3.1 3.0 6.9 4.1 7.0 2.0
Non-tradables
Electricity, gas & water supply 6.3 0.7 4.8 2.4 8.4 1.5
Construction 7.4 7.3 6.2 6.1 6.0 4.8
Trade, hotels & restaurants 12.3 6.6 9.3 6.9 10.8 4.6
Transport 2.6 3.3 12.9 8.0 13.0 5.5
Communication 7.9 18.1 24.1 21.6 15.6 5.3
Financial, rental & business services 4.3 5.8 7.4 6.2 5.8 9.9
Services 4.4 5.4 8.1 7.4 8.5 4.6
a Quarter-on-quarter growth is typically distorted by seasonal factors. The data in table 1b have been seasonally adjusted so as to remove these distortions.
Q1 2011 than in the previous quarter – in many cases by large margins. A severe decline in seasonally adjusted exports, combined with a much smaller decline in seasonally adjusted imports, contributed to the slowdown in growth overall.
Monetary and exchange rate policy
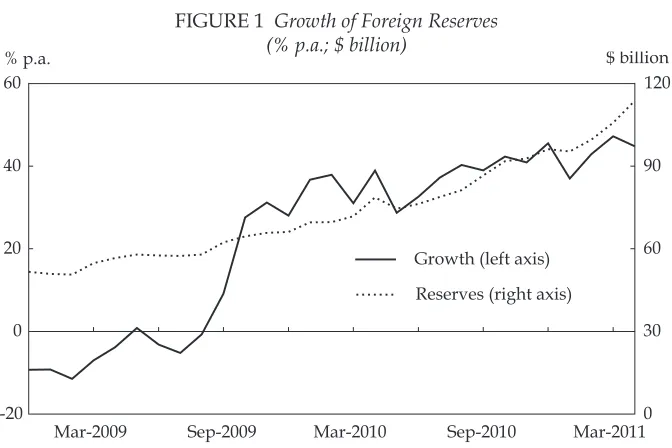
Indonesia is now in a condition of fundamental balance of payments disequilib-rium. After recovering quickly from the impact of the global inancial crisis, dur -ing which speculative capital outlow caused a minor reduction in international reserves, the economy has seen a quick restoration of capital inlow. Together with a strong contribution from net exports, this has resulted in a large and continuing payments surplus, and consequent growth of reserves at a rapid and accelerating rate (igure 1). Year-on-year reserves growth jumped from a slightly negative rate in August 2009 to nearly 28% p.a. two months later, accelerating to about 45% p.a. by April 2011. As a consequence, reserves more than doubled between the end of 2008 and April this year, from $52 billion to $114 billion.
It is not dificult to understand the reasons for the high capital inlow. At the end of 2010, an international investor could have sold its holdings of six-month US Treasury securities (yielding 0.19% p.a. at the time), converted the proceeds at an exchange rate of Rp 9,017/$ and used them to purchase six-month certiicates of deposit issued by BI (SBIs) yielding 6.08%. By the end of May 2011 the exchange rate had appreciated to Rp 8,498/$, so the gain on this investment by that time would have been 13.3%4 – equivalent to an annualised rate of return of 35%. Of course there is an exchange rate risk in undertaking such transactions, but with Indonesia’s reserves so high, this risk is perceived to be very small. Moreover, the continued rapid growth of reserves means that the perceived risk becomes smaller over time, so it is hardly surprising that reserves are growing at an accelerating rate.
4 The 5-month return is given by r = 1.0608 x 9,017/8,498 – 1 = 0.133, or 13.3%.
Mar-2009 Sep-2009 Mar-2010 Sep-2010 Mar-2011
-20 0 20 40 60
0 30 60 90 120
Growth (left axis)
Reserves (right axis)
% p.a. $ billion
FIGURE 1 Growth of Foreign Reserves (% p.a.; $ billion)
This strong capital inlow comes at considerable cost to BI (McLeod 2011: 14–5). At the margin, BI has recently been paying 6.08% to inance its investment in reserves yielding only 0.19%. On large-volume purchases, the implied losses are huge and unsustainable. Presumably for this reason BI has begun to modify its exchange rate policy. It has allowed the rupiah to appreciate signiicantly during the last several months, purchasing fewer dollars than would have been necessary to hold the exchange rate at the previously preferred level of about Rp 9,000/$. However, appreciation itself contributes heavily to international investors’ gains, encouraging them to purchase more SBIs, so the actual level of foreign exchange purchases by BI has continued to expand. In an effort to curb ‘hot money’ lows, BI implemented a six-month holding period for private sector investments in SBIs from 13 May 2011 (Surat Edaran BI [Bank Indonesia Circular] No. 13/13/DPM). But since investors will be more than happy to hold SBIs for six months, this pol-icy is unlikely to have any noticeable impact. Recent movements in the exchange rate are shown in igure 2, along with those on the Indonesia Stock Exchange. The large increase in share prices since the end of January 2011 is another clear indica-tion of investors’ appetite for Indonesian assets.
Most commentators are accustomed to thinking of chronic balance of payments deicits as being unsustainable; by contrast, they tend to congratulate countries that experience ongoing surpluses. In fact, both circumstances represent disequi-librium in the foreign exchange market, which will need to be resolved at some time in the future. In the present case, not only is BI losing heavily on the negative spread between its assets and its liabilities, but appreciation of the rupiah further accelerates the dissipation of its capital, because the value of its dollar assets is declining signiicantly in rupiah terms. BI’s capital at the end of 2010 was Rp 81 trillion, and it held the equivalent of Rp 867 trillion in foreign exchange reserves. With appreciation, the value of this initial stock of reserves fell over the next ive months to Rp 817 trillion. This Rp 50 trillion loss is equivalent to about 62% of the
10-Jun-2010 9-Aug-2010 6-Oct-20100 3-Dec-2010 2-Feb-2011 1-Apr-2011 1-Jun-2011
1,000 2,000 3,000 4,000 5,000
0 2,500 5,000 7,500 10,000 12,500
CSPI Rp/$
10-Jun-10 9-Aug-10 6-Oct-10 3-Dec-10 2-Feb-11 1-Apr-11 1-Jun-11 CSPI
Exchange rate
FIGURE 2 Composite Stock Price Index (CSPI) and Exchange Rate
starting value of capital. Sophisticated investors will realise that continuation of this surplus is therefore unsustainable. Moreover, its resolution is highly likely to involve further appreciation of the currency, which raises the prospective gain from investing in Indonesian assets, encouraging speculative capital inlow. Fur -ther signiicant appreciation seems inevitable, -therefore, making it highly likely that the government will need to recapitalise BI in the near future.
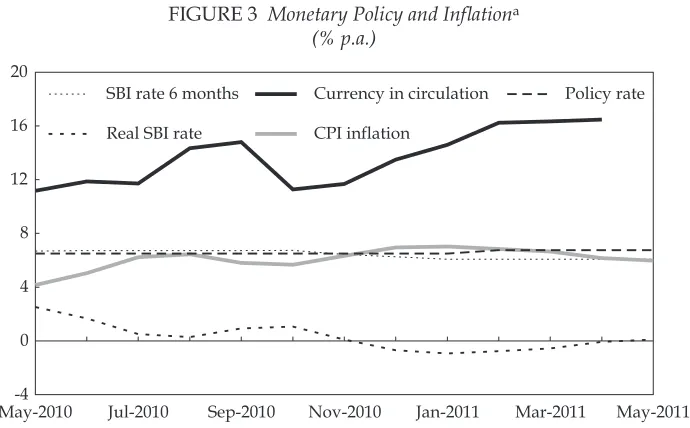
The recent appreciation of the currency has helped to lower inlation by reduc -ing the prices of tradable products consumed by households; offsett-ing this, however, foreign exchange purchases continue to generate rapid growth of BI’s monetary liabilities (base money), causing non-tradables prices to increase. The net effect has been for inlation overall to decline slowly from a peak of 7.0% p.a. at the end of 2010 to 6.0% – right at the upper limit of the current target band – by May 2011 (igure 3). BI has kept the interest rate on its main policy instrument, the six-month SBI, at 6.08% since January, resulting in a correspondingly slow increase of the real (inlation-adjusted) SBI rate to just 0.1% in May. The so-called ‘policy rate’ was described in a previous survey (Kuncoro, Widodo and McLeod 2009: 161) as ‘ictional’, because it does not apply to any security in the market. It has demonstrated this characteristic once again by moving in the opposite direc-tion to the nominal six-month SBI rate, allowing the central bank to maintain the illusion that it has been tightening monetary policy when in fact it has been loos-ening it – as is evident in the steady acceleration in the growth of currency in circulation since late 2010. By May 2011 the policy rate exceeded the six-month SBI rate by 0.67%, whereas it had been 0.23% lower as recently as October 2010.
May-2010 Jul-2010 Sep-2010 Nov-2010 Jan-2011 Mar-2011 May-2011 -4
0 4 8 12 16 20
SBI rate 6 months
Real SBI rate
Currency in circulation
CPI inflation
Policy rate FIGURE 3 Monetary Policy and Inlationa
(% p.a.)
a Currency in circulation is used as the indicator of money supply in preference to base money because of the distorting impact of occasional changes in banks’ minimum reserve requirements on the effective supply of base money; currency is the major component (about 75%) of base money. The growth rate shown has been smoothed based on the 2-month moving average values to clarify the underlying trend. The real SBI (Bank Indonesia Certiicate) rate is approximated by the nominal rate less the contemporaneous CPI (consumer price index) inlation rate.
International oil prices and the fuel subsidy controversy
After bottoming out at $39/barrel in February 2009, the international oil price has increased almost continuously (igure 4).5 There is renewed concern about the waste of resources and the regressive impact on income distribution implicit in Indonesia’s fuel price policy – pegging domestic prices and providing subsidies to cover the difference between them and equivalent international prices (see, for example, Kong and Ramayandi 2008).6
The largest proportion of the fuel subsidy goes to Premium gasoline, by far the most popular automotive fuel product. The government has changed the price of Premium six times since January 2005, with three increases and three consecu-tive monthly reductions (igure 4). The third increase came in mid-2008 when the price was raised by one-third, in belated response to the drastic increase in world oil prices that began in January 2007 and peaked at $134 in June 2008. Shortly thereafter, as the global inancial crisis took hold, the world price began to decline even more rapidly than it had risen. While extremely reluctant to raise the price of Premium when the world price was rising, the government was quick to lower it when world prices fell, reducing it by Rp 500/litre for three months in succes-sion between December 2008 and February 2009. President Yudhoyono heavily
5 Unless otherwise stated, all international oil prices quoted in this survey refer to the West Texas Intermediate crude spot price per barrel, free on board.
6 The government subsidises the retail price of Premium gasoline, diesel fuel and kero-sene. Industry is not allowed to buy subsidised fuel, however.
Jan-20050 Jan-2006 Jan-2007 Jan-2008 Jan-2009 Jan-2010 Jan-2011 1,000
2,000 3,000 4,000 5,000 6,000 7,000
0 20 40 60 80 100 120 140
Premium (left axis) WTI a (right axis)
Rp/litre $/barrel
FIGURE 4 The International Oil Price and the Price of Premium in Indonesia (Rp/litre; $/barrel)
a WTI = West Texas Intermediate crude oil (see footnote 5).
emphasised this ‘achievement’ when seeking re-election in mid-2009. The price of Premium remained at the February 2009 level up to the time of writing.
The rise in international oil prices accelerated in late 2010 as countries recovered from the inancial crisis, with the price of West Texas Intermediate crude reach -ing $112 by May 2011. Although the prices of the non-subsidised higher-octane Pertamax and Pertamax Plus fuels have broadly followed this upward trend, that of the far more widely consumed – and therefore much more politically sensitive – Premium has remained at Rp 4,500/litre (igure 5). Assuming that international oil prices were to continue at around $100/barrel (as indicated by the Indonesian Crude Price, ICP, calculated each month by Pertamina), rather than at the $80 ICP assumed in the 2011 budget, the government would have to increase spending on the fuel subsidy by Rp 28 trillion (about $3.3 billion), and the budget deicit would rise by about Rp14 trillion ($1.6 billion) (Aswicahyono et al. 2011). The ICP stood at $113 in March 2011.
The recent surge in international oil prices has re-ignited debate about the fuel subsidy. Economists have long argued for its removal (Aswicahyono and Hill 2004; Sen and Steer 2005; Aswicahyono et al. 2011). At a world price of $100/barrel, this would cause the price of Premium to rise from Rp 4,500 to around Rp 7,950/litre (Aswicahyono et al. 2011). The main justiication for reducing or removing the fuel subsidy is that the funds could be spent more eficiently on new capital, such as infrastructure (Narjoko and Jotzo 2007), and that the subsidy is highly regressive, because a disproportionate share of it goes to the non-poor, who consume much more energy than the poor (Sen and Steer 2005). Indeed, experience (in 2008, when domestic prices were increased) has already demonstrated that reducing the fuel subsidy and re-allocating the budgetary savings to education and health programs
1-Oct-20100 15-Nov-2010 1-Jan-2011 15-Feb-2011 1-Apr-2011 1-May-2011 2,000
4,000 6,000 8,000 10,000 12,000
0 20 40 60 80 100 120
Pertamax Plus
Pertamax
Premium
WTI a (right axis)
Rp/litre $/barrel
FIGURE 5 The International Oil Price and Domestic Fuel Pricesa (Rp/litre, $/barrel)
a WTI = West Texas Intermediate crude oil (see footnote 5).
beneits low- and middle-income households (Coady et al. 2010). Perhaps for these reasons, a number of DPR members are now supporting economists’ calls for an increase in the price of Premium (Media Indonesia, 4/5/2011).
In November 2010 the government announced plans to limit consumption of subsidised fuel to motor cycles and public transport by January 2011. But the evi-dent implementation dificulties (McLeod 2011: 18) led it to ‘postpone’ the policy (initially until April 2011), and it now appears to have discarded the idea alto-gether. The major difference between the current debate and that in 2005 and 2008 is the government’s overwhelming reluctance to increase the price of Premium. Hatta Rajasa, the Coordinating Minister for Economic Affairs, has stated that the government has no fuel subsidy removal program that would result in a rise in fuel prices (Kompas, 11/5/2011); rather, it is interested only in regulating the distri-bution of subsidised fuel. This reluctance appears to be related to the president’s emphasis in the 2009 election campaign on his government’s having reduced fuel prices three times in a row. Presumably he wishes to avoid losing face now by increasing them again.
The fact that the fuel subsidy remains a highly important political issue is unfor-tunate, since populism is standing in the way of good policy. When the world oil price fell from $134 in June 2008 to $41 in December, the price of Premium was pegged at Rp 6,000/litre. If the government had avoided the temptation to buy popularity by reducing it then, it could have achieved a signiicant cut in the fuel subsidy. Moreover, if it had taken the golden opportunity, in this context of fall-ing world prices, to announce that the domestic price would automatically follow movements in the world oil price from then on, this step would have removed fuel pricing from the political arena.
The government asked experts from three of Indonesia’s top universities to conduct research on alternative policies to address the fuel subsidy problem.7 The research team eventually presented three options to the government and the parliament in February 2011 (Politik Indonesia, 7/3/2011). However, none of these options adequately addressed the fundamental issues of the opportunity cost and the regressive nature of the fuel subsidy, nor did they remove opportunities for arbitrage. Having weighed up the options presented, the government announced in mid-February that it had decided to postpone any policy adjustment indeinitely. Instead, the state oil company, Pertamina, was told to put up banners in its petrol stations encouraging motorists to stop using Premium. With the Pertamax price almost double that of Premium, it comes as no surprise that this ‘moral sua-sion’ policy is having little effect. Indeed, the widening price disparity between Premium and Pertamax is having the predictable result of Pertamax users switch-ing to Premium. Consumption of the latter reached two million kilolitres in April 2011, about 200,000 kilolitres higher than the monthly quota (Today, 4/5/2011).8 In addition, a black market has emerged in which domestic industries that are
7 Their report is not publicly available.
prohibited from using subsidised fuel are gaining access to it (Media Indonesia, 9/5/2011); there are also reports of subsidised fuel being smuggled to Malaysia and Singapore. The consequence is that billions of dollars of iscal resources con -tinue to be diverted from programs that could both stimulate development and redistribute income in favour of the poor.
POVERTY AND SOCIAL PROTECTION
With moderate economic growth over the last decade, Indonesia has made contin-ued gains in poverty reduction, with the poverty rate falling from a peak of 23.4% of the population in 1999 to 13.3% in 2010 (Suryahadi et al. 2011: 68). Non-income indi-cators such as infant mortality and school enrolment have also improved, yet much remains to be done (Manning and Sumarto 2011). Today 33 million Indonesians live below the national poverty line (equivalent to approximately $1.50 per day in purchasing power parity terms). Moreover, approximately half of all households are clustered around that line. These near-poor households are highly vulnerable to shocks, whether speciic to themselves (such as job loss, business bankruptcy, harvest failure, sickness or accidents) or more widespread (such as all too frequent natural disasters, global economic downturns, social conlicts and other calamities). The evidence for frequent movement into and out of poverty is compelling: 49% (20.2% + 28.8%)of the poor in 2009 were not poor in 2008, while 53% (20.3% + 33.0%) of those who were poor in 2008 had moved out of poverty by 2009 (table 2).
Indonesia is on track to meet several of its Millennium Development Goals by 2015 (achieving an increase in primary school enrolments and reductions in the incidence of communicable disease and child mortality). However, it will require a considerable effort to meet several others (reductions in child malnutrition and maternal mortality rates, and improved access to clean water and sanitation) and to accelerate poverty reduction and address vulnerability to shocks. Aware of these challenges, policy makers have introduced new social programs that provide
TABLE 2 Poverty Transition Matrix during 2008–09
Poverty status in 2009
Poor Near-poora Non-poor Total
Poverty status in 2008
Poor 46.7 20.3 33.0 100.0
51.0 26.8 6.5
Near-poora 22.3 21.5 56.2 100.0
20.2 23.6 9.2
Non-poor 5.4 7.7 87.0 100.0
28.8 49.7 84.3
Total 100.0 100.0 100.0
a The near-poor line is deined as 120% of the poverty line.
more comprehensive protection from economic risks, and encourage local com-munities to invest in physical and human capital. Below we place these initiatives in context, outlining the evolution of Indonesia’s social safety net policies since 1998, and discussing the role of institutional changes in poverty reduction efforts, such as the establishment in 2010 of the National Team for Accelerating Poverty Reduction (Tim Nasional Percepatan Penanggulangan Kemiskinan, TNP2K).
Efforts to reduce poverty and vulnerability and provide social protection After strong growth for three decades, Indonesia suffered enormously during the Asian inancial crisis. Poverty data produced on a consistent basis for the dura -tion of the crisis (Suryahadi, Sumarto and Pritchett 2003) show an increase in the poverty rate from 15% in mid-1997 to 33% by the end of 1998, implying that an additional 36 million people were pushed into absolute poverty.9 To mitigate the adverse social impact of the crisis, the government introduced social safety net (jaring pengamanan sosial, JPS) programs aimed at protecting the chronic poor from falling deeper into poverty, and at reducing vulnerable households’ exposure to risk. These programs covered education, health, community empowerment, employment, and rice subsidies. The scale of this initiative, which we refer to hereafter as the ‘irst generation’ of social protection policies, was unprecedented in Indonesian history.10
In the years after the crisis, the government maintained several of these JPS programs, while mounting a number of new ones. In addition to introducing a better targeted successor to the rice subsidy program known as Raskin (Beras Miskin, or Rice for the Poor), it made some attempt to reduce the regressive sub-sidy on fuel products and to channel the resulting budgetary savings into targeted social protection and poverty alleviation programs. Alongside dramatic (albeit short-lived) reductions in the fuel subsidy in March and October 2005, the govern-ment implegovern-mented a substantial package to compensate the poor for the impact on them of higher fuel prices. The package included health insurance, educational assistance and the world’s largest unconditional cash transfer (UCT) program. In 2007 a smaller-scale conditional cash transfer (CCT) program was launched, and in mid-2008 a second round of unconditional cash transfers was implemented after further fuel subsidy reductions. We refer to Raskin and the UCT and CCT programs originating in fuel subsidy compensation as the ‘second generation’ of social protection policies.
Since 2005, spending on social assistance has been rising, albeit slowly. Swelled by large UCT disbursements, total social assistance spending is esti-mated to have reached Rp 33.1 trillion (around $3.3 billion) in 2008, equivalent to 3.2% of government expenditure (World Bank 2011b). Government spending in this area has averaged around 0.5% of GDP in recent years; this remains low in relative terms: the 2008 average for developing countries is estimated at 1.5% of GDP (igure 6).
9 These igures differ greatly from oficial igures published by the central statistics agency (Badan Pusat Statistik, BPS), which generated poverty lines based on non-comparable con-sumption baskets across the crisis years.
In drawing lessons from the irst and second generation programs, policy makers today are striving to create a more eficient, equitable – and perma -nent – social protection system. The goal is not merely to provide risk-coping mechanisms for responding to economic shocks, but also to institute sustaina-ble programs that aim to help children escape the poverty of their parents. The government’s medium-term development plan (Rencana Pembangunan Jangka Menengah, RPJM) for 2010–14 focuses on the multi-dimensional and long-term nature of poverty alleviation, continuing the shift from universal subsidies to tar-geted social protection programs. Its goal is to reduce poverty from 14% in 2009 to 8% in 2014. Chief among the institutions leading this effort today is TNP2K. It has been given the responsibility of overseeing coordination of three clusters of poverty programs: household-based social assistance programs; community empowerment programs; and programs to expand economic opportunities for low-income households.
Under the leadership of TNP2K, the government hopes to continue moving towards a more sustainable, integrated and coherent social protection system. The framework upon which policy makers have settled – the three clusters just men-tioned – is intended to improve the social and economic well-being of poor and near-poor households. Cluster I constitutes the major social assistance programs, including Raskin, the UCT and CCT; a group of small but growing scholarship programs; and the national community health insurance program (Jaminan Kesehatan Masyarakat, Jamkesmas).11 This household-based cluster of programs
11 This program initially targeted poor households, and was known as ‘Health Insurance for the Poor’ (Asuransi Kesehatan Masyarakat Miskin, Askeskin). Perhaps because it was relatively ineffective, the program was later expanded in scope, as Jamkesmas, to target all households. This led to a signiicant diversion of resources away from the poor, the original target group.
OECD average Developing country average South Asia average India Latin America average Argentina Brazil Mexico East Asia & Pacific average Vietnam Philippines Indonesia
0.0 0.5 1.0 1.5 2.0 2.5 3.0
FIGURE 6 Public Expenditure on Social Safety Nets, 2008 (% of GDP)
forms the core of Indonesia’s social protection system. Cluster II consists primarily of the National Program for Community Empowerment (Program Nasional Pem-berdayaan Masyarakat, PNPM), which was formally established in 2008, building upon the successes of the World Bank’s Kecamatan (Sub-district) Development Program. PNPM covers approximately 70,000 villages, and is aimed at stimulat-ing pro-poor economic growth at the local level, while also strengthenstimulat-ing gov-ernance and institutions. Cluster III aims to expand the availability of credit to micro- and small-scale enterprises.
The work of TNP2K
Oversight and coordination of poverty and social protection programs, previously under the Coordinating Ministry of Social Welfare, have been relocated to TNP2K within the ofice of the vice president, under Presidential Regulation 15/2010. The coordinating ministry was considered ineffective in this role, and it is hoped that its elevation to the vice president’s ofice will make it more eficient. Vice Presi -dent Boediono chairs the team, which includes representatives of all government agencies responsible for the planning, inancing and implementation of poverty reduction programs. Among other things, the presidential regulation instructs the national planning agency, Bappenas, to handle the inancing of these programs. It also establishes an executive secretariat, responsible for drafting policies and programs; devising a national targeting system and setting targets; carrying out monitoring and evaluation; conducting analysis; and providing technical and administrative support for the team. The secretariat has also been responsible for establishing working groups that act as ‘internal think tanks’ overseeing particu-lar aspects of poverty reduction activities. TNP2K receives inancial support from the Australian Agency for International Development (AusAID), which will con-tinue for four years from 2011. It also receives technical support from the World Bank and the German International Cooperation Agency (GIZ).
The executive secretariat has identiied several key steps for achieving the pov -erty objectives of the RPJM. First, it will improve the targeting of household-centred Cluster I programs. Second, it will focus on enhancing the design and delivery of two programs: the community health insurance program (with the ambitious objective of extending coverage by 2014 to reach all poor families, a large propor-tion of whose members work in the informal sector); and a program that provides scholarships to poor students. Third, it will seek to improve and expand the CCT program (known as the Hopeful Families Program, Program Keluarga Harapan, PKH). Fourth, efforts will be made to consolidate all Cluster II programs within the community empowerment program, better known as PNPM–Mandiri. This program provides direct block grant inancing to local communities at the sub-district level to inance an ‘open menu’ of local development priorities – typically small-scale rural infrastructure. Fifth, the secretariat will improve the oversight and accountability aspects of poverty reduction programs through the creation of a monitoring and evaluation system. Sixth, it will use regional teams to coordinate poverty reduction at the provincial and local government levels.
Uniication of the national targeting system
This leads to duplication of effort, inconsistency in application, and dampened program impact. TNP2K’s Targeting Working Group, in collaboration with the central statistics agency (BPS) and with technical assistance from the World Bank, aims to improve the accuracy of social programs in reaching the poor, through the creation of a uniied database of poor households. This will include the names and addresses of the poorest 40% of the population, from which implementing agen-cies can draw lists of those eligible to beneit from particular social programs. A combination of 2010 census data and input from the poor community in the data collection process is expected to result in good coverage of the poorest members of the population; even those without a permanent residence will be registered.
This working group, in close association with Bappenas and BPS, has been actively engaged with line ministries in promoting the use of the uniied data -base system, data for which are to be collected by BPS in mid-July 2011 (Kompas, 24/5/2011). The database is expected to be available by January 2012. The Min-istry of Health has committed to having Jamkesmas use the database from 2012, while the Ministry of Social Welfare has agreed to use it from 2012 for expansion of the CCT program.
Improving implementation of the community health insurance system
The Working Group on Social Assistance for Poor Families’ Health aims to improve the implementation of the national health insurance program by mak-ing policy recommendations based on a comprehensive review of its current operations. The review is being conducted by a third party and examines the institutional structure of Jamkesmas; its membership; its beneit packages and premiums; and the performance of health-care providers. The working group’s activities over the past year included monitoring this review and holding discus-sions of the healthcare bill with the Social Security Management Agency (Badan Pengelola Jaminan Sosial) and eight ministries nominated by the president.
Extending and improving implementation of the CCT program
Unlike the UCT programs in 2005 and 2008, which were intended to assist a large number of poor and near-poor households during temporary periods of high inla -tion and declining real incomes, the CCT program begun in 2007 was designed to provide longer-term inancial support to a narrowly targeted group of very poor households. By 2010 the CCT program was operating in 20 of Indonesia’s 33 provinces, serving almost 800,000 households deemed chronically poor. The pro-gram speciically targets households that include pregnant or lactating women, or children aged 0–15 years, and its beneits schedule ranges from Rp 600,000 to Rp 2.2 million annually, depending on household structure. Receipt of beneits is conditional on visits to health clinics for a range of services intended to improve maternal and infant health, and on the enrolment and continued attendance at school of children aged 6–15.
support for the program over the medium to long term. The key goals of TNP2K with respect to the CCT program include building the capacity of the Ministry of Social Affairs to manage it; improving coordination between ministries and local governments; improving the process of verifying beneiciary compliance with conditions; and expediting payments.
Integration of other community empowerment programs into PNPM–Mandiri
Currently there are more than ive different types of community-driven develop -ment (CDD) programs, using similar approaches to PNPM–Mandiri, but imple-mented by different line ministries. To improve the coordination and impact of these programs, it is argued that they need to be integrated. A TNP2K working group has been set up to formulate a strategy for gradual integration of all com-munity development programs into PNPM–Mandiri, and for integrating PNPM– Mandiri into the regular planning systems of local governments. Thus far the working group has designed a draft proposal, addressing both PNPM–Mandiri integration and exit strategies, under which local governments take responsibility for implementation and inancing.12 The proposal has been discussed informally with stakeholders, and more formal discussions with PNPM–Mandiri decision makers are planned for the near future.
Creating a monitoring and evaluation system for social programs
A Monitoring and Evaluation (M&E) Working Group has been set up to develop an integrated M&E system for all poverty reduction programs. During the past several months it has undertaken an impact evaluation study of PNPM; a stock-take of M&E and management information systems that already exist in vari-ous programs; and an evaluation of poverty programs implemented since 1998. Future M&E activities planned include building an integrated management information system; determining targets and indicators to evaluate social pro-grams and inform the public about the results; undertaking program evaluations through the ‘rapid assessment’ approach; and conducting impact evaluations and budget reviews. This initiative is intended to inform policy makers about what works and what does not, and thus about how to improve existing programs and design future programs. It is expected that the beneits derived from these efforts will outweigh the costs.
Empowering regional teams for the coordination of poverty reduction
In an effort to improve coordination at sub-national levels, provincial and district/ municipality coordinating teams for poverty reduction (Tim Koordinasi Penang-gulangan Kemiskinan Daerah, TKPKDs) have been formed in compliance with Minister for Home Affairs Regulation 42/2010. The TKPKDs are responsible for coordinating poverty reduction efforts in their respective jurisdictions, and for controlling the implementation of poverty reduction policies in accordance with guidelines provided by the national team.
The goal of establishing TKPKDs in all local government jurisdictions will require considerable further effort, given that 210 of the 497 local governments have yet to set up a team. This suggests that many district heads and mayors do not consider poverty reduction a foremost priority in their development plans. To address this problem, and given that decentralisation has greatly reduced the authority of the central government over local governments, TNP2K has pro-duced a handbook, Panduan Penanggulangan Kemiskinan: Buku Pegangan Resmi TKPK Daerah (Guide to Poverty Reduction: Oficial Handbook for Regional TKPKs), to assist local leaders. It has also undertaken local visits and inspections to encourage greater emphasis on poverty reduction. In theory, regional govern-ments should have access to good information about their areas, ensuring that poverty alleviation strategies can be tailored to local conditions and needs. At the same time, the central government has an important role to play in facilitating regional government access to information on poverty, ensuring that national and local poverty strategies are well coordinated, and protecting against the risk that decentralisation will exacerbate inequality among regions. Political incentives may not always align with allocation of greater resources to the poorest areas, so the design of policies supporting decentralisation of public services needs to relect careful consideration of how to avoid such risks. The effort to establish TKPKDs throughout Indonesia should be seen in this light.
Prerequisites for sustainable poverty reduction
A strong social protection system can enhance the ability of the poor to partici-pate in, contribute to and beneit from Indonesia’s continued economic growth. By expanding access to education and health services, social protection programs can reinforce productivity and labour market participation among the poor, while also reducing their vulnerability to temporary and permanent shocks. However, the fate of the poor hinges on factors beyond the improved targeting, coordina-tion and condicoordina-tionality of such programs. A sustainable reduccoordina-tion in poverty requires greater investment in infrastructure in rural areas, where the majority of the poor live (giving them better access as suppliers to and buyers from national and global markets); greater stability of food – particularly rice – prices; labour market reforms aimed at reducing barriers to job growth, especially in urban areas; increased investment in educational quality; and a secure inancing scheme for a permanent social safety net for poor households.
THE PROBLEM OF POOR-QUALITY EDUCATION
Hanushek and Woessmann (2008) ind that mathematics and science skills have a positive and causal relationship with economic growth, while numerous micro-level studies ind that individuals’ mathematics, reading and science test scores are positively correlated with their labour market outcomes (Suryadarma 2010). It is a matter of concern, therefore, that Indonesian schoolchildren perform rather poorly in international mathematics, science and reading assessments.
Mathematics, science and reading performance in Indonesia
the Progress in International Reading Literacy Study (PIRLS) (since 2006); and the Trends in International Mathematics and Science Study (TIMSS) (since 1999). We focus here only on PISA and TIMSS, and we use only the reading test results from the former, because PISA coverage of mathematics began only in 2003 and of science in 2006.13 Both PISA and TIMSS results are scaled so that the average international score is 500, with a standard deviation of 100.
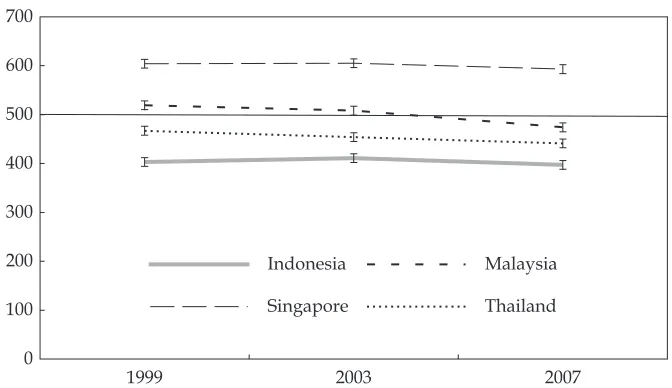
Figure 7 plots the performance of children from Indonesia and some of its Southeast Asian neighbours in the TIMSS mathematics assessments in 1999, 2003 and 2007. It reveals a number of points of concern. First, Indonesia’s performance is consistently far below the international average score of 500. In all three assess-ments, Indonesia scored about 100 points (one standard deviation) below the average.14 Second, Indonesia’s score remained relatively constant between 1999 and 2007, indicating a lack of improvement over almost a full decade. Third, Indo-nesia continued to achieve signiicantly lower scores than each of the neighbour -ing countries shown. The closest comparator, Thailand, scored almost 50 points (half a standard deviation) higher in 2007. Malaysia, an average performer in TIMSS, scored between 0.8 and 1.2 standard deviations above Indonesia through-out the period, although the gap narrowed following a statistically signiicant decline in Malaysia’s performance, by about 0.3 standard deviations, between
13 The discussion of mathematics results in TIMSS draws on Suryadarma (2011).
14 Educational performance studies often use a standard deviation as the unit of analysis, in order to avoid problems stemming from differences in test dificulty. In the literature, a half standard deviation is considered a large difference. Successful education interventions usually improve performance by about 0.3 standard deviations (Pradhan et al. 2011).
1999 2003 2007
0 100 200 300 400 500 600 700
Indonesia
Singapore
Malaysia
Thailand
FIGURE 7 TIMSS Mathematics Scoresa
a Average international score = 500; standard deviation = 100. The vertical bars represent 95% coni-dence intervals. ‘TIMSS’ = Trends in International Mathematics and Science Study.
2003 and 2007. The gap between Indonesia and Singapore – one of the top per-formers in TIMSS – was around two standard deviations in each year.
Corresponding data for science tests are shown in igure 8. Indonesia’s sci -ence performance in TIMSS hovered between 0.6 and 0.8 standard deviations (60 to 80 points) below the average. As with mathematics, there was no improve-ment in the skills of Indonesian students in the three cohorts tested between 1999 and 2007. Indonesia’s performance remained signiicantly poorer than that of its Southeast Asian neighbours. The gap with Malaysia and Thailand – whose scores were nearly identical in 1999 and 2007 – was around 0.5 standard deviations. The closest Indonesia came to Singapore in science performance is about 1.3 standard deviations.
Figure 9 presents the reading performance of Indonesian and Thai students in PISA between 2000 and 2009. No other Southeast Asian country participates in PISA; nor does India or China. We include Russia and Brazil, the other two partic-ipant countries that belong to the emerging economic powerhouse group known as BRICS (Brazil, Russia, India, China and South Africa).15 Like their mathematics and science scores, Indonesian schoolchildren’s reading scores were substantially below the international average – about one standard deviation in 2009 – despite an improvement of 0.3 standard deviations between 2000 and 2009.
Attempts to improve school quality
Given the demonstrated importance of skills to economic growth, the task of improving educational quality in Indonesia should be given high priority. Yet
15 Russia is also a TIMSS participant. Its performance is slightly below that of Singapore, but it is omitted from igures 7 and 8 for reasons of readability.
1999 2003 2007
0 100 200 300 400 500 600 700
Indonesia
Singapore
Malaysia
Thailand
FIGURE 8 TIMSS Science Scoresa
a Average international score = 500; standard deviation = 100. The vertical bars represent 95% coni-dence intervals. ‘TIMSS’ = Trends in International Mathematics and Science Study.
the outlook for improved educational outcomes is not optimistic. Most studies look only at parts of the problem on either the demand or the supply side of edu-cation. Suryadarma (2011) reviews a number of studies in Indonesia and inds that the causes of poor student performance include teacher absence; curricu-lum limitations;16 geographical imbalance in teacher distribution;17 and poorly qualiied teachers. Although these studies can provide a basis for experimen -tation with particular interventions, most such interventions to date have had only a limited positive effect on performance. In short, there is little to indicate that policy makers or even academic researchers understand why Indonesia’s performance is so poor, let alone what policy changes are required to generate signiicant improvement.
Table 3 shows the impact of education interventions implemented in several countries, including Indonesia. The Indonesian community participation inter-vention involved four approaches to improving the inluence of school commit -tees on school management: grants to school commit-tees; training of committee members in management and budgeting skills; democratic election of commit-tee members; and the establishment of a relationship between the commitcommit-tee and the village council.18 In the other interventions shown in the table, merit-based scholarships offer high-performing students the opportunity for further study;
16 For example, only 20 of 39 topics tested in the TIMSS mathematics assessments are taught to all Indonesian students (Suryadarma 2011: 169).
17 For example, 34% of primary schools have too few teachers according to a standard determined by the Ministry of National Education (Del Granado et al. 2007: 18).
18 In Indonesia, a school committee is a formal body operating in a school. The relevant regulation requires that it include parents, teachers and community members.
2000 2003 2006 2009
0 100 200 300 400 500 600 700
Indonesia
Thailand
Brazil
Russia
FIGURE 9 PISA Reading Scoresa
a Average international score = 500; standard deviation = 100. The vertical bars represent 95% coni-dence intervals. ‘PISA’ = Programme for International Student Assessment.
test-based teacher bonuses provide a monetary incentive for teachers to achieve improvement in their students’ test scores; and camera-based monitoring requires teachers to take a daily photograph of themselves teaching, as a way to reduce teacher absence. (Teachers are paid for each picture supplied.)
The most successful of these interventions improved student performance by no more than 0.5 standard deviations, while most did so by only about 0.2 stand-ard deviations. This suggests that at least four of these interventions would need to be successfully implemented in Indonesia for it to achieve parity with Malaysia on measures such as those just discussed. Alternatively, it would be necessary to devise an intervention that is so effective that it could improve school quality by around 0.8 to 1 standard deviations.
With this in mind, one approach Indonesia could take would be to investigate what factors explain superior educational outcomes in neighbouring countries at comparable levels of development, and then try to apply the lessons learned from this exercise in its own classrooms, taking into account local institutional and cul-tural characteristics. For the time being, however, the government is implement-ing a teacher certiication program in the hope of improvimplement-ing school quality.19 The program began in 2007. Once certiied, teachers retain this status for the rest of their careers.
Initially, an in-service teacher had to pass two steps to be certiied: a compe -tency examination administered by a university faculty of education, and a per-formance assessment, including classroom observation and an examination of students’ work. Teachers who failed to gain certiication could undertake further training or a government examination. Successful completion of either option guaranteed certiication.
After experimenting with this approach, the government decided in 2008 to abandon the competency examination because of implementation dificulties. These included problems in maintaining conidentiality of test contents; the con -tinual need to prepare and evaluate a large number of tests; and the logistical dif-iculties of supervising the examination of some 200,000 teachers annually. Instead, it was decided to base certiication of in-service teachers on their ‘portfolio’ (Jalal et al. 2009: 77), an instrument based on qualiications and main duties; professional
19 The following description of the program is adapted from Jalal et al. (2009). TABLE 3 Impact of Selected Education Interventions on Performance Scores
(in standard deviations)
Intervention Country Impact
Community participation Indonesia 0.17–0.22
Merit-based scholarships Kenya 0.12
Test-based teacher bonuses Kenya 0.14–0.34
Test-based teacher bonuses India 0.12–0.19
Camera-based monitoring India 0.17–0.21
Class size reduction Israel 0.10–0.50
development; activities outside day-to-day teaching (such as participating in scientiic forums and assisting with administration of organisations); and the achievement of awards for teaching. According to Jalal et al. (2009), the portfolio instrument in practice emphasises academic qualiications, additional education courses and training undertaken, and years of teaching experience. In a trial of the current instrument, 75% of applicants were successful in gaining certiication.
In contrast with their in-service counterparts, pre-service teachers are required to participate in a year-long professional teacher education program after com-pleting an undergraduate degree. The pre-service certiication program began only in late 2010, so there is yet to be any evaluation of its effectiveness.
The government allocates Rp 2 million per teacher to cover certiication costs: Rp 0.5 million for the portfolio assessment and an average of Rp 1.5 million for any necessary remedial training (Hastuti et al. 2009: xi). Far more signiicant, however, is the ongoing cost of paying certiied teachers a monthly ‘professional allowance’, which effectively doubles average take-home pay to about Rp 2.4 mil-lion per month.20
The Ministry of Education uses monitoring and evaluation teams to assess the certiication program, but these teams focus on the program’s implementation rather than on the ultimate target – its impact on school quality. The only study to evaluate the latter is by Hastuti et al. (2009), who ind that the certiication process, which focuses on inputs (such as experience, educational qualiications and number of additional training certiicates) to proxy for output (teaching qual -ity), is unlikely to provide a strong incentive for teachers to improve their per-formance. The study does not ind any positive effect of the program on school quality, and the authors are pessimistic about its ever having such an effect, given that the assessments fail to focus on teachers’ success in educating students.
Private sector education initiatives
A number of non-government organisations (NGOs) also have programs to improve the quality of education in Indonesia. In the following paragraphs we discuss the efforts of two such groups that we interviewed for this survey. The irst is the Putra Sampoerna Foundation (PSF), which began its education initia -tives in 2001 by providing scholarships. One of the organisation’s mandates is to use education as a means to help children of poor families to avoid ‘inherit-ing’ poverty, so it focuses particularly on schools attended by poor children (PSF 2010). In 2006 the foundation began its school quality improvement program, encompassing teacher training and school management improvement, both at the senior secondary level.
Around 16,000 teachers have passed through the training program since 2006. It has two streams. The irst is the basic program, which is funded through the ’corporate social responsibility’ (CSR) fund allocations of private companies.21
20 Chen (2009: 19) calculates average monthly teacher take-home pay in 2008 at Rp 1.2 million.
This program has evolved over time by trial and error, but little information on its content is publicly available. The second stream is the master teacher training pro-gram. This is tailored to the needs of individual teachers, and is available only to those considered to have high potential. The curriculum for this second program was designed in collaboration with a number of high-quality Indonesian senior secondary schools, together with universities in Australia and Singapore. Partici-pant teachers are regularly monitored after returning to their original schools.
PSF staff whom we interviewed in May 2011 reported that they found training teachers very dificult, and estimated that their efforts have an overall success rate of less than 50%. An alternative approach would be to improve the qual-ity of teacher training institutions, which would directly address the problem of low-quality teaching; one of our respondents felt that this approach may be more eficient than continuous training of existing teachers. It would require close col -laboration with state universities, however, and would involve a long-term effort. Instead, the foundation chose to establish its own teacher training institution in 2009.
In PSF’s school management quality improvement program, its staff work closely with a school for three years. First, PSF approaches local governments considered to be seriously interested in improving school quality. Second, after reaching agreement to implement the program, PSF seeks funding from within the region concerned, usually in the form of company CSR funds. It then approaches a school whose principal is regarded as being dedicated to school improvement. PSF works only with schools of medium quality, because working with a school at the bottom of the quality distribution is considered too dificult. After three years the school’s improvement is evaluated using three indicators: student performance at national examinations; the principal’s leadership; and community engagement.22 An additional impact evaluation is conducted two years after the program has ended. In total, PSF has worked with 23 schools across Indonesia; our respondents report the results to be encouraging: a school in Bali that took part in the program has become so successful that well-off families now want to enrol their children, making it more dificult for children from poor families to secure a place.23
The latest PSF initiative is the Sampoerna Academy, a senior secondary educa-tion provider. The academy began operating in 2009, and was designed to pro-vide access to world-class education for poor but gifted youth. It has adopted a boarding school system, and established two schools in 2009 – a refurbished state high school in Malang and a brand new school in Palembang, funded by dona-tions from companies operating in the area and from the provincial government. Another NGO seeking to improve education in Indonesia is the much newer Indonesia Mengajar (IM), whose main activity is recruiting high-quality recent university graduates, providing them with teacher training and sending them as ‘young teachers’ (pengajar muda) to primary schools in remote areas. IM was established in late 2009, and sent out its irst batch of teachers – 51 individuals for
22 Only the irst of these indicators can be measured and compared with a pre-program benchmark; the other two are qualitative indicators based on views expressed by people interviewed about the program’s impact.
51 schools – in November 2010. A second group is to be deployed to a further 73 schools in late 2011, so that IM’s reach after two years of operation is expected to be 124 schools. The plan is to work with each school for ive years, providing ive teachers who will each work for one year in sequence.
The strategy behind IM is two-fold. The irst objective is to address teacher shortages in remote areas, where 66% of schools are deemed to have too few teachers (Del Granado et al. 2007: 19; see footnote 17), and thus to improve teach-ing quality in those areas. The second objective is to provide leadership trainteach-ing.24 Sending additional talented young teachers is an idea radically different from the current practice of further training existing teachers, and IM staff interviewed considered it the best way of achieving these two objectives.
Six months into the deployment of the irst batch of young teachers, IM staff interviewed report seeing some improvement in the targeted schools (although it is too early to know if this can be sustained, particularly after the IM teachers have moved on). First, reduced absenteeism and other changes in behaviour sug-gest that students are ‘rediscovering the joy of learning’. Second, imitation of IM teacher techniques (such as the use of lesson plans) suggests that the program is motivating existing teachers to improve their performance. Third, effective school hours have improved dramatically, because the IM teachers are almost never absent.25 Finally, respondents claim that community attitudes towards education have improved. Interviewees also report that some existing teachers are jealous of their IM counterparts. The resentment stems from the fact that the latter are more popular with the students than the regular teachers and that, as newcomers, they are considered to be meddling too much in school affairs.26
Aside from the fact that the IM teachers are chosen from a pool of high-achieving individuals, interview responses suggest two explanations for their effectiveness. First, they remain outside the education system, so the school principal and the district education ofice have no authority over them. Second, they have only a one-year deployment, and so face a wholly different set of constraints from other teachers, who may spend their entire career in the school. For example, the IM teachers have little incentive to concern themselves with the wishes or interests of the principal or the head of the education ofice, because their career prospects are not dependent on the school.
The IM teachers currently receive Rp 4–7 million per month in salary and allowances, depending on the remoteness of the school. Given that the average monthly income of teachers in Indonesia in 2008 (excluding the certiication pro -fessional allowance) was just Rp 1.2 million (see footnote 20), even incumbent teachers receiving the professional allowance probably earn only slightly more than half of an IM teacher’s income. Like PSF, IM receives funding from company CSR funds; it also receives in-kind donations. The organisation is setting up a
24 IM’s motto is ‘Setahun mengajar, seumur hidup menginspirasi’: ‘teach for a year, inspire for a lifetime’ (<http://www.indonesiamengajar.org/index.php?m=proil.tentangindone -siamengajar>).
25 The absence rate in public primary schools in Indonesia is around 19% (Usman, Akhma-di and Suryadarma 2007).