Probability Statistics for Engineers Scientists
Teks penuh
Gambar


![Figure 9.8: P[f1−α/2(v1, v2) < F < fα/2(v1, v2)] = 1 − α.](https://thumb-ap.123doks.com/thumbv2/123dok/2188292.1617991/42.525.187.427.419.603/figure-p-f-a-v-f-fa-a.webp)
Garis besar
Dokumen terkait
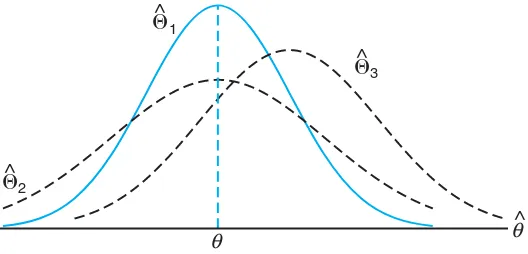
One can glean from the two examples above that the sample information is made available to the analyst and, with the aid of statistical methods and elements of probability,
This process is called estimation , and the statistic we used (the sample mean) is called an estimator.. Using the sample mean to estimate µ is so obvious that it is hard to imagine
This exam can be taken by anyone who missed a regular exam or exams and did not qualify for or could not make it for any reason to the makeup exam given within 3 days after
A large number of practical situations can be described by the repeated per- formance of a random experiment of the following basic nature: a sequence of trials is performed so that
In the case of tossing a coin three times, the variable X, representing the number of heads, assumes the value 2 with probability 3/8, since 3 of the 8 equally likely sample
4.84 Referring to the random variables whose joint probability density function is given in Exercise 3.41 on page 105, find the expected weight for the sum of the creams and toffees
It is necessary for the data analyst to focus on an appropriate fit to the data and use inferential methods discussed in this chapter. Hypothesis testing on the slope of the
In an industrial example, when a sample of items selected from a batch of production is tested, the number of defective items in the sample usually can be modeled as a hypergeometric
